

Abstract
In utero exposure to THC, the psychoactive component of marijuana, is associated with an increased risk for neurodevelopmental defects in the offspring by interfering with the functioning of the endocannabinoid (eCB) system. At the present time it is not clearly known whether the eCB system is present prior to neurogenesis. Using an array of biochemical techniques we analyzed the levels of CB1 receptors, eCBs (AEA and 2-AG), and the enzymes (NAPE-PLD, DAGLα, DAGLβ MAGL and FAAH) involved in the metabolism of the eCBs in chick and mouse models during development. The findings demonstrate the presence of eCB system in early embryo, prior to neurogenesis. The eCB system might play a critical role in early embryogenesis and there might be adverse developmental consequences of in utero exposure to marijuana and other drugs of abuse during this period.
Keywords: Endocannabinoid, CB1, anandamide, 2-arachidonoylglycerol, G-protein, forebrain, chick, embryo
1. Introduction
Marijuana is the drug most commonly abused by pregnant women in the world (WHO, 1997). The rates of newborns prenatally exposed to marijuana in 1990 were estimated to range from 3 to 20% (SAMHSA, 2002). In utero exposure to marijuana is associated with fetal growth restriction, withdrawal symptoms in the neonate, and neurodevelopmental defects in the offspring, including an increased risk for ADHD and learning disabilities, as well as with an increased risk for more severe nervous system malformations, such as anencephaly (van Gelder et al, 2008; Keegan et al, 2010). The potentially adverse effects of marijuana abuse during pregnancy are aggravated by the fact that the potency of marijuana, in terms of content of its psychoactive constituent Δ9-tetrahydrocannabinol (THC), has increased nearly 25-fold since 1970, when the content of THC in marijuana was 1.25%; it now reaches 15–30% in some preparations (WHO, 1997; ElSohly 2010). In the adult CNS, THC exerts its effects by interfering with the eCB system; this system is responsible for modulating synaptic release in motor control, memory and other brain functions (Pertwee, 2008). The eCB system consists primarily of Gi/o protein-coupled cannabinoid 1 (CB1) and 2 (CB2) receptors, endogenous ligands 2-arachidonoylglycerol (2-AG) and N-arachidonoylethanolamide (AEA), as well as enzymes responsible for ligand metabolism. These include sn-1-selective diacylglycerol lipases (DAGLα/β; isoforms α and β), which are responsible for the synthesis of 2-AG, while N-acyl phosphatidyl ethanolamine phospholipase D (NAPE-PLD) is mainly involved in the AEA synthesis. Monoacylglycerol lipase (MAGL) and fatty acid amide hydrolase (FAAH) are involved degradation of 2-AG and AEA, respectively (Pertwee, 2008). THC acts as an exogenous cannabinoid in the adult brain, mimicking the effects of eCBs on CB receptors (Pertwee, 2008). Some components of the eCB system have been detected during 1) peri-implantation, where the eCB system is required for proper implantation of the trophoblast (Paria and Dey, 2000; Paria et al, 2001; Sun and Dey, 2008; Taylor et al, 2010), and 2) neurogenesis, where the eCB system is required for neurogenesis, proliferation, differentiation, migration and fasciculation of nascent neurons (Berrendero et al, 1999; Berghuis et al, 2005, 2007; Aguado et al, 2005; Bromberg et al, 2008; Harkany et al, 2008; Mulder et al, 2008; Vitalis et al 2008), reviewed in Fernández-Ruiz et al (1999), Harkany et al (2007), Anavi-Goffer et al (2009), Galve-Roperh et al (2009) and Psychoyos et al (2009). So far, very little is known regarding whether the eCB system is present in the developmental time window between peri-implantation and the start of neurogenesis, and if so, what role it plays during this time window (Anavi-Goffer et al, 2009; Fride, 2009; Psychoyos et al, 2009). This specific period corresponds to the initial stages of organogenesis, and in particular, the formation of the forebrain, midbrain and hindbrain components of the nascent brain. During this period, which initiates at gastrulation, a neural plate is formed, emanating anterior to Hensen’s node (Wittler and Kessel, 2004; Stern 2005). The neural plate is responsible for generating the anterior neural folds, which contain precursor populations for the fore-, mid-, and hindbrain (stages 5 to 8 in chick and E7.75 in mouse). The anterior neural folds subsequently form the brain primordium, consisting of three neuroepithelial vesicles (fore-, mid- and hindbrain). This occurs at stages 9 to 11 in chick and E8.75 in mouse (pre-neuronal phase; reviewed in Balinsky, 1975; Newgreen et al 2009). Herein we have made an attempt to detect the presence of components of the eCB system during this developmental period i.e. prior to neurogenesis, using the chick model system and an array of biochemical techniques.
2. Materials and Methods
2.1. Animals
Chicken embryos (n = 578) were dissected at stages XIII to 45 according to the criteria of Eyal-Giladi and Kochav (1976) and Hamburger and Hamilton (1951). Chicks (n = 8) were hatched at post-hatch day 1 (P1), anesthetized with halothane, and sacrificed by decapitation. Pregnant C57BL mice (n = 8) were euthanized by CO2 asphyxiation using compressed gas. C57BL mouse embryos (n = 79) were dissected from E7.5 to E18.0 as previously described (Nagy et al, 2003; Shea and Geijsen, 2007). All procedures were in accordance with IACUC guidelines.
2.2. Measurement of eCB levels
The eCB assay was performed following the liquid chromatography-mass spectrometry (LC-MS) method using the isotopic dilution procedure as described previously with minor modifications (Vinod et al, 2005). Chick tissue: Embryos at stages 9 to 11 (n = 180) and stages 17 to 18 (n = 120) were explanted in ice cold PBS and briefly trypsinised (0.025% in ice cold PBS) prior to isolation of the brain. For stage 44, chick embryos were decapitated and the brain quickly (<30 s) removed. Mouse tissue: The anterior neural folds of E10.5 embryos (n = 40) and the entire brain of stage E18 (n = 15) fetuses were dissected, and the neural tissue/brains were snap frozen and stored at -80°C until required for extraction procedures. The tissue was homogenized in 4 ml of chloroform-methanol-Tris buffer (2:1:1, pH 7.4) containing 0.25 mM PMSF, 20 μl of 1% BHT, 2-AG-d8 (500 ng) and AEA-d8 (1 ng). The tissue homogenate was centrifuged and the organic layer was dried under nitrogen. The residue was dissolved in 0.3 ml of ethyl acetate and recentrifuged. The supernatant was dried under nitrogen. The residue was redissolved in ethyl alcohol (40 μl) and transferred to a vial for the measurement of 2-AG and AEA by LC-MS (Agilent 1100 series mass LC-MSD). The separation was achieved on a supelcosil LC-8 column using methanol-ammonium acetate-acetic acid (85:15:0.05) as a mobile phase.
2.3. Real-time quantitative PCR (qPCR)
Microdissection and RNA extraction
Embryonic regions of interest were excised with the guidance of fate maps (Spratt, 1952; Rosenquist, 1966; Wittler and Kessel, 2004) and the use of brief trypsinisation where applicable (0.025% trypsin in PBS). RNA was extracted from the anterior neural plate (stages 3− to 11; n = 80) and the presumptive forebrain (stages 10 to 23; n = 30) of chick embryos, the hypothalamus of P1 chicks (n = 3), the anterior neural plate (E7.5; n = 6) and the forebrain (E8.5 to 10.5; n = 18) of mouse embryos, and the brain of adult mice (n = 3), using Arcturus® PicoPure® RNA Isolation Kit (Applied Biosystems). Total RNA samples were treated with DNase I for 20 minutes (10 units/ml; Thermo Scientific) to remove potential genomic contamination. RNA quality and concentration were measured with a Nanodrop spectrophotometer (ND-1000, Thermo Scientific) and 1% agarose gel stained with ethidium bromide and 1kb ladder (Promega). RNA was stored at -80°C prior to use. cDNA synthesis: One microgram of total RNA from each sample was reverse transcribed to cDNA using High Capacity RNA-to-cDNA Kit (Applied Biosystems, Foster City, CA). Reactions in which no reverse transcriptase was included were run to control for genomic DNA contamination. cDNA was quantified using ND-1000 (Nanodrop). qPCR: qPCR reactions performed using Gene Expression Assays (Applied Biosystems) and ABI Prism 7900HT (Applied Biosystems). The following primers and probes were obtained as inventoried Gene Expression Assays (Applied Biosystems): CB1 (Gg03357732_s1), DAGLβ (Gg03354228_m1), NAPE-PLD (Gg03354924_m1), MGLL (Gg03311189_m1) and GAPDH (Gg03346982_m1) in chick, and CB1 (Mm00432621_s1), DAGLα (Mm01701558_g1), DAGLβ (Mm00523381_m1), NAPE-PLD (Mm00724596_m1), FAAH (Mm00449274_m1) and GAPDH (4352932E); The following chick assays were designed using Primer Express 3.0 software (Applied Biosystems): DAGLα (F5′-CCT TCC TTC CCC CTT AGT TCA, R5′-CAC GCC TGT GGG AGT GAT G, FAM-CCG GAG AGC TCA TG) and FAAH (F5′-CGT CCT GCA GC CAC TGA GT, R5′-CCA ACA CCA CTT CCA CCT AAC A, FAM-CCA ACG CAA ACG C). Three independent runs were carried out for each set of samples. For each run, triplicate reactions were carried out for each sample. Reactions were set on 384-well plates (BioRad) in a volume of 20 μl containing 100 ng of cDNA template, 1 μl Gene Expression Assay and 10 μl TaqMan Gene Expression Master Mix (Applied Biosystems). A no-template control (NTC) was performed for each primer set used. The thermal profile was as follows: 10 minutes at 95°C, followed by 45 cycles of amplification where each cycle comprised of 12 seconds at 95°C and 60 seconds at 60°C. Specificity of PCR products was determined by melting curve analysis immediately following amplification. Primer validation and data analysis: Prior to mRNA quantification, the relative efficiency of gene amplification for each given Gene Expression Assay was validated using the relative efficiency curve method, with RNA derived from chick stage 17 forebrain and mouse GD9.5 brain, and serial dilutions of 1000 ng, 100 ng, 10 ng and 1 ng per reaction sample. Data obtained was analyzed with the use of SDS2.3 software (Applied Biosystems). The amount of target, normalized to GAPDH (endogenous reference) and relative to a calibrator was given by 2−ΔΔCt. Absolute quantification in chick: For absolute quantification a CB1 plasmid obtained from D. Wilkinson was used (total length of plasmid 4191 bp; Christiansen et al, 2001). CB1 plasmid was linearized with Sal I (New England Biolabs). To create a standard curve using CB1 plasmid as template, we followed the recommendations of Applied Biosystems (Applied Biosystems 2003). The mass (in g) of one single plasmid molecule (m1) was calculated: m1 = (n) × (1. 096e-21 g/bp) where: n = CB1 plasmid size (in bp), thus m1 = 4191 × 1. 096e-21 g = 4.59334e-18 g. We then calculated m, defined as the mass of CB1 plasmid needed to contain 3,000,000 to 30 copies of CB1, using m = copy number of CB1 x mass of single CB1 plasmid with mass of single CB1 plasmid = m1; For 300,000 copies, m = 1.378e-12 g; for 30,000 copies, m = 1.378e-13 g; for 3,000 copies, m = 1.378e-14 g; for 300 copies, m = 1.378e-15 g; and for 30 copies, m = 1.378e-16 g. The concentrations of CB1 plasmid needed to achieve the copy number of interest was then calculated: to this end, m was divided by the volume to be pipetted into each reaction (5 μl), this a final concentration of CB1 plasmid was 2.756e-12g/μl for 300,000 copies, 2.756e-13g/μl for 30,000 copies, 2.756e-14g/μl for 3,000 copies, 2.756e-15g/μl for 300 copies and 2.756e-16g/μl for 30 copies. A serial dilution of the CB1 plasmid was prepared, so as to obtain a copy number of CB1 plasmid of 300,000, 30,000, 3,000, 300 and 30 copies per 5 μl, using an initial workable concentration of 2e-12g/μl and the formulation C1V1 = C2V2. Using the SDS2.3 software, a standard curve was created, in which x-axis = copy number (ranging from 300,000 to 30 copies), and y-axis = Ct values obtained. The standard curve had y-intercept = 45.226937 and a slope = -3.8234696. The following equation was used for absolute quantitation of CB1, in which .
2.4. End point RT-PCR
RNA was extracted and subjected to DNase I as above (section 2.3) from the following regions of interest: (1) ectodermal layer/anterior neural plate of stage 3+ to 4+ embryos (n=60), the neural folds of stage 5+ to 8− embryos (presumptive fore-, mid-, and hindbrain areas; n=40), the brain primordium of stage 11+ embryos (fore-, mid-, and hindbrain precursors; within the hindbrain, rhombomeres r0/r1 and r2–r6; n=40), and anterior primitive streak/Hensen’s node of stage 3+ to 8− embryos (n= 60), using Arcturus® PicoPure® RNA Isolation Kit (Applied Biosystems). RNA quality and concentration were measured with a Nanodrop spectrophotometer (ND-1000, Thermo Scientific) and 1% agarose gel stained with ethidium bromide and 1kb ladder (Promega). RNA was stored at -80°C prior to use. Using Ensembl, UCSC Genome and Primer 3 Output softwares, the following primers were designed: CB1, Accession number NM_001038652, F5′CTGTCCTGCAGAGGGCTTAC3′, R5′CCCTGAACTCACAACCACCT3′, 184 bp cDNA product; DAGLa, XM_423696, F5′TTTCTGCAGCCAAAGTGATG3′, R5′AAAACCCCTCCAAGCTGATT3′, 185bp; GADPH, NM_204305, F5′ACGCCATCACTATCTTCCAG3′, R5′CAGCCTTCACTACCCTCTTG3′, 579bp) and MAGL, XM_414365, F5′CGGCTCTTCTGACAAGCTCT3′, R5′GCTGAAACCTTCTGGCTGAC3′, 185bp cDNA. RT-PCR was performed using SuperScript One Step RT-PCR (Invitrogen) in 50 μl reaction volumes. Primers were obtained by DNA Integrated Technologies, and used at 0.2 μM. A Thermal cycler (Biometra, model T Gradient) was preheated to 50°C. The RT-PCR profile used was as follows: 1 cycle (50°C, 30 minutes) for cDNA synthesis, followed by 35 cycles of PCR amplification: denaturation (94°C, 15 seconds), annealing (55°C 30 seconds) and extention (72°C 30 seconds), followed by 1 cycle of 72°C for 5 minutes for extension. Absence of genomic DNA was verified by omitting the addition of RT/Platinium Taq mix. Instead, 2 units Platinium Taq DNA polymerase (Invitrogen) was added per 50 μl reaction volume. A 10 μl aliquot from each PCR reaction was run on a 2% agarose gel using a 100 bp marker ladder (Promega). The gel was stained with ethidium bromide.
2.5. Immunohistochemistry
Chick whole mount embryos (n = 40) were processed as previously described (Psychoyos and Finnell, 2009a). The following primary antibodies we used: CB1 (PA1-745; Pierce-Antibodies; 1:200 dilution), DAGLα (sc-133308; Santa Cruz Biotechnology; 1:200) and En1 (Developmental Hybridoma Bank; 1:1). Secondary antibodies (FITC or HP-conjugated goat anti-rabbit IgG, Jackson ImmunoResearch Laboratory) were used at 1:400. In order to ensure penetrability of the primary antibody, Triton®X-100 (Sigma Aldrich) was used at all steps, at a concentration of 0.5% in PBS, according to Psychoyos and Finnell (2009a).
2.6. Western blot analysis
Chick embryos at stages 4 (n = 30; entire embryo), 10 (n = 20; brain), 17 (n = 10; brain) and post hatching day 1 chick Tectum (P1t, n = 3) and Cerebellum (P1c; n = 3) were dissected under ice cold PBS and trypsinisation (0.025% trypsin in PBS) where applicable. Tissues were homogenized in ice-cold RIPA buffer (Sigma-Aldrich) supplemented with PMSF (1 mM) and a protease inhibitor cocktail (Sigma-Aldrich). Homogenates were kept on ice for 30 minutes, sonicated for 3 minutes, and centrifuged at 12,000 × g for 10 minutes at 4°C. Proteins were fractionated by SDS-PAGE using 4 to 15% gradient Tris-HCl Ready gels (Bio-Rad) and then electrotransferred at 15V to Immun-Blot PVDF membrane (Millipore) 15 minutes. The blots were processed for standard immunochemistry using the following antibodies; CB1 (PA1-745, Pierce-Antibodies; 1:1,000 dilution), DAGLα (sc-133308, Santa Cruz Biotechnology; 1:1,000 dilution) and anti-β-actin (sc-47778, Santa Cruz Biotechnology; 1:2,000 dilution).
2.7. In situ hybridization
In situ hybridization with Sox2 probe (a gift of R. Lovell-Badge) was performed according to Psychoyos and Finnell (2008).
2.8. Agonist-stimulated [35S]GTPγS binding assay
Crude plasma membranes were isolated from the brain primordia derived from stage 9–11 and stage 45 chick embryos (n = 81), as previously described (Vinod et al, 2005). The CB1 receptor-mediated [35S]GTPγS binding assay was performed as described previously with minor modifications (Vinod et al, 2005). Briefly, an aliquot of membrane (10–20 μg protein) was pre-incubated in assay buffer (TME buffer, 0.1% fatty acid free BSA and 100 nM NaCl) containing GDP (30 μM) and adenosine deaminase in silicone-treated test tubes for 15 minutes. Later [35S]GTPγS (0.1 nM) was added to the reaction mixture and incubated for 1 hour at 37°C. The CB1 agonist CP-55,940 (1μM; Tocris) was used to examine the CB1 receptor-mediated [35S]GTPγS binding. The basal activity was estimated in absence of CP-55,940. The non-specific binding of the radioligand was determined in presence of 10 μM GTPγS. The reaction was terminated by addition of ice-cold Tris-HCl buffer containing 0.1% BSA followed by rapid filtration. The radioactivity was then measured using liquid scintillation spectroscopy. CB1 receptor antagonist/inverse agonist SR141716A (1 μM; NIH) was used for testing the specificity of CB1 receptor-mediated activation of G-protein (inhibition studies).
2.9. Photography
Embryos were photographed as whole mount preparations with a fluorescence microscope (model MZ9.5; Leica Microsystems Ltd, Switzerland), equipped with a 5.0 megapixel CDD 35mm digital camera (model DFC480; Leica Microsystems Ltd, Switzerland). Image acquisition was controlled via the MetaView software. Confocal images were obtained under Z-sectioning with an Upright Zeiss LSM 510 confocal microscope. Image acquisition was performed using Zeiss LSM 510 software.
2.10. Statistics
For LC-MS measurements the statistical analysis for chick data was performed using ANOVA, followed by Tukey’s multiple comparison test (p <.05), and for mouse, using t-student’s test (p <.05). For Agonist-stimulated [35S]GTPγS binding assay, all tests were two tailed with α= 0.05. qPCR data was analyzed using ANOVA, followed by Tukey’s multiple comparison test (p <.05).
3. Results
3.1. Levels of eCBs 2-AG and AEA
2-arachidonoylglycerol (2-AG) and N-arachidonoylethanolamide (AEA) are the principal endogenous ligands for CB1 receptor in the adult brain (Devane et al, 1992; Mechoulam et al, 1994; Sugiura et al, 1995). In this study, we quantified eCBs 2-AG and AEA from brain progenitors of very young chick and mouse embryos using an LC-MS method.
3.1.1. Levels of eCBs in chick embryos
In the chick, we used the brain tissue derived from stage 9–11 (equivalent to mouse E8.25), stage 17–18 (equivalent to mouse E10.5) and stage 44 (equivalent to mouse E18) embryos (Figure 1A). 2-AG measurements: We detected initial levels of 2-AG of 1.05±0.05 nmol/g tissue at the 9–11 stage (n=3–4). Levels of 2-AG significantly increased throughout chick brain development, with levels reaching 2.03±0.15 nmol/g tissue at stage 17–18 (n=3–4) and 9.34±0.12 nmol/g tissue at stage 44 (n=3–4; p <.05; Figure 1B). AEA measurements: We detected initial levels of AEA of 3.60±0.60 pmol/g tissue at the 9–11 stage (n=3–4). Levels of AEA initially decreased with levels reaching 1.55±0.11 pmol/g tissue at stage 17–18 and then increased to reach 10.63±0.67 pmol/g tissue at stage 44 (n=3–4; p <.05; Figure 1B). Thus, 2-AG and AEA follow significantly different patterns throughout the stages under study: 2-AG contents are shown to increase progressively, whereas AEA levels fluctuate between different stages.
Figure 1. Levels of eCBs 2-AG and AEA in chick and mouse embryos.
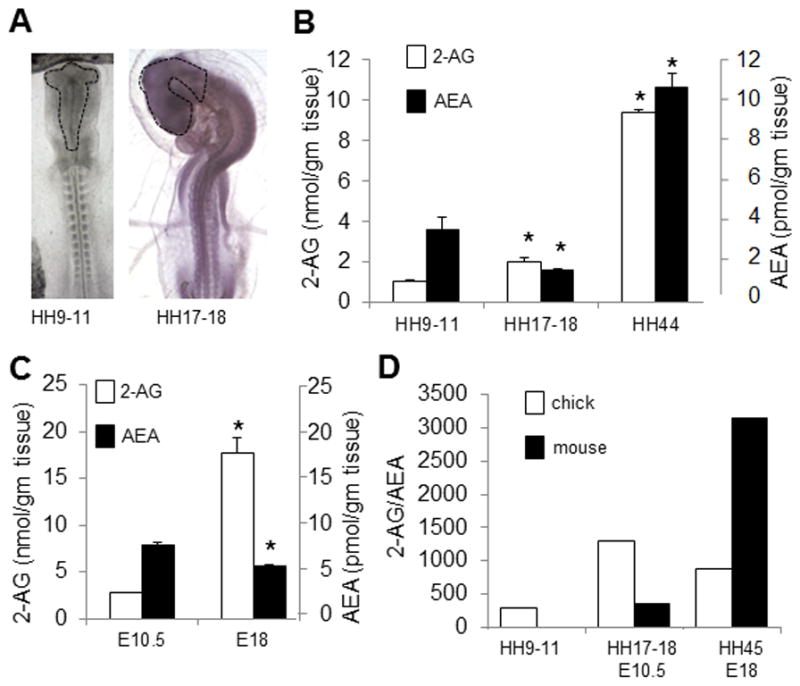
(A) Areas of brain primordium from which 2-AG and AEA were extracted in chick. Levels of 2-AG and AEA in chick (B) and mouse (C) brain primordia at different stages using LC-MS method; 2-AG and AEA are detected in both chick and mouse brain at the earliest stages of brain development. (D) Comparison between relative 2-AG and AEA levels throughout different developmental stages in chick and mouse brain primordium: significantly higher levels of 2-AG compared to AEA are found in both chick and mouse brain (n=3–5 for each developmental time point; The data is pooled from the 2-AG/AEA measurements (*p < .05).
3.1.2. Levels of eCBs in mouse embryos
For mouse, we used the anterior neural folds of E10.5 embryos and the brain of E18 embryos. 2-AG measurements: We found that, similar to chick, levels of 2-AG increased throughout development, with levels at 2.8±0.10 nmol/g tissue at E10.5 and 17.65±1.72 nmol/g tissue at E18 (n=3–4; Figure 1C). AEA measurements: In contrast to our results in chick, we detected initial levels of AEA of 7.85±0.35 pmol/g tissue at E10.5 (n=3–4) and significantly lower levels by E18 (5.63±0.22 pmol/g tissue; n=3–4; Figure 1C).
3.1.3. 2-AG:AEA ratio
In chick, relative levels of 2-AG and AEA remain high throughout development, with the 2-AG:AEA ratio varying between 291:1 at stage 9 to 11, 1306:1 at stage 17 to 18 and 881:1 at stage 44. Similarly, in mouse, relative levels of 2-AG and AEA also remain high at the stages under study, with a 2-AG:AEA ratio of 356:1 at E10.5 and 3137:1 at E18. (Figure 1D).
3.2. Characterization of CB1 during neurodevelopment
3.2.1. qPCR and RT-PCR with CB1
We find CB1 mRNA and functional CB1 receptor in developing chick and mouse embryos, prior to neuronal development: For the chick studies, we compared levels of CB1 mRNA in the forebrain at stages 10, 17, 23 and the hypothalamus of P1 chicks with qPCR (Figure 2A). We observed levels of CB1 mRNA expression to increase steadily throughout development, with a 1.68 fold increase by stage 17 compared to stage 10, and a 2.93 fold increase by stage 23 (p <.05); by comparison, there is a 17.45 fold increase by P1 (p <.05). Similarly, absolute quantification analysis shows absolute mRNA quantities of 1.13±0.08×10⁴ molecules per 100 ng tissue in the forebrain of stage 10 embryos, compared to 4.07±0.21×10⁴ molecules per 100 ng tissue in the forebrain of stage 23 embryos, and 23.03±1.73×10⁴ molecules per 100 ng tissue in the hypothalamus of P1 chicks (Figure 2B). Our qPCR results in mouse corroborate those in the chick: we find a progressive increase in the relative levels of CB1 mRNA when comparing expression in samples derived from the presumptive forebrain of E8.5, E9.5 and E10.5 to the anterior neural plate of E7.5, with a 1.37 fold increase by E8.5 compared to E7.5, a 4.34 fold increase by E9.5 (p <.05) and a 9.43 fold increase by E10.5 (p <.05; Figure 2C).
Figure 2. CB1 transcript in chick and mouse embryos (qPCR data).
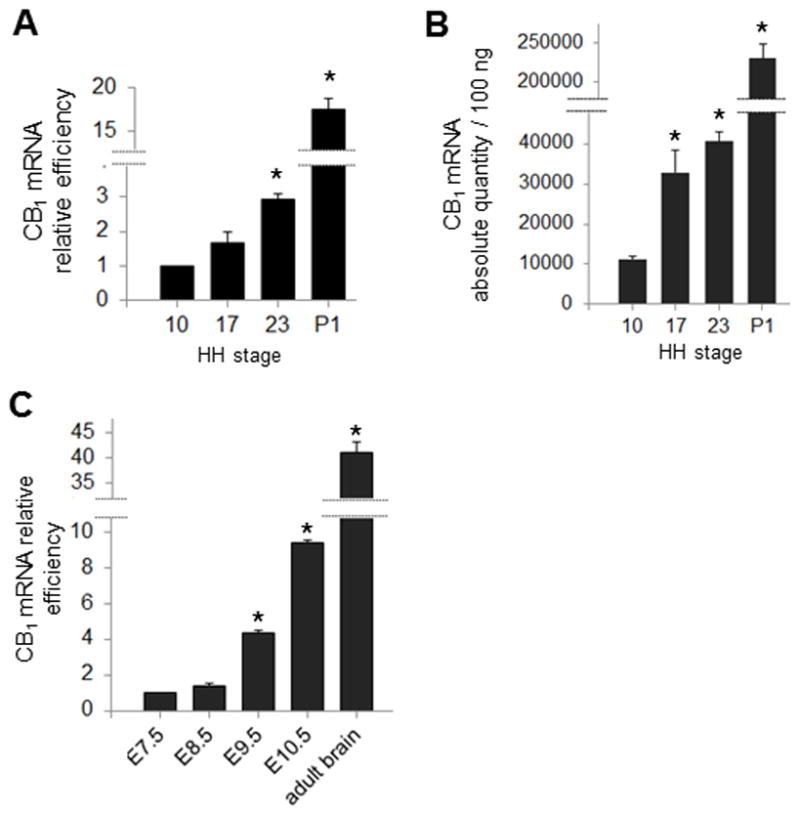
(A) Relative quantitation of CB1 throughout brain development in chick: Expression of CB1 at stages 17, 23 and P1 is compared to expression at stage 10. (B) Absolute quantification of CB1 mRNA at stages 10, 17, 23 and P1. (C) Relative quantitation of CB1 throughout brain development in mouse: the expression of CB1 at E8.5, E9.5, E10.5 and adult brain is compared to expression at E7.5 (*p < .05).
We also analyzed CB1 mRNA levels in the chick embryo prior to the formation of the forebrain primordium, i.e. during neurulation (stages 3− to 11) using RT-PCR and qPCR (Figure 3). The areas were excised with the guidance of chick developmental fate maps (Spratt, 1952; Rosenquist, 1966; Wittler and Kessel, 2004) and are shown in Figure 3A: They correspond to the anterior neural plate (anp; presumptive forebrain territory during gastrulation), Hensen’s node, and presumptive forebrain, midbrain and hindbrain territories at stages 5+ to 11+. In RT-PCR studies, we find that CB1 mRNA is detectable in the anterior neural plate of stage 3+ to 4+ embryos (Figure 3B), and the presumptive forebrain, midbrain and hindbrain territories at stages 5+ to 8− and stage 11+ (other stages or regions have not been investigated herein; Figure 3C and D).
Figure 3. CB1 transcript in chick embryos: RT-PCR and qPCR data at pre-neuronal stages.

(A) In situ hybridization with Sox2 and immunochemistry with En1 to indicate the regions of interest excised from early embryos. These regions comprise the anterior neural plate (anp), forebrain (Fb), midbrain (Mb), hindbrains (Hb) and Hensen’s node (Hn), a well as subregions of the hindbrain ro/r1 and r2 to r6 at stage 11+. (B–D) RT-PCR using chick specific primers for CB1 (184 pb) and GAPDH (579 bp) for the areas shown in (A), at stages 3+ to 4+ (B), 5+ to 8− (C) and 11+ (D). CB1 transcripts can be seen at all stages under study and all areas investigated. (E) Comparison between expression of CB1 in the forebrain progenitor region at stages 3−, 3, 4, 6, 7−, 8 and 11 to that of stage 10 (black arrow) using qPCR: there are no significant differences between the levels of expression of CB1 mRNA at the stages investigated and stage 10, except for a significant increase observed at stage 8 (*p < .05).
We also compared relative levels of CB1 mRNA in different presumptive forebrain territories during gastrulation and neurulation (stages 3 to 11) by qPCR. There were no significant differences in relative amounts of CB1 transcript between stages 3− to 10, except for stage 8, which shows a 1.53 fold increase compared to stage 10 (p <.05; Figure 3E). This suggests that CB1 mRNA transcripts are already present in the anterior neural plate of young embryos (stage 3− to 8), at levels comparable (or higher, in the case of stage 8) to those levels found in the forebrain primordium of stage 10 embryos. Finally, we used RT-PCR in chick embryos to analyze the expression of CB1 mRNA in Hensen’s node from embryos at stages ranging from 3+ to 8−, using the same fate maps as described above, as well as the fate maps from Psychoyos and Stern (1996a): We selected Hensen’s node, because although it contributes to the neural tube (future spinal cord), it does not contain precursors for the forebrain, midbrain and hindbrain (Psychoyos and Stern, 1996a); Instead it acts as a neural inducer population, i.e. it induces the overlying ectoderm to adopt a neural fate (Waddington 1934, 1936; Psychoyos and Stern, 1996b; Stern, 2005). The RT-PCR data shows that CB1 mRNA is present at all stages under study in Hensen’s node (Figure 3B–D). Together, these studies demonstrate that CB1 mRNA is already present in brain precursors of young embryos, prior to neuronal development, as well as in Hensen’s node.
3.2.2. Immunochemical studies
Immunohistochemistry with CB1 antibody shows the distribution of CB1 receptor in chick embryos at stages 7 to 11. Intense signal is observed in the anterior neural folds (Figure 4A, B) and the brain primordium (Figure 4C, D). Individually CB1 labeled cells can be seen in the somites and neural tube of stage 12 embryos (Figure 4E) and in Hensen’s node of stage 7− to 8 embryo (Figure 4F–H). Western blots with CB1 antibody we observe one intense band of ~ 60 kDa corresponding to CB1 antigen, with two isoforms at stage 4 (whole embryo), and single bands in the brains of stage 10 and stage 17 embryos (Figure 4I). To summarize, our results using CB1 antibody reveal the presence of CB1 protein at gastrulation (stage 4), neurulation (stages 8) and during formation of the brain primordium vesicles (stage 11).
Figure 4. Immunological and binding studies with CB1.
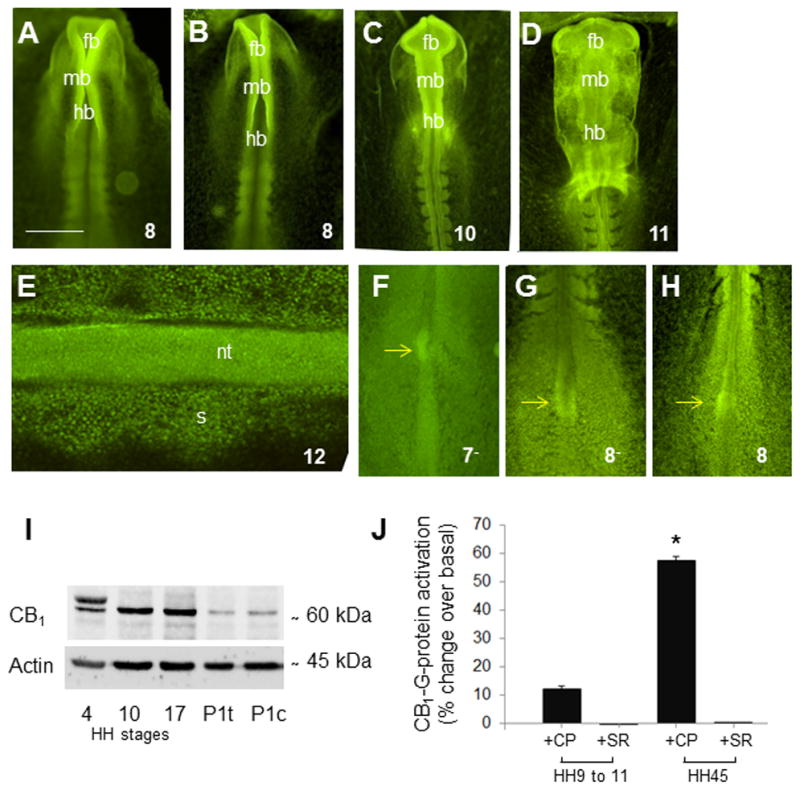
(A–H) Immunohistochemistry with CB1 antibody in chick embryos. Immunolocalization of CB1 protein in stage 8 to 12 embryos shows homogeneous distribution of CB1 antibody, with intense localization in (A–C) the anterior neural folds (stages 8 to 10), (D) the brain primordia (stage 11), and (E) the neural tube and adjacent somites (stage 12). Individual CB1 positive cells can be seen in the neural tube and somites of stage 12 embryos (E). (G) Western blot analysis with CB1 and actin antibodies in chick embryos reveals an intense immunoreactivity band of ~60 kDa corresponding to CB1 antigen. Analysis was performed at stage 4 using whole embryo extract, at stages 10 and 17 using brain tissue, and in post hatched day 1 chicks using tectum (P1t) and cerebellum (P1c). (J) Binding studies with Cb1 in chick: CP-55,940-stimulated [35S]GTPγS binding in membranes derived from stage 9–11 and stage 45 chick embryonic brain. A 12% increase in G-protein activation over basal levels is found in the brain primordia of stage 9 to 11 embryos. This effect is completely reversed following the addition of a CB1 antagonist. Similarly, at stage 45 embryos, a 57% increase in G-protein activation is reversed following the addition of SR141716A. Data presented as mean± SEM. *Indicates a statistical difference (p < .05) from all other groups. Scale bar, A–D, F–H, 600 μm, E, 150μm. CP, CP-55,940; fb, forebrain; hb, hindbrain; mb, midbrain; nt, neural tube; s, somite; and SR, SR141716A.
3.2.3. Binding studies
We next addressed whether CB1 is functionally active during early embryonic development. To this end, we performed the CB1 agonist (CP-55,940) stimulated G-protein activation to assess for functional coupling between CB1 and the G-protein in membranes derived from stage 9–11 stage 45 embryos. We found a 12% increase in G-protein activation over basal levels in the brain primordium of stage 9–11 embryos. As positive control, we used the cerebellum of stage 45 embryos, in which we found that there was a 57% increase in G-protein activation over basal levels; this demonstrates that CB1 is indeed functionally active at stage 9–11 (Figure 4J). This effect is completely reversed following pre-treatment of membranes with CB1 selective antagonist/inverse agonist SR141716A at both embryonic stages of development (Figure 4J). Our studies specifically show that CB1 receptor is functionally coupled to G-proteins as early as stage 9 to 11.
3.3. Characterization of other components of the eCB system during neurodevelopment
3.3.1. Studies with DAGL and MAGL
DAGL and MAGL (isoforms DAGLα and DAGLβ) are the two main enzymes responsible for the metabolism of 2-AG (Bisogno et al, 2003; Makara et al, 2005). Our relative qPCR data in chick shows that there are no significant variations in the relative levels of forebrain derived DAGLα and DAGLβ mRNAs between stage 10 and stages 17 and 23 (Figure 5A and 5B). In mouse, we find a slight, albeit significant, steady increase in relative levels of DAGLα during forebrain development, with a 1.37 fold increase by E8.5 compared to E7.5, a 4.57 fold increase by E9.5 (p <.05) and a 7.56 fold increase by stage E10.5 (p <.05; Figure 5C); in contrast, no significant changes in relative levels of DAGLβ mRNAs were observed between E7.5 and stages E8.5, E9.5 and E10.5 (Figure 5D). In chick, levels of expression of MAGL mRNA are shown to slightly increase throughout forebrain development, with a 1.92 fold increase by stage 17 compared to stage 10, and a 2.23 fold increase by 23 (p <.05) (Figure 5E); By contrast, in mouse forebrain, we find changes in relative levels of MAGL during embryo development (E8.5 to E10.5 compared to E7.5; Figure 5F). Analysis of MAGL mRNA levels in the chick embryo prior to the formation of the forebrain primordium (stages 3− to 11) reveals no significant changes in relative levels of the transcript, compared to stage 10, with the exception of stages 4 and 6, which show a 3.74 and 1.85 fold increase respectively relative to stage 10 (p <.05; Figure 5G). To summarize, between stages 10, 17 and 23 in chick, we find comparable levels of DAGLα and DAGLβ, transcripts and progressively increasing levels of MAGL transcript. In mouse, we find comparable levels of DAGLβ and MAGL, and progressively increasing levels of DAGLα transcript. We then analyzed expression of DAGLα and MAGL by RT-PCR. We find expression of DAGLα and MAGL transcripts in all areas under study, i.e. brain progenitors at stage 3+ to 11 and anterior primitive streak/Hensen’s node at stages 3+ to 8− (Figures 6A–C). In Western blots with DAGLα antibody we observe a double band of 90 kDa corresponding to DAGLα antigen in chick tissue (Figure 6D). Immunohistochemistry with DAGLα antibody shows the distribution of DAGLα in chick embryos during gastrulation, with more intense localization in Hensen’s node and in the nodus posterior area below the primitive streak proper at stage 5 (Figure 6E), as well as in the brain primordium, somites and neural tube at stage 9 (Figure 6F). Although the data from immunohistochemistry corroborate majority of qPCR studies, it is important to note that antibodies used in this study might have given some artifactual staining patterns. To summarize, these studies characterize expression of DAGLα, DAGLβ and MAGL mRNA levels at pre-neuronal stages in chick and mouse embryos. In addition, we report the presence of DAGLα protein during gastrulation and neurulation in chick.
Figure 5. DAGL and MAGL transcripts in chick and mouse embryos (qPCR).
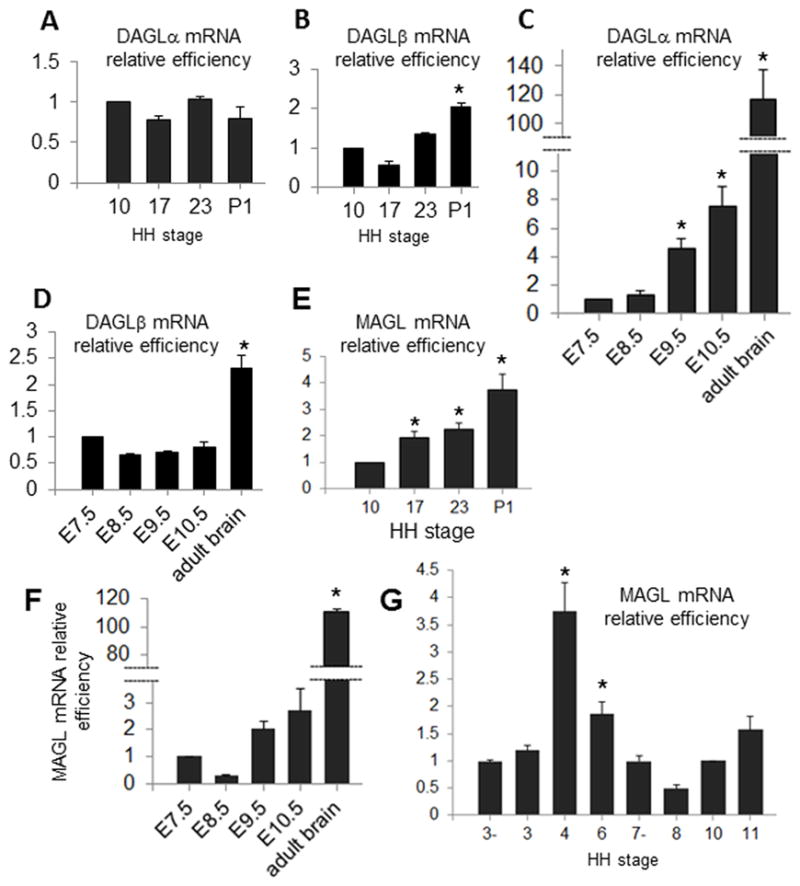
(A, B) Relative quantitation of DAGLα (A) and DAGLβ (B) throughout brain development in chick: Expression of transcripts at stages 17, 23 and P1 is compared to levels at stage 10. There are no changes observed in relative levels of transcript during the early stages of embryo development (stages 10 to 23). (C, D) Relative quantitation of DAGLα (C) and DAGLβ (D) throughout brain development in mouse. Levels of the transcript at E8.5, E9.5, E10.5 and in adult is compared to those at E7.5. Significant changes are found in the relative amounts of DAGLα transcript in mouse during early development (E7.5 to E10.5). By contrast, there are no changes observed in relative levels of DAGLβ transcript for those early stages. (E, F) Relative quantitation of MAGL throughout brain development in chick and mouse: (E) Relative expression of MAGL at stages 17, 23 and P1 is compared to expression at stage 10. (F) Relative levels of MAGL transcript at E8.5, E9.5, E10.5 and adult are compared to those at E7.5. In both chick and mouse, levels of transcript slightly increase throughout development. (G) Relative quantitation of MAGL in forebrain progenitor tissue. Relative expression at stages 3−, 3, 4, 6, 7, 8 and 11 is compared to expression at stage 10. There are no significant changes in relative levels of transcript, with the exception of stages 4− and 6, which show a significant fold increase MAGL mRNA levels. For analysis of A–E *p < .05.
Figure 6. DAGLα and MAGL at pre-neuronal stages: RT-PCR and immunological data.
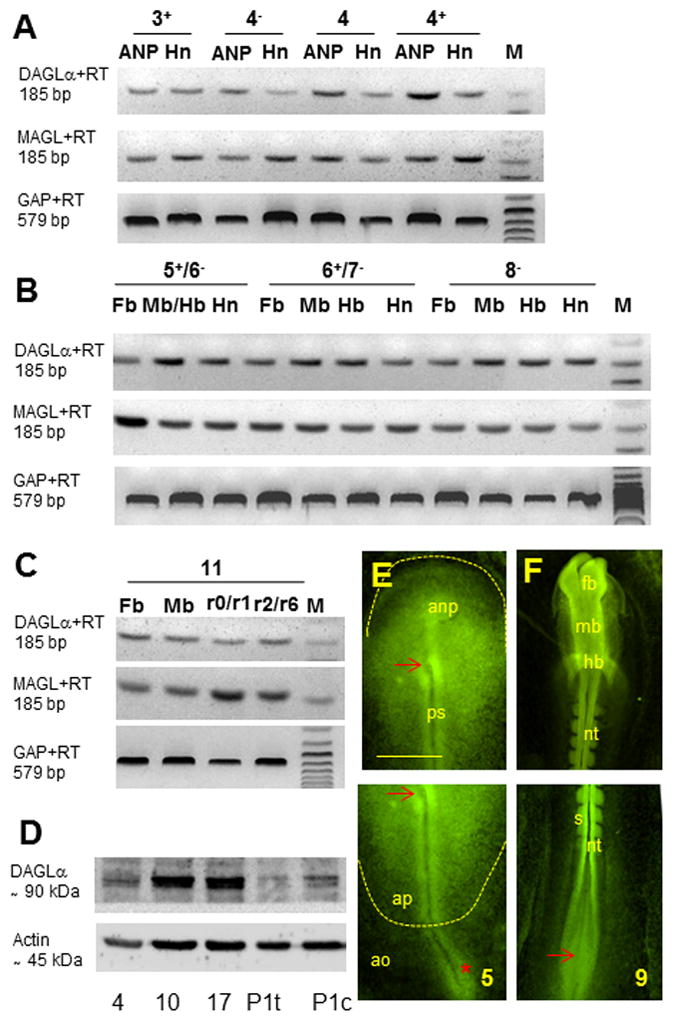
(A–C) RT-PCR using chick specific primers for DAGLα (185 pb), MAGL (185 bp) and GAPDH (579 bp) for the same areas as shown in Figure 3A, at stages 3+ to 4+ (A), 5+ to 8− (B) and 11+ (C). As for CB1, DAGLα and MAGL transcripts can be seen at all stages under study and all areas investigated. (F–H) Immunohistochemistry with DAGLα antibody in chick embryos. (F) Western blot analysis with DAGLα and actin antibodies reveals a double immunoreactivity band of ~90 kDa corresponding to DAGLα antigen. Analysis was performed at stage 4 using whole embryo extract, at stages 10 and 17 using brain tissue, and in post hatched day 1 chicks using tectum (P1t) and cerebellum (P1c). DAGLα antigen is mainly localized in Hensen’s node and in the nodus posterior of stages 5 embryos (E), in the brain primordium, somites, neural tube and Hensen’s node (F) of stage 9 embryos. ao, area opaca; ap, area pellucida; fb, forebrain; mb, midbrain; anp, anterior neural plate; nt, neural tube; ps, primitive streak; s, somite; red arrow, Hensen’s node, red *, nodus posterior. Scale bar, 600 μm.
3.3.2. NAPE-PLD and FAAH expression
NAPE-PLD and FAAH are the enzymes mainly responsible for AEA synthesis and degradation (Cravatt et al 2001; Egertová et al, 2008). We analyzed relative expression levels of NAPE-PLD and FAAH using qPCR in chick and mouse neurodevelopment. We show that as for DAGLβ, there are no significant changes in relative levels of the transcript between stages 10, 17 and 23 in chick, and E7.5 to E10.5 in mouse (Figure 7A, B). Levels of NAPE-PLD transcript are shown to be significantly higher at P1 (chick) and adult brain (mouse) than at the embryonic stages under study. In contrast with CB1, DAGL, MAGL and NAPE-PLD mRNA, levels of expression of FAAH mRNA are shown to fluctuate during forebrain development in chick, with a 6.54 fold increase by stage 17 compared to stage 10 (p <.05), followed by a sharp decrease by stage 23 (0.46 fold; p <.05), and a 4.01 fold increase by P1 (p <.05; Figure 7C). By comparison, in mouse forebrain, we do not find changes in relative levels of FAAH during initial brain development (E8.5 to E10.5 compared to E7.5; Figure 7D). Together, these results indicate that the enzymes responsible for AEA metabolism, are present in both chick and mouse embryos during early neurodevelopment.
Figure 7.
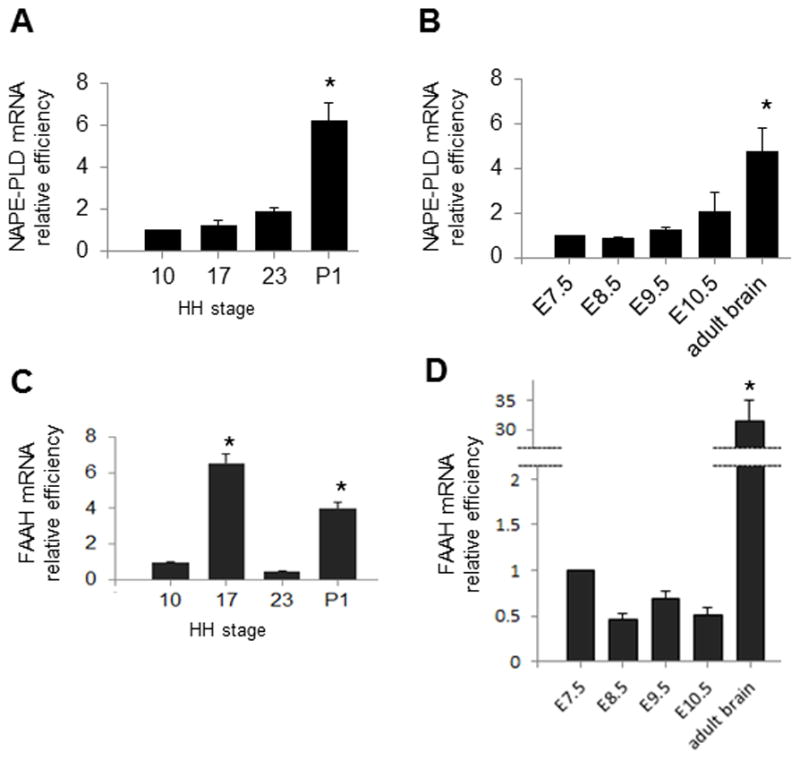
qPCR with NAPE-PLD and FAAH in chick (A, C) and mouse (B, D) embryos during development. In chick, expression of transcript at stages 17, 23 and P1 is compared to expression at stage 10; In mouse, expression of transcript at E8.5, E9.5, E10.5 and adult brain is compared to expression at E7.5. For NAPE-PLD there are no significant changes in relative levels of the transcript during early development in chick (A) or mouse (B). For FAAH, levels of transcript fluctuate in chick, but remain constant in mouse between E7.5 and E10.5 (*p < .05).
4. Discussion
Previous reports have shown that exposure to exocannabinoid and THC analogue O-2545 (Martin et al, 2006) impairs gastrulation and neurulation in chick embryos (Psychoyos et al, 2008), suggesting that O-2545 might interfere with an eCB system present in the embryo at these early, pre-neuronal stages of development. In the studies presented herein, we address the question of whether there are components of the eCB signaling system present in chick embryos at pre-neuronal stages.
4.1. eCBs and brain development
ECBs 2-AG and AEA are the principal ligands for CB1 receptor (reviewed in Pertwee, 2008). To date, eCBs 2-AG and AEA have been identified during two phases of embryonic brain development: at the end of gestation and at E14.5 in mouse (see below). At the end of gestation, levels of eCB 2-AG in the brain approximate 9 ng/g tissue in rat (Berrendero et al, 1999) and 21–44 ng/g tissue in mouse (Keimpema et al 2010; Berrendero et al, 1999). At E14.5 in mouse, Keimpema et al (2010) have quantified 2-AG within the developing brain, with levels of 10 ng/g tissue. Here we have attempted to quantify levels of 2-AG and AEA at the end of gestation in chick and mouse brain. We have detected significant levels of eCBs 2-AG and AEA in both chick and mouse. Our studies on late gestation corroborate the earlier studies of Berrendero et al (1999) and Keimpema et al (2010), and suggest that in both chick and mouse, eCBs are present within the developing brain at the end of gestation.
4.2. eCBs 2-AG and AEA in pre-neuronal development
So far, very little is known on whether an eCB system is present during the initial stages of brain development i.e. during the pre-neuronal phase and during the initial phase of neurogenesis. The earliest stages investigated so far in terms of eCBs and neuronal development are the recent studies of Keimpema et al (2010), which have established that eCB 2-AG is present during neurogenesis and axonal pathfinding in the brain of E14.5 to E18.5 mouse embryo, with 2-AG levels of 10 ng/g tissue. Our studies herein extend these findings by attempting to determine whether 2-AG and AEA are also detectable in the brain primordium prior to E14.5, i.e. prior to the formation of neurons and initiation of pathfinding. Our studies show that both 2-AG and AEA are detectable in chick embryos during stages 9 to 11. These stages correspond to the pre-neuronal phase, i.e. to a phase during which the initial 3 subdivisions of the brain primordium, are just being formed. We do not yet know the significance of eCBs during this pre-neuronal phase. Finally, our findings on 2-AG:AEA ratio during neurodevelopment show that this ratio is comparable to that found in adult brains in which 2-AG is present at levels 170 times greater than AEA (Felder et al, 1996; Stella et al 1997).
Our studies herein have focused exclusively on 2-AG and AEA, which are the classical ligands for the CB1 receptor (Devane et al, 1992; Mechoulam et al, 1994; Sugiura et al, 1995). Yet, we must also note that other eCB substances such as the precursor to AEA (N-arachidonoyl-phosphatidyl ethanolamine; NAPE; Cadas et al, 1997), N-palmitoyl ethanolamine (PEA; Sun et al, 2000) and N-oleoyl ethanolamine (OEA; Martínez de Ubago et al, 2009) may also be present in embryonic neurodevelopment; in our future studies we will attempt to quantify these eCBs during brain development. To summarize, our results herein determine that 2-AG and AEA are present prior to neurogenesis (i.e. prior to development of neurons in the brain), and suggest a de novo, non-synaptic, pre-neuronal function(s) for these eCBs. Such function(s) could potentially include participation in the establishment of a neuronal scaffold, and differentiation and/or apoptosis within the neuroepithelium of the brain primordia. Experiments are currently underway in order to address these possibilities.
4.3. Functional CB1 receptor at neural plate stages and early brain development
Our studies herein determine that there is CB1 mRNA and a functional CB1 receptor in developing chick and mouse embryos, prior to neuronal development. Our data shows that in chick, CB1 mRNA is detectable in all the areas of the embryo that will give rise to the brain primordium, from stages 3− (gastrulation) to 11+. These findings are in accordance with recent zebrafish studies, in which CB1 mRNA is detected from the 3-somite stage (equivalent to stage 8 in chick) onwards in the zebrafish embryo (Migliarini et al 2009). Our results with CB1 antibody reveal the presence of CB1 protein at gastrulation (stage 4), neurulation (stage 10) and neuronal development (stages 17, 23 and P1). Thus, our immunochemical studies on CB1 protein corroborate our qPCR and RT-PCR findings as well as our preliminary data (Psychoyos et al, 2009). In addition, our present immunochemical studies on CB1 are consistent with recent findings in zebrafish, which describe the presence of CB1 receptor at hatching (Migliarini et al 2009). The finding of CB1 receptor during gastrulation is of particular interest because it is during this developmental stage that formation of the neural plate, an epithelial sheet which will give rise to the neuroepithelium of the brain (Figure 3C herein; Wittler and Kessel, 2004), will take place through neural induction. Here again, it would be interesting to know whether CB1 receptor participates in this process. Finally, our binding studies demonstrate that CB1 receptor is functionally coupled to G-proteins during early embryonic development (stage 9 to 11). This result complements our present findings on the presence of eCBs 2-AG and AEA in the brain progenitors of these embryos. Although we have herewith attempted to focus on CB1 receptor, it would be interesting to know whether additional components of the eCB system, such as CB1 receptor-interacting protein 1 (Cnrip1; Howlett et al 2010, Smith et al, 2010), are also present in early embryo development.
4.4. Enzymes responsible for 2-AG and AEA metabolism during neural plate stages and early brain development
Our studies examined whether the enzymes responsible for 2-AG and AEA are present in the embryo at the transcriptional level. Our qPCR and RT-PCR data shows that this is indeed the case: In chick, between stages 10, 17 and 23, we find comparable levels of DAGLα, DAGLβ, NAPE-PLD transcripts, progressively increasing levels of MAGL transcript, and fluctuating levels of FAAH mRNA. In mouse, we find comparable levels of DAGLβ, MAGL, NAPE-PLD, and FAAH, as well as progressively increasing levels of DAGLα transcript (Figures 5 and 7). In addition, our RT-PCR data shows that DAGLα and MAGL are present in the chick embryo in brain progenitors as early as gastrulation stages (Figure 6). We do not know so far, the significance of these enzymes in early development. The activities of enzymes responsible for the metabolism of eCBs need to be examined to further ascertain the present findings. However, the finding that these enzymes are present in early embryo development corroborates the finding that eCBs are also present in early embryo development (section 4.1) and suggests a possible de novo function for these eCBs in early development. Also to mention that there are other major enzymes involved in the metabolism of eCBs, including hydrolase α/β-hydrolase domain-containing enzymes (Mulder et al, 2011), which might also be present in early development. Further studies are warranted to determine whether this is the case, and if so, which function these enzymes might have in early development.
2.11. Conclusions
Together, these results show that components of the eCB system, including ligands 2-AG and AEA, CB1 receptor and metabolizing enzymes DAGL, NAPE-PLD, MAGL and FAAH, are present in the very early chick embryos, and suggest that the functionally active CB1 receptor-mediated signaling might play a critical role in the early stages of neurogenesis. These findings along with the previously reported studies lay the foundation for further work, which would assist in identifying a molecular mechanism of how the components of the eCB system affect early embryogenesis when they are disrupted. Finally, the stage at which the eCB system is presently detected correspond to human dpc 22 to 26, a period during which some women are still unaware of their pregnancy, and thus of the potentially harmful effects of exocannabinoids. Thus, the presence of the eCB system during early stages of development, suggest that there may be developmental consequences of marijuana and other drugs of abuse during this period.
Acknowledgments
This research was supported by Ruth L. Kirschstein National Research Service Award from the National Institute on Drug Abuse 1F32 DA021977 (D.P.), and NIH grants R21DA020531 (K.Y.V.), AA015525 (B.H.), and DC011121 (R.L.H.). The authors are grateful to T.M. Jessell, R. Lovell-Badge, D. Wilkinson and the Developmental Studies Hybridoma Bank for gifts of CB1, En1 and Sox2.
Footnotes
Conflict of Interest Statement: The authors declare there are no conflicts of interest.
References
- Aguado T, Monory K, Palazuelos J, Stella N, Cravatt B, Lutz B, et al. The endocannabinoid system drives neural progenitor proliferation. FASEB J. 2005;19:1704–6. doi: 10.1096/fj.05-3995fje. [DOI] [PubMed] [Google Scholar]
- Anavi-Goffer S, Mulder J. The polarised life of the endocannabinoid system in CNS development. Chembiochem. 2009;10:1591–8. doi: 10.1002/cbic.200800827. [DOI] [PubMed] [Google Scholar]
- Applied Biosystems. Creating Standard Curves with Genomic DNA or Plasmid DNA Templates for Use in Quantitative PCR. Applied Biosystems. 2003 http://www6.appliedbiosystems.com/support/tutorials/pdf/quant_pcr.pdf.
- Balinsky BI. An introduction to embryology. New York: Saunders; 1975. [Google Scholar]
- Berghuis P, Dobszay MB, Wang X, Spano S, Ledda F, Sousa KM, et al. Endocannabinoids regulate interneuron migration and morphogenesis by transactivating the TrkB receptor. Proc Natl Acad Sci USA. 2005;102:19115–20. doi: 10.1073/pnas.0509494102. [DOI] [PMC free article] [PubMed] [Google Scholar]
- Berghuis P, Rajnicek AM, Morozov YM, Ross RA, Mulder J, Urbán GM, et al. Hardwiring the brain: endocannabinoids shape neuronal connectivity. Science. 2007;316:1212–6. doi: 10.1126/science.1137406. [DOI] [PubMed] [Google Scholar]
- Berrendero F, Sepe N, Ramos JA, Di Marzo V, Fernández-Ruiz JJ. Analysis of cannabinoid receptor binding and mRNA expression and endogenous cannabinoid contents in the developing rat brain during late gestation and early postnatal period. Synapse. 1999;33:181–91. doi: 10.1002/(SICI)1098-2396(19990901)33:3<181::AID-SYN3>3.0.CO;2-R. [DOI] [PubMed] [Google Scholar]
- Bisogno T, Howell F, Williams G, Minassi A, Cascio MG, Ligresti A, et al. Cloning of the first sn1-DAG lipases points to the spatial and temporal regulation of endocannabinoid signaling in the brain. J Cell Biol. 2003;163:463–8. doi: 10.1083/jcb.200305129. [DOI] [PMC free article] [PubMed] [Google Scholar]
- Bromberg KD, Ma’ayan A, Neves SR, Iyengar R. Design logic of a cannabinoid receptor signaling network that triggers neurite outgrowth. Science. 2008;320:903–9. doi: 10.1126/science.1152662. [DOI] [PMC free article] [PubMed] [Google Scholar]
- Cadas H, di Tomaso E, Piomelli D. Occurrence and biosynthesis of endogenous cannabinoid precursor, N-arachidonoylphosphatidylethanolamine, in rat brain. J Neurosci J. 1997;17:1226–42. doi: 10.1523/JNEUROSCI.17-04-01226.1997. [DOI] [PMC free article] [PubMed] [Google Scholar]
- Christiansen J, Coles E, Robinson V, Pasini A, Wilkinson DG. Screening from a subtracted embryonic chick hindbrain cDNA library: identification of genes expressed during hindbrain, midbrain and cranial neural crest development. Mech Dev. 2001;102:119–33. doi: 10.1016/s0925-4773(01)00294-5. [DOI] [PubMed] [Google Scholar]
- Cravatt BF, Demarest K, Patricelli MP, Bracey MH, Giang DK, Martin BR, et al. Supersensitivity to anandamide and enhanced endogenous cannabinoid signaling in mice lacking fatty acid amide hydrolase. Proc Natl Acad Sci USA. 2001;98:9371–6. doi: 10.1073/pnas.161191698. [DOI] [PMC free article] [PubMed] [Google Scholar]
- Devane WA, Hanus L, Breuer A, Pertwee RG, Stevenson LA, Griffin G, et al. Isolation and structure of a brain constituent that binds to the cannabinoid receptor. Science. 1992;258:1946–9. doi: 10.1126/science.1470919. [DOI] [PubMed] [Google Scholar]
- Egertová M, Simon GM, Cravatt BF, Elphick MR. Localization of N-acyl phosphatidylethanolamine phospholipase D (NAPE-PLD) expression in mouse brain: A new perspective on N-acylethanolamines as neural signaling molecules. J Comp Neurol. 2008;506:604–15. doi: 10.1002/cne.21568. [DOI] [PubMed] [Google Scholar]
- ElSohly M. Quarterly Report, Potency Monitoring Project, Report 100 [monograph on the internet] NIDA; 2008. [accessed 30/12/2010]. Available in: http://www.whitehousedrugpolicy.gov/pdf/FullPotencyReports.pdf. [Google Scholar]
- Eyal-Giladi H, Kochav S. From cleavage to primitive streak formation: a complementary normal table and a new look at the first stages of the development of the chick. I. General morphology. Dev Biol. 1976;49:321–37. doi: 10.1016/0012-1606(76)90178-0. [DOI] [PubMed] [Google Scholar]
- Felder CC, Nielsen A, Briley EM, Palkovits M, Priller J, Axelrod J, et al. Isolation and measurement of the endogenous cannabinoid receptor agonist, anandamide, in brain and peripheral tissues of human and rat. FEBS Lett. 1996;393:231–5. doi: 10.1016/0014-5793(96)00891-5. [DOI] [PubMed] [Google Scholar]
- Fernández-Ruiz JJ, Berrendero F, Hernández ML, Romero J, Ramos JA. Role of endocannabinoids in brain development. Life Sci. 1999;65:725–36. doi: 10.1016/s0024-3205(99)00295-7. [DOI] [PubMed] [Google Scholar]
- Fride E, Gobshtis N, Dahan H, Weller A, Giuffrida A, Ben-Shabat S. The endocannabinoid system during development: emphasis on perinatal events and delayed effects. Vitam Horm. 2009;81:139–58. doi: 10.1016/S0083-6729(09)81006-6. [DOI] [PubMed] [Google Scholar]
- Galve-Roperh I, Palazuelos J, Aguado T, Guzmán M. The endocannabinoid system and the regulation of neural development: potential implications in psychiatric disorders. Eur Arch Psychiatry Clin Neurosci. 2009;259:371–82. doi: 10.1007/s00406-009-0028-y. [DOI] [PubMed] [Google Scholar]
- Hamburger V, Hamilton HL. A series of normal stages in the development of chick embryo. J Morphol. 1951;88:49–92. [PubMed] [Google Scholar]
- Harkany T, Keimpema E, Barabás K, Mulder J. Endocannabinoid functions controlling neuronal specification during brain development. Mol Cell Endocrinol. 2008;286:S84–90. doi: 10.1016/j.mce.2008.02.011. [DOI] [PubMed] [Google Scholar]
- Harkany T, Guzmán M, Galve-Roperh I, Berghuis P, Devi LA, Mackie K. The emerging functions of endocannabinoid signaling during CNS development. Trends Pharmacol Sci. 2007;28:83–92. doi: 10.1016/j.tips.2006.12.004. [DOI] [PubMed] [Google Scholar]
- Howlett AC, Blume LC, Dalton GD. CB(1) cannabinoid receptors and their associated proteins. Curr Med Chem. 2010;17:1382–93. doi: 10.2174/092986710790980023. [DOI] [PMC free article] [PubMed] [Google Scholar]
- Keegan J, Parva M, Finnegan M, Gerson A, Belden M. Addiction in pregnancy. J Addict Dis. 2010;29:175–91. doi: 10.1080/10550881003684723. [DOI] [PubMed] [Google Scholar]
- Keimpema E, Barabas K, Morozov YM, Tortoriello G, Torii M, Cameron G, et al. Differential subcellular recruitment of monoacylglycerol lipase generates spatial specificity of 2-arachidonoyl glycerol signaling during axonal pathfinding. J Neurosci. 2010;30:13992–4007. doi: 10.1523/JNEUROSCI.2126-10.2010. [DOI] [PMC free article] [PubMed] [Google Scholar]
- Makara JK, Mor M, Fegley D, Szabó SI, Kathuria S, Astarita G, et al. Selective inhibition of 2-AG hydrolysis enhances endocannabinoid signaling in hippocampus. Nat Neurosci. 2005;8:1139–41. doi: 10.1038/nn1521. [DOI] [PubMed] [Google Scholar]
- Martin BR, Wiley JL, Beletskaya I, Sim-Selley LJ, Smith FL, Dewey WL, et al. Pharmacological characterization of novel water-soluble cannabinoids. Pharmacol Exp Ther. 2006;318:1230–9. doi: 10.1124/jpet.106.104109. [DOI] [PubMed] [Google Scholar]
- Martínez de Ubago M, García-Oya I, Pérez-Pérez A, Canfrán-Duque A, Quintana-Portillo R, Rodríguez de Fonseca F, et al. Oleoylethanolamide, a natural ligand for PPAR-alpha, inhibits insulin receptor signalling in HTC rat hepatoma cells. Biochim Biophys Acta. 2009;1791:740–5. doi: 10.1016/j.bbalip.2009.03.014. [DOI] [PubMed] [Google Scholar]
- Mechoulam R, Hanus L, Martin BR. Search for endogenous ligands of the cannabinoid receptor. Biochem Pharmacol. 1994;48:1537–44. doi: 10.1016/0006-2952(94)90197-x. [DOI] [PubMed] [Google Scholar]
- Migliarini B, Carnevali O. A novel role for the endocannabinoid system during zebrafish development. Mol Cell Endocrinol. 2009;299:172–7. doi: 10.1016/j.mce.2008.11.014. [DOI] [PubMed] [Google Scholar]
- Mulder J, Aguado T, Keimpema E, Barabás K, Ballester Rosado CJ, et al. Endocannabinoid signaling controls pyramidal cell specification and long-range axon patterning. Proc Natl Acad Sci USA. 2008;105:8760–5. doi: 10.1073/pnas.0803545105. [DOI] [PMC free article] [PubMed] [Google Scholar]
- Mulder J, Zilberter M, Pasquaré SJ, Alpár A, Schulte G, Ferreira SG, et al. Molecular reorganization of endocannabinoid signalling in Alzheimer’s disease. Brain. 2011;134:1041–60. doi: 10.1093/brain/awr046. [DOI] [PMC free article] [PubMed] [Google Scholar]
- Nagy A, Gertsenstein M, Vintersten K, Behringer R. Manipulating the mouse embryo: A laboratory manual third edition. Cold Spring Harbor Laboratory: Cold Spring Harbor Laboratory Press; 2003. pp. 31–140. [Google Scholar]
- Newgreen DF, Howard MJ, Nishi R. Encyclopedia of Neuroscience. 2009. Autonomic Nervous System Development; pp. 837–848. [Google Scholar]
- Paria BC, Dey SK. Ligand-receptor signaling with endocannabinoids in preimplantation embryo development and implantation. Chem Phys Lipids. 2000;108:211–20. doi: 10.1016/s0009-3084(00)00197-3. [DOI] [PubMed] [Google Scholar]
- Paria BC, Song H, Wang X, Schmid PC, Krebsbach RJ, Schmid HH, et al. Dysregulated cannabinoid signaling disrupts uterine receptivity for embryo implantation. J Biol Chem. 2001;276:20523–8. doi: 10.1074/jbc.M100679200. [DOI] [PubMed] [Google Scholar]
- Pertwee RG. Ligands that target cannabinoid receptors in the brain: from THC to anandamide and beyond. Addict Biol. 2008;13:147–59. doi: 10.1111/j.1369-1600.2008.00108.x. [DOI] [PubMed] [Google Scholar]
- Psychoyos D, Stern CD. Fates and migratory routes of primitive streak cells in the chick embryo. Development. 1996a;122:1523–34. doi: 10.1242/dev.122.5.1523. [DOI] [PubMed] [Google Scholar]
- Psychoyos D, Stern CD. Restoration of the organizer after radical ablation of Hensen’s node and the anterior primitive streak in the chick embryo. Development. 1996b;122:3263–73. doi: 10.1242/dev.122.10.3263. [DOI] [PubMed] [Google Scholar]
- Psychoyos D, Hungund B, Cooper T, Finnell RH. A cannabinoid analogue of Delta9-tetrahydrocannabinol disrupts neural development in chick. Birth Defects Res B Dev Reprod Toxicol. 2008;83:477–88. doi: 10.1002/bdrb.20166. [DOI] [PubMed] [Google Scholar]
- Psychoyos D, Finnell R. Double whole mount in situ hybridization of early chick embryos. J Vis Exp. 2008;20 doi: 10.3791/904. pii: 904. [DOI] [PMC free article] [PubMed] [Google Scholar]
- Psychoyos D, Hungund B, Finnell RH. Endocannabinoid signaling in early neurodevelopment: Effect of gestational Δ9-THC exposure. The Open Neuropsychopharmacol Journal. 2009;2:64–76. [Google Scholar]
- Psychoyos D, Finnell R. Method for whole mount antibody staining in chick. J Vis Exp. 2009;24 doi: 10.3791/956. pii: 956. [DOI] [PMC free article] [PubMed] [Google Scholar]
- Rosenquist GC. An autoradiographic study of labelled grafts in the chick blastoderm. Development from primitive streak stages to stage 12. Contrib Embryol Carnegie Inst Wash. 1966;38:71–110. [Google Scholar]
- Shea K, Geijsen N. Dissection of 6.5 dpc Mouse Embryos. JoVE 2. 2007 doi: 10.3791/160. http://www.jove.com/index/details.stp?id=160. [DOI] [PMC free article] [PubMed]
- Smith TH, Sim-Selley LJ, Selley DE. Cannabinoid CB1 receptor-interacting proteins: novel targets for central nervous system drug discovery? Br J Pharmacol. 2010;160:454–66. doi: 10.1111/j.1476-5381.2010.00777.x. [DOI] [PMC free article] [PubMed] [Google Scholar]
- Spratt NT. Localization of the prospective neural plate in the early chick blastoderm. J Exp Zool. 1952;120:109–30. [Google Scholar]
- Stella N, Schweitzer P, Piomelli D. A second endogenous cannabinoid that modulates long-term potentiation. Nature. 1997;388:773–8. doi: 10.1038/42015. [DOI] [PubMed] [Google Scholar]
- Stern CD. Neural induction: old problem, new findings, yet more questions. Development. 2005;132:2007–21. doi: 10.1242/dev.01794. [DOI] [PubMed] [Google Scholar]
- Substance Abuse and Mental Health Service Administration. Results from the 2001 National Household Survey on Drug Abuse NHSDA Series H-17. Rockville, MD: DHHS Publication No. SMA 02–3758; 2002. [Google Scholar]
- Sugiura T, Kondo S, Sukagawa A, Nakane S, Shinoda A, Itoh K, et al. 2-Arachidonoylglycerol: a possible endogenous cannabinoid receptor ligand in brain. Biochem Biophys Res Commun. 1995;215:89–97. doi: 10.1006/bbrc.1995.2437. [DOI] [PubMed] [Google Scholar]
- Sun YX, Tsuboi K, Okamoto Y, Tonai T, Murakami M, Kudo I, Ueda N. Biosynthesis of anandamide and N-palmitoylethanolamine by sequential actions of phospholipase A2 and lysophospholipase D. Biochem J. 2004;380:749–56. doi: 10.1042/BJ20040031. [DOI] [PMC free article] [PubMed] [Google Scholar]
- Sun X, Dey SK. Aspects of endocannabinoid signaling in peri-implantation biology. Mol Cell Endocrinol. 2008;286:S3–11. doi: 10.1016/j.mce.2008.01.002. [DOI] [PMC free article] [PubMed] [Google Scholar]
- Taléns-Visconti R, Sanchez-Vera I, Kostic J, Perez-Arago MA, Erceg S, Stojkovic M, et al. Neural differentiation from human embryonic stem cells as a tool to study early brain development and the neuroteratogenic effects of ethanol. Stem Cells Dev. 2011;20:327–39. doi: 10.1089/scd.2010.0037. [DOI] [PubMed] [Google Scholar]
- Taylor AH, Amoako AA, Bambang K, Karasu T, Gebeh A, Lam PM, et al. Endocannabinoids and pregnancy. Clin Chim Acta. 2010;411:921–30. doi: 10.1016/j.cca.2010.03.012. [DOI] [PubMed] [Google Scholar]
- Vakaet L. Inductions by the nodus posterior of the primitive streak of birds. C R Seances Soc Biol Fil. 1973;167:1053–55. [PubMed] [Google Scholar]
- van Gelder MM, Reefhuis J, Caton AR, Werler MM, Druschel CM, Roeleveld N National Birth Defects Prevention Study. Maternal periconceptional illicit drug use and the risk of congenital malformations. Epidemiol. 2008;20:60–6. doi: 10.1097/EDE.0b013e31818e5930. [DOI] [PubMed] [Google Scholar]
- Vinod KY, Arango V, Xie S, Kassir SA, Mann JJ, Cooper TB, et al. Elevated levels of endocannabinoids and CB1 receptor-mediated G-protein signaling in the prefrontal cortex of alcoholic suicide victims. Biol Psychiatry. 2005;57:480–6. doi: 10.1016/j.biopsych.2004.11.033. [DOI] [PubMed] [Google Scholar]
- Vitalis T, Lainé J, Simon A, Roland A, Leterrier C, Lenkei Z. The type 1 cannabinoid receptor is highly expressed in embryonic cortical projection neurons and negatively regulates neurite growth in vitro. Eur J Neurosci. 2008;28:1705–18. doi: 10.1111/j.1460-9568.2008.06484.x. [DOI] [PubMed] [Google Scholar]
- Waddington CH. Induction by the primitive streak and its derivatives in the chick. J Exp Biol. 1933;10:38–48. [Google Scholar]
- Waddington CH. Organizers in Mammalian Development. Nature. 1936;138:125. [Google Scholar]
- Wilkinson DG. In situ hybridization: A practical approach. Oxford: IRL Press; 1992. pp. 75–83. [Google Scholar]
- Wittler L, Kessel M. The acquisition of neural fate in the chick. Mech Dev. 2004;121:1031–42. doi: 10.1016/j.mod.2004.05.004. [DOI] [PubMed] [Google Scholar]
- World Health Organization. Epidemiology of Cannabis use [monograph on the internet] Geneva: World Health Organization; 1997. [accessed 30/12/2010]. Cannabis: A Health Perspective and Research Agenda. Available in: http://whqlibdoc.who.int/hq/1997/WHO_MSA_PSA_97.4.pdf. [Google Scholar]