Abstract
The heart is not only our most vital, but also our most complex organ: Precisely controlled by the interplay of electrical and mechanical fields, it consists of four chambers and four valves, which act in concert to regulate its filling, ejection, and overall pump function. While numerous computational models exist to study either the electrical or the mechanical response of its individual chambers, the integrative electro-mechanical response of the whole heart remains poorly understood. Here we present a proof-of-concept simulator for a four-chamber human heart model created from computer topography and magnetic resonance images. We illustrate the governing equations of excitation-contraction coupling and discretize them using a single, unified finite element environment. To illustrate the basic features of our model, we visualize the electrical potential and the mechanical deformation across the human heart throughout its cardiac cycle. To compare our simulation against common metrics of cardiac function, we extract the pressure-volume relationship and show that it agrees well with clinical observations. Our prototype model allows us to explore and understand the key features, physics, and technologies to create an integrative, predictive model of the living human heart. Ultimately, our simulator will open opportunities to probe landscapes of clinical parameters, and guide device design and treatment planning in cardiac diseases such as stenosis, regurgitation, or prolapse of the aortic, pulmonary, tricuspid, or mitral valve.
Keywords: Electro-mechanics, Excitation-contraction, Cardiac mechanics, Finite element analysis, Abaqus
1. Motivation
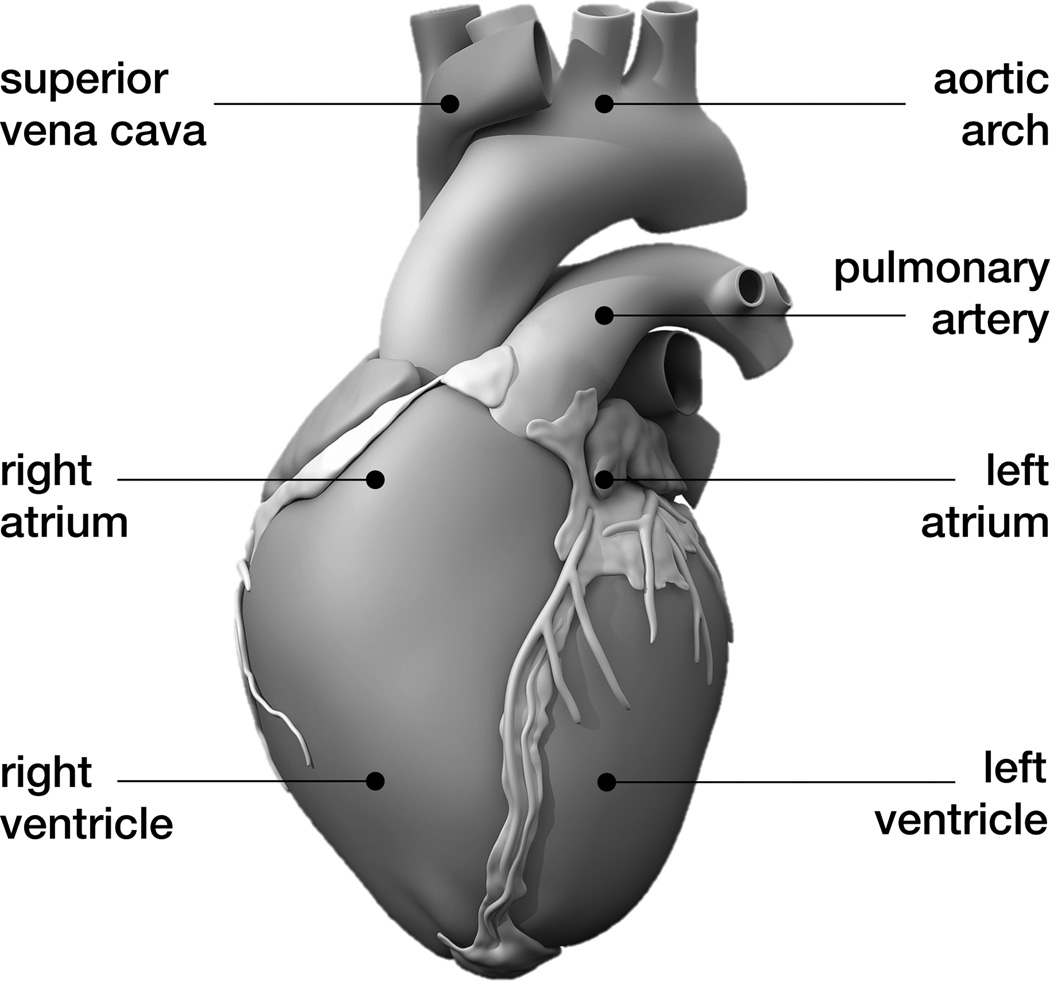
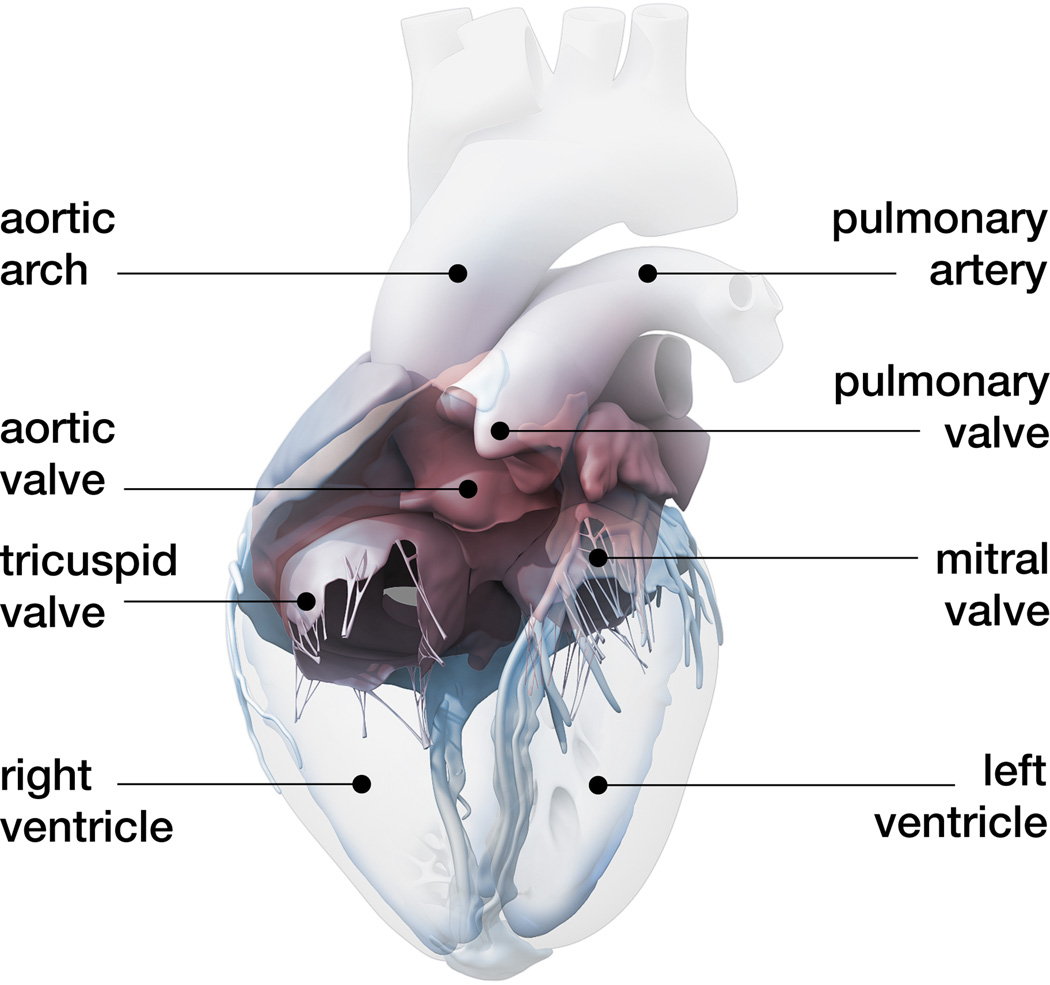
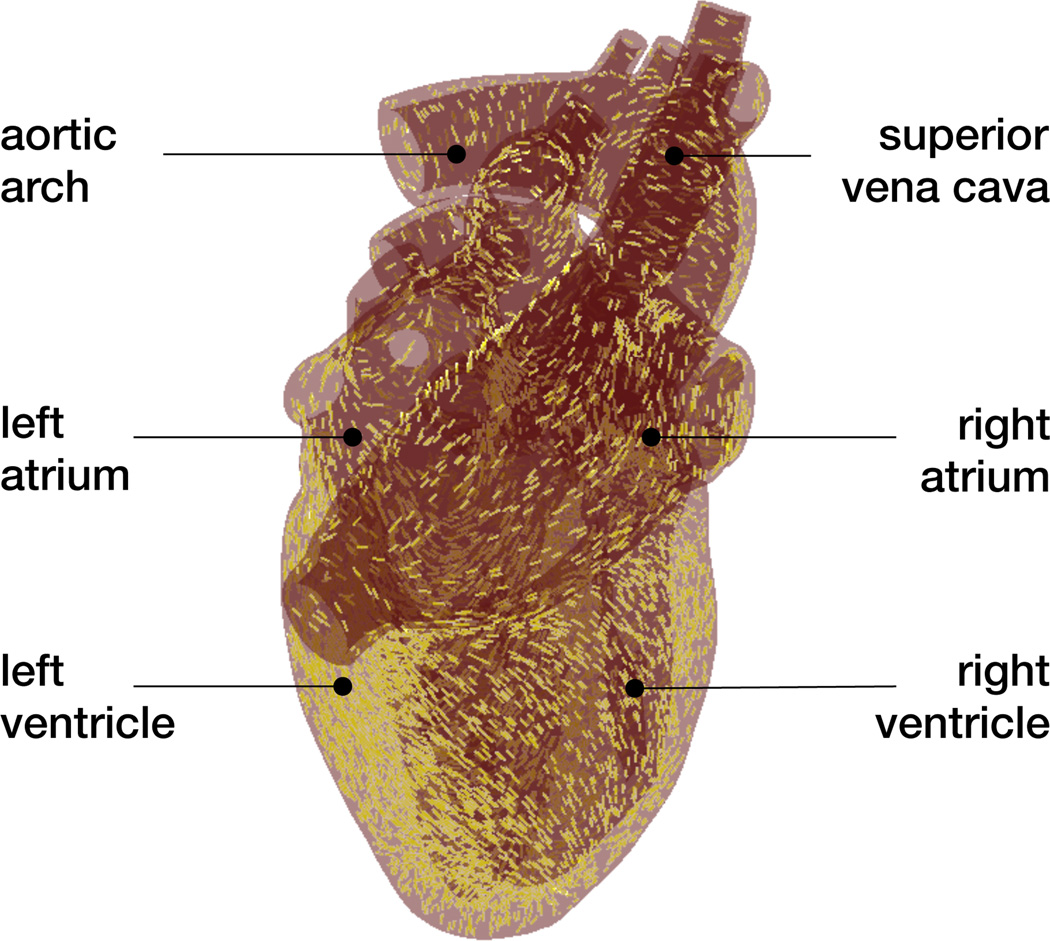
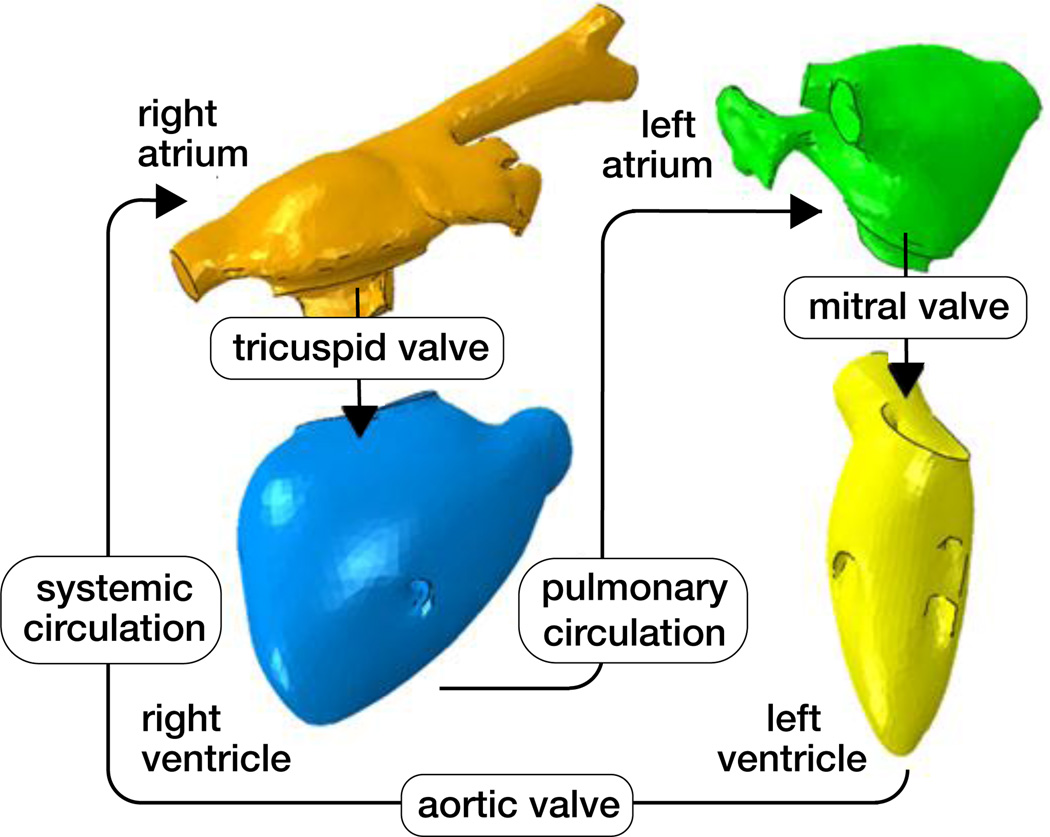
The human heart beats about 100,000 times daily, 30 million times annually, and 2.5 billion times in an average lifetime [5]. Only marginally larger than a fist, it is capable of pumping 7,000 liters of blood per day, 2.5 million per year, and 200 million throughout an individual’s life span [31]. Figure 1 shows an anatomic model of the human heart created from computer tomography and magnetic resonance images [50]. Our heart consists of four chambers, the left and right atria and the left and right ventricles, connected by four valves. Figure 2 illustrates the four valves, the tricuspid and mitral valves, which connect the right and left atria to the right and left ventricles, and the pulmonary and aortic valves, which connect the right and left ventricles to the pulmonary and systemic circulation [50]. The coordinated opening and closing of these valves regulates the filling of the chambers, while the interplay of electrical and mechanical fields controls their proper ejection. Disturbed valvular opening, stenosis, disturbed closing, regurgitation, disturbed electrical signals, arrhythmias, and reduced mechanical function, heart failure, can have devastating physiological consequences [7]. Modeling the interplay between electrical excitation and mechanical contraction provides insight into these complex phenomena and holds the potential to improve treatment for the millions of people affected by cardiac disease [24].
Figure 1.
Anatomic model of the human heart created from computer tomography and magnetic resonance images. The model displays the characteristic anatomic features: The aortic arch, the pulmonary artery, and the superior vena cava; the two upper chambers, the left and right atria; and the two lower chambers, the left and right ventricles; adopted with permission from [50].
Figure 2.
Circulatory model of the human heart created from computer tomography and magnetic resonance images. The model displays the characteristic circulatory features: The tricuspid and mitral valves, which connect the right and left atria to the right and left ventricles; and the pulmonary and aortic valves, which connect the right and left ventricles to the pulmonary and systemic circulation; adopted with permission from [50].
Heart disease is the primary cause of death in the industrialized nations, claiming more than 16 million lives worldwide every year [2]. The origin of the heart disease is often local: Fibrillation and myocardial infarction are classical examples of local electrical and mechanical dysfunction. However, irrespective of its nature and initial location, cardiac disease almost always progresses to affect the entire heart, and eventually impairs the electrical and mechanical function of all four chambers [31]. To understand the fundamental pathologies of different forms of cardiac disease and optimize their treatment options, it is critical to model the entire heart as a whole, rather than studying the diseased subsystem in complete isolation [44].
To date, numerous computational models exist to simulate the behavior of the left ventricle [11, 28, 32, 41], fewer model exist to simulate both the ventricles [4, 26, 29, 45], and only very few models exist to simulate the human heart with all four chambers [20, 44]. Creating whole heart models remains challenging because the atrial wall is about an order of magnitude thinner than the ventricular wall. In addition, the atria are typically entangled and their geometry can be quite complex [20]. This not only complicates image segmentation, but also atrial discretization and meshing. Here we create a finite element model of the whole heart on the basis of existing anatomic and circulatory models illustrated in Figures 1 and 2. This allows us to model all four chambers as electrically excitable, deformable, hyperelastic, electroactive bodies connected via in- and out-flow conditions of viscous resistance type.
The remainder of this manuscript is organized as follows: In Section 2, we summarize the continuum model of electromechanical coupling based on the kinematic equations, the balance equations, and the constitutive equations. In Section 3, we illustrate our computational model, based on the strong and weak forms of the governing equations, their temporal and spatial discretizations, their linearizations, and the handling of their internal variables. In Section 4, we document the creation of our human heart model including the solid model, the finite element model, the muscle fiber model, the fluid model, and a summary of all model parameters. In Section 5 we illustrate the simulation of an entire cardiac cycle. We close with a discussion of the results, the limitations, an outlook, and some conclusions in Section 6.
2. Continuum model
We illustrate the continuum model of electro-mechanical coupling by briefly summarizing the kinematic equations, the balance equations, and the constitutive equations of excitation-contraction coupling.
2.1. Kinematic equations
To characterize the kinematics of finite deformation, we introduce the deformation map φ, which maps particles X from the undeformed reference configuration to particles x = φ (X, t) in the deformed configuration [22]. Its derivative with respect to the undeformed coordinates X defines the deformation gradient,
| (1) |
which we decompose multiplicatively into a volumetric part Fvol and an isochoric part F̄,
| (2) |
with Jacobians Jvol = det(Fvol) = det(F) = J and J̄ = det(F̄) = 1. We can then introduce the isochoric right Cauchy-Green deformation tensor,
| (3) |
and four of its invariants, which result from its projection onto the unit tensor I, and the undeformed myocardial fiber and sheet unit directions f0 and s0,
| (4) |
The invariants Īff and Īss take the interpretation of the isochoric fiber and sheet stretch squared as the squared lengths of the deformed fiber and sheet vectors, f = F̄ · f0 and s = F̄ · s0, and Īfs indicates the fiber-sheet shear. In what follows, we denote the material time derivative as {◦̇} = d{◦}/dt and the material gradient and divergence as ∇{◦} = d{◦}/dX and Div {◦} = d{◦}/dX: I.
2.2. Balance equations
We characterize the electrical problem through the mono-domain version of the FitzHugh-Nagumo equations [12, 35] for the electrical potential ϕ and the mechanical problem through the balance of linear momentum for the deformation φ,
| (5) |
Here, q is the electrical flux, fϕ is the transmembrane current, P is the Piola stress, and fφ is the external mechanical force.
2.3. Constitutive equations
To close the set of equations, we specify the constitutive equations for the electrical flux q, the transmembrane current fϕ, the Piola stress P, and the external mechanical force fφ. We introduce the electrical flux proportional to the gradient of the electrical field,
| (6) |
where D = diso I + dani f0 ⊗ f0 denotes the conductivity tensor, which consists of an isotropic contribution diso and an anisotropic contribution dani to account for faster conductivity along the fiber direction f0 [9]. For the transmembrane current,
| (7) |
we assume a cubic polynomial, c ϕ [ϕ − α][ϕ − 1], which controls the fast upstroke of the action potential through the parameters c and α [12, 35], and of a coupling term, which controls the slow repolarization through the recovery variable r [3]. We treat the recovery variable as internal variable, which evolves according to the following equation,
| (8) |
where the recovery parameters γ, μ1, μ2 and β control the restitution behavior [3]. We assume that the tissue stress consists of passive and active contributions, P = Ppas + Pact, and postulate a Holzapfel-type free energy for the passive tissue stress [23], which we further decompose into volumetric and isochoric contributions, Ppas = Pvol + Piso, such that
| (9) |
ℙ is the isochoric projection tensor [22], and the volumetric, isochoric, and active stresses take the following forms,
| (10) |
Here, κ is the bulk modulus, a, b, aff, bff, ass, bss, afs, bfs are the parameters of the orthotropic Holzapfel model [18, 23], and νff and νss are the weighting factors for active stress generation [40, 47]. The active muscle traction is driven by changes in the electrical potential and obeys the following evolution equation [16],
| (11) |
The parameters kT and ϕr control the maximum active force and the resting potential [36]. The activation function ε = ε0 + [ε∞ − ε0] exp(− exp(−ξ[ϕ − ϕ̄])) ensures a smooth activation of the muscle traction Tact in terms of the limiting values ε0 at ϕ → −∞ and and ε∞ at at ϕ → +∞, the phase shift ϕ̄, and the transition slope ξ [16]. In the following, we assume that we can neglect the effects of external forces, fφ = 0.
3. Computational model
In this section, we illustrate the finite element discretization of the governing equations, demonstrate their consistent linearization, and discuss the handling of their internal variables [6].
3.1. Strong and weak forms
To derive the weak form of the governing equations, we reformulate the electrical and mechanical balance equations (5) in their residual forms and introduce the electrical and mechanical residuals 𝖱ϕ and 𝖱φ throughout the entire cardiac domain ℬ0.
| (12) |
We prescribe Dirichlet boundary conditions ϕ = ϕ̄ and φ = φ̄ on the Dirichlet boundary and Neumann boundary conditions q · N = t̄ϕ and P · N = t̄φ on the Neumann boundary with outward normal N. For simplicity, we assume that all Neumann boundary conditions are homogeneous, t̄ϕ = 0 and t̄φ = 0. We multiply the residuals (12) by the scalar- and vector-valued test functions, δϕ and δφ, integrate them over the domain ℬ0, and integrate the flux terms by parts to obtain the weak forms of the electrical and mechanical problems,
| (13) |
Next, we discretize the weak forms (13) in time and space.
3.2. Temporal and spatial discretizations
To discretize the weak form of the electrical problem (13.1) in time, we partition the time interval of interest 𝒯 into nstep discrete subintervals [tn, tn+1] of length Δt = tn+1 − tn,
| (14) |
and adopt a finite difference discretization in combination with a classical implicit Euler backward scheme to determine the electrical potential ϕ at the current time point tn+1,
| (15) |
To discretize the weak forms of the electrical and mechanical problems (13.1) and (13.2) in space, we partition the domain of interest ℬ0 into nel discrete subdomains ,
| (16) |
and adopt a finite element discretization in combination with a classical Bubnov-Galerkin scheme to discretize the test functions δϕ and δφ and trial functions ϕ and φ in space [16],
| (17) |
Here, N are the standard isoparametric shape functions.
3.3. Residuals and consistent linearization
With the discretizations in time (15) and space (17), we can reformulate the weak forms (13) as the discrete algorithmic residuals of the electrical and mechanical problems,
| (18) |
The operator 𝖠 symbolizes the assembly of all element residuals at the element nodes i and j to the global residuals at the global nodes I and J. To solve for the unknown nodal electrical potential ϕI and mechanical deformation φJ, we could, for example, adapt an incremental interative Newton-Raphson solution strategy based on the consistent linearization of the governing equations,
| (19) |
The solution of this system of equations (19) with the discrete residuals (18) and the iteration matrices,
| (20) |
defines the iterative update of the global vector of electrical and mechanical unknowns ϕI ← ϕI + dϕI and φJ ← φJ + dφJ. It remains to specify the fluxes q and P and sources fϕ and fφ for the residuals (18.1) and (18.2) and their sensitivities with respect to the primary unknowns ϕ and φ for the iteration matrices (20.1) to (20.4) [10, 16].
3.4. Internal variables
To integrate the evolution equations of the recovery variable r and the active muscle traction Tact in time, we treat both as internal variables and update and store them locally on the integration point level [16, 30]. To solve the nonlinear evolution equation (8) for the recovery variable r, we locally adopt a finite difference discretization in combination with a classical implicit Euler backward scheme [15],
| (21) |
and introduce the local residual 𝖱r,
| (22) |
and its algorithmic linearization 𝖪r,
| (23) |
to iteratively update the recovery variable as r ← r − 𝖱r/𝖪r [29]. To solve the linear evolution equation (11) for the active muscle traction Tact, we again adopt a finite difference discretization in time together with an implicit Euler backward scheme,
| (24) |
and solve the resulting equation directly to calculate the active muscle traction at the current point in time,
| (25) |
where the ε = ε0 + [ε∞ − ε0] exp(− exp(−ξ[ϕ − ϕ̄])) [10]. Once we have determined the recovery variable r and the active muscle traction Tact, we calculate the electrical flux q from equation (6), the electrical source fϕ from equation (7), the active stress Pact from equation (10), and the total stress P from equation (9) to evaluate the electrical and mechanical residuals (18). Last, we calculate the sensitivities dϕfϕ [29], dFq = 0, dϕPact = ∂ϕTact [νff f ⊗ f0 + νss s ⊗ s0], and dFP [18] for the electrical and mechanical iteration matrices (20).
4. Human heart model
In this section, we illustrate the creation of a solid model, a finite element model, and a muscle fiber model from the anatomic model in Figure 1 and the creation of a fluid model from the circulatory model in Figure 2. This work was performed as part of the Living Heart Project.
4.1. Solid model
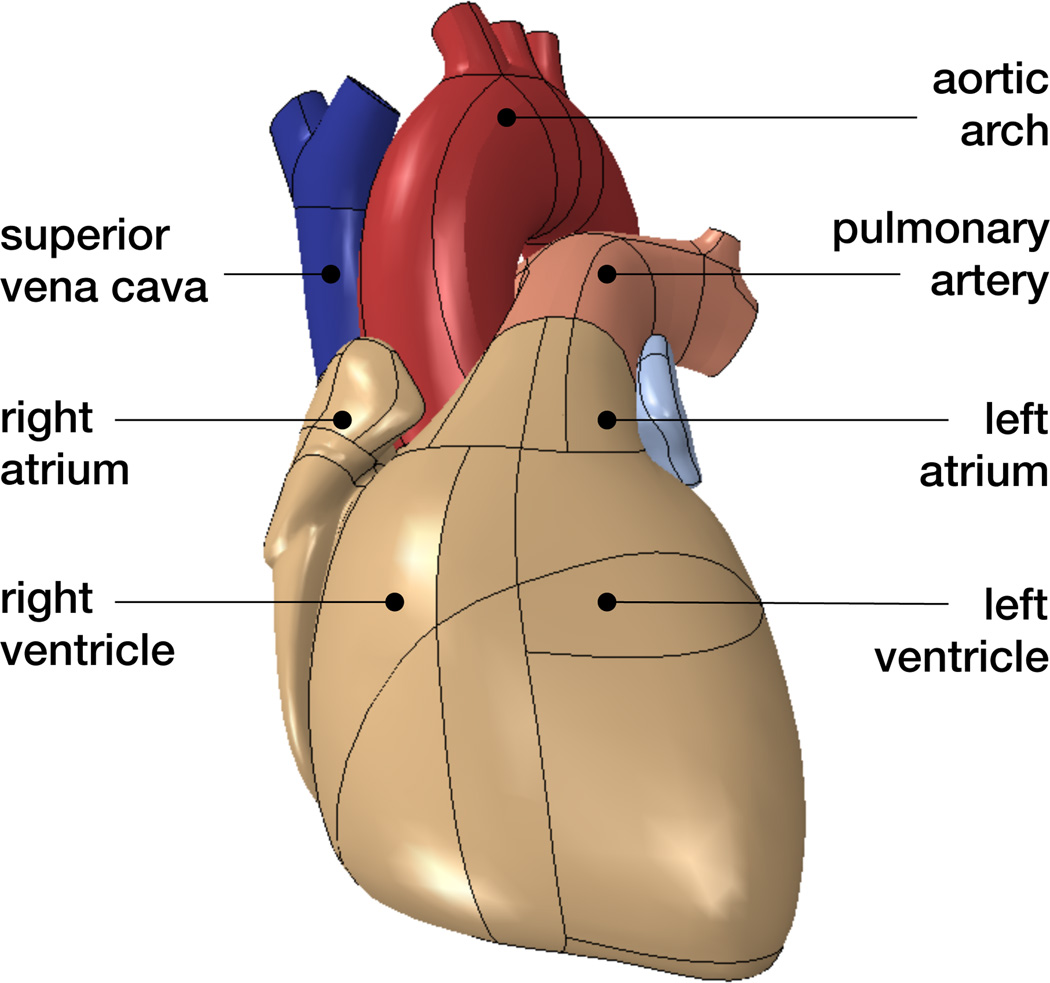
Figure 3 shows the solid model of a human heart with well-defined anatomic details including the aortic arch, the pulmonary artery and superior vena cava, the left and right atria, and the left and right ventricles. We adapt the underlying geometry from the three-dimensional computer-aided design model in Figure 1 [50]. The model accurately defines the key features for our finite element analysis including detailed chamber volumes and wall thicknesses.
Figure 3.
Solid model of the human heart with anatomic details including the aortic arch, pulmonary artery and superior vena cava, left and right atria, and left and right ventricles.
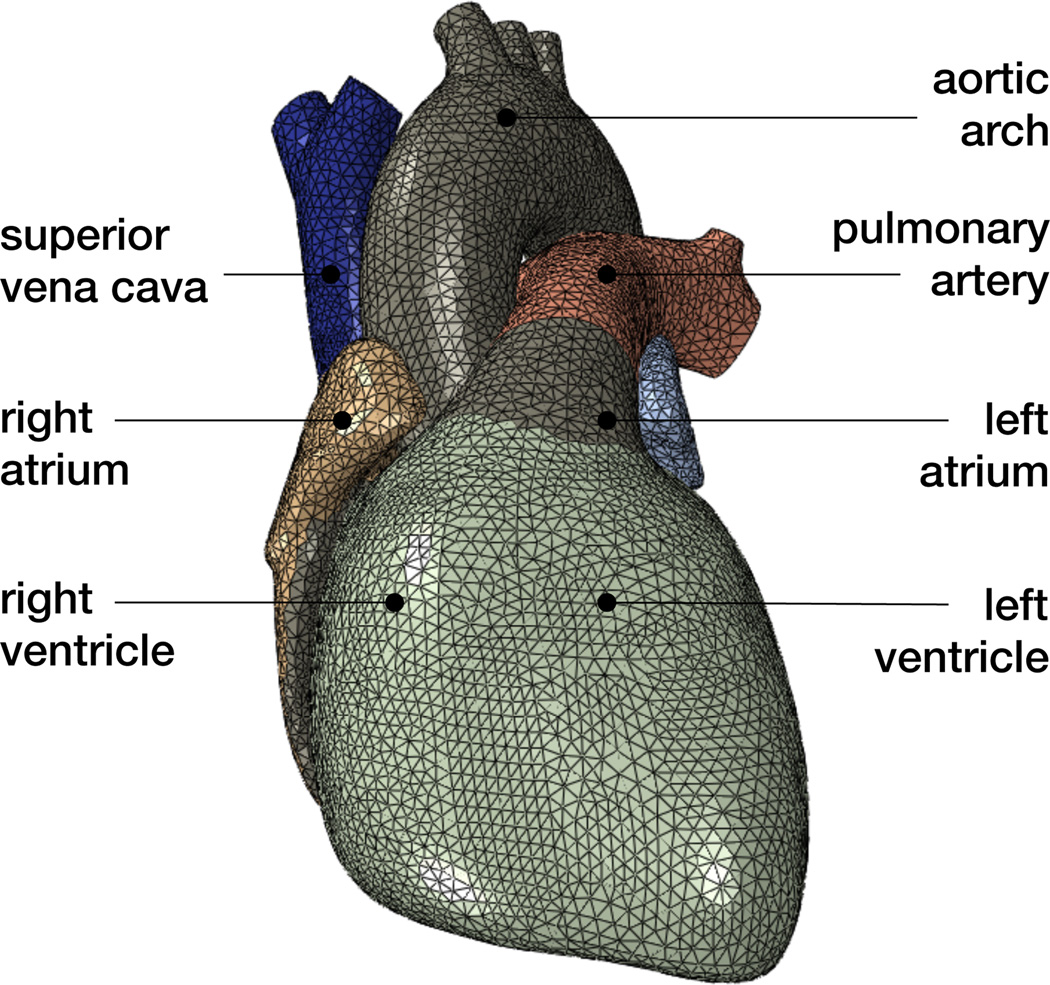
Figure 4 illustrates the finite element model of the heart discretized with 208,561 linear tetrahedral elements and 47,323 nodes. This discretization introduces 47,323 electrical degrees of freedom for the scalar-valued potential ϕ and 141,969 mechanical degrees of freedom for the vector-valued deformation φ resulting in 189,292 degrees of freedom in total.
Figure 4.
Finite element model of the human heart discretized with 208,561 linear tetrahedral elements, 47,323 nodes, and 189,292 degrees of freedom, of which 47,323 are electrical and 141,969 are mechanical.
Figure 5 illustrates the corresponding muscle fiber model with 208,561 discrete fiber and sheet directions f0 and s0. The muscle fibers wrap helically around the heart. At the epicardium, the outer wall, muscle fibers point clockwise-upwards whereas at the endocardium, the inner wall, they point clockwise-downward. We interpolate the fiber and sheet directions from generic fiber orientation illustrations and assign their discrete values to each integration point of the finite element model [49].
Figure 5.
Muscle fiber model of the human heart with 208,561 discrete fiber and sheet directions interpolated and assigned to each integration point.
4.2. Fluid model
Figure 6 illustrates the blood flow model with a surface-based fluid cavity representation of the four chambers, the right atrium, the right ventricle, the left atrium, and the left ventricle [1]. These chambers are connected through five viscous resistance models of Windkessel type [4] representing the tricuspid valve, the pulmonary circulation, the mitral valve, the aortic valve, and the systemic circulation [43]. We adapt the positions of these valves and the corresponding chamber volumes from the detailed circulatory model in Figure 2 [50]. We neglect inertia effects and assume that the flow rate between two neighboring chambers, qc→c+1, is proportional to the pressure difference in the two chambers, pc − pc+1, scaled by the resistance Rc→c+1 [13],
Figure 6.
Blood flow model of the human heart with surface-based fluid cavity representation of the right atrium, right ventricle, left atrium, and left ventricle connected through viscous resistance models of Windkessel type for the tricuspid valve, pulmonary circulation, mitral valve, aortic valve, and systemic circulation.
To represent the four chambers, we create fluid cavities from cubes of unit volume and add the corresponding volume Vc [1] §11.5. We then define the change in chamber volume,
as the difference between influx qc−1→c and outflux qc→c+1 of the corresponding chamber. This simplified approach provides a natural coupling between the structural deformation and the fluid pressure, in which the fluid is represented exclusively in terms of the temporally varying blood pressure in the four chambers. Spatial pressure variations or shear stresses cannot be modeled with this fluid cavity representation.
4.3. Solid and fluid model parameters
Table 1 summarizes the electrical, mechanical, electro-mechanical, and flow parameters of the human heart simulation.
Table 1.
Model parameters of the human heart simulation.
| electrical | |||
| conduction | diso = 2 mm2/ms | dani = 6 mm2/ms | [16] |
| excitation | α = 0.01 | γ = 0.002 | [17] |
| β = 0.15 | c = 8 | [29] | |
| μ1 = 0.2 | μ2 = 0.3 | [3] | |
| mechanical | |||
| passive | κ = 1, 000 kPa | ||
| a = 0.496 kPa | b = 7.209 | [18] | |
| aff = 15:193 kPa | bff = 20.417 | [18] | |
| ass = 3.283 kPa | bss = 11.176 | [18] | |
| afs = 0.662 kPa | bfs = 9.466 | [18] | |
| active | νff = 1.0 | νss = 0.4 | [47] |
| kT = 0.49 kPa/mV | ϕr = −80 mV | [10] | |
| coupling | |||
| activation | ε0 = 0.1/mV | ξ∞ = 0.1/mV | [16] |
| ξ = 1/mV | ϕ̄ = 0 mV | [16] | |
| blood flow | |||
| blood | ρ = 1.025·10−6 kg/mm3 | [42] | |
| valves | Rtv = 0.0010 kPa ms/mm3 | [43] | |
| Rmv = 0.0061 kPa ms/mm3 | [43] | ||
| Rav = 0.0027 kPa ms/mm3 | [43] | ||
| circulation | Rpc = 0.0104 kPa ms/mm3 | ||
| Rsc = 0.0850 kPa ms/mm3 | |||
For the electrical problem, we choose the initial conditions to ϕ = −80mV throughout the entire heart, except for a short excitation phase, during which we locally increase the voltage beyond the excitation threshold in the region of the sinoatrial node located between the right atrium and the superior vena cava. For the mechanical problem, we adopt a combination of different boundary conditions. At the epicardium, the outer wall, we fix the heart in space through connector elements with a moderate elastic stiffness situated at the intersection between the four-chamber heart and its vasculature [1] §31.2, similar to supporting the heart by linear elastic springs [16]. At the endocardium, the inner wall, we control the pressure-volume relation through surface-based fluid cavities [1] §11.5. We choose the initial conditions according to a preload step, during which we pressurize the right atrium and ventricle with 0.266kPa and the left atrium and ventricle with 0.533kPa.
5. Results
To demonstrate the ability of the proposed model to accurately represent the basic features of cardiac excitation and contraction, we simulate the electro-mechanical response of the human heart throughout a representative cardiac cycle.
5.1. Electrical and mechanical fields
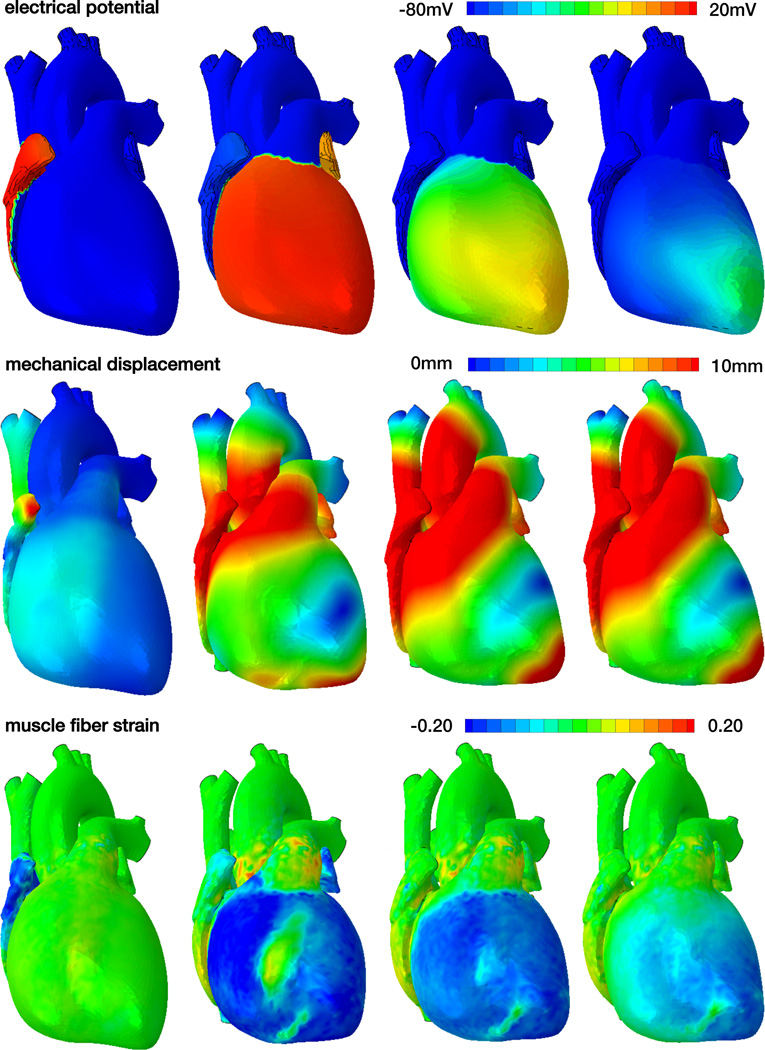
Figure 7 displays the spatio-temporal evolution of the electrical potential, ϕ, the mechanical displacement, u = ‖φ − X‖, and the muscle fiber strain, Eff = E : [f0 ⊗ f0], across the human heart. The displacement u illustrates the magnitude of the displacement vector u as the difference between the current position φ and initial position X. The muscle fiber strain Eff indicates the strain along the muscle fiber direction f0. Initially the heart is at rest and its cells are negatively charged with a potential of ϕ = −80mV, see Figure 7, top row. The heart is excited from the sinoatrial node, a region between the right atrium and the superior vena cava, which is the first region to depolarize with a potential of ϕ = +20mV. The excitation wave spreads rapidly across the atria, arrests briefly at the atrialventricular node, and continues to travel along the septum to rapidly excite the left and right ventricles. After a short period of complete depolarization, repolarization spreads gradually across the left and right ventricles and atria to bring the heart back to its unexcited baseline state.
Figure 7.
Spatio-temporal evolution of electrical potential, mechanical deformation, and muscle fiber strain across the human heart. During systole, the heart depolarizes rapidly from −80mV to +20mV, the muscle fibers contract and shorten up to 20% to induce ventricular ejection. During diastole, the heart repolarizes gradually from +20mV to −80mV, the muscle fibers relax and relengthen to their initial length to induce ventricular filling.
The mechanical deformation clearly follows the electrical signal and spreads from the region that is excited first, the sinoatrial node, across the entire heart, see Figure 7, middle row. Once the heart is fully excited, the electrical potential is homogeneous across the heart; yet the mechanical deformation is not. This clearly indicates the importance of the spatially varying fiber orientation, which causes a local interplay between cellular contraction and secondary effects induced by neighboring heart muscle fibers. As the electrical potential returns to its baseline state, the deformation gradually decays, the heart relaxes, and prepares for the next filling phase.
The muscle fiber strain mimics the effects of the overall deformation, projected onto the local fiber direction, see Figure 7, bottom row. During systole, the muscle fibers contract rapidly and shorted up to 20% to induce ventricular ejection. This moves the apex upward toward the base and induces a twist along the heart’s long axis. During diastole, the muscle fibers gradually relax to allow for ventricular filling and the apex gradually returns to its initial position.
5.2. Electrical potential throughout a cardiac cycle
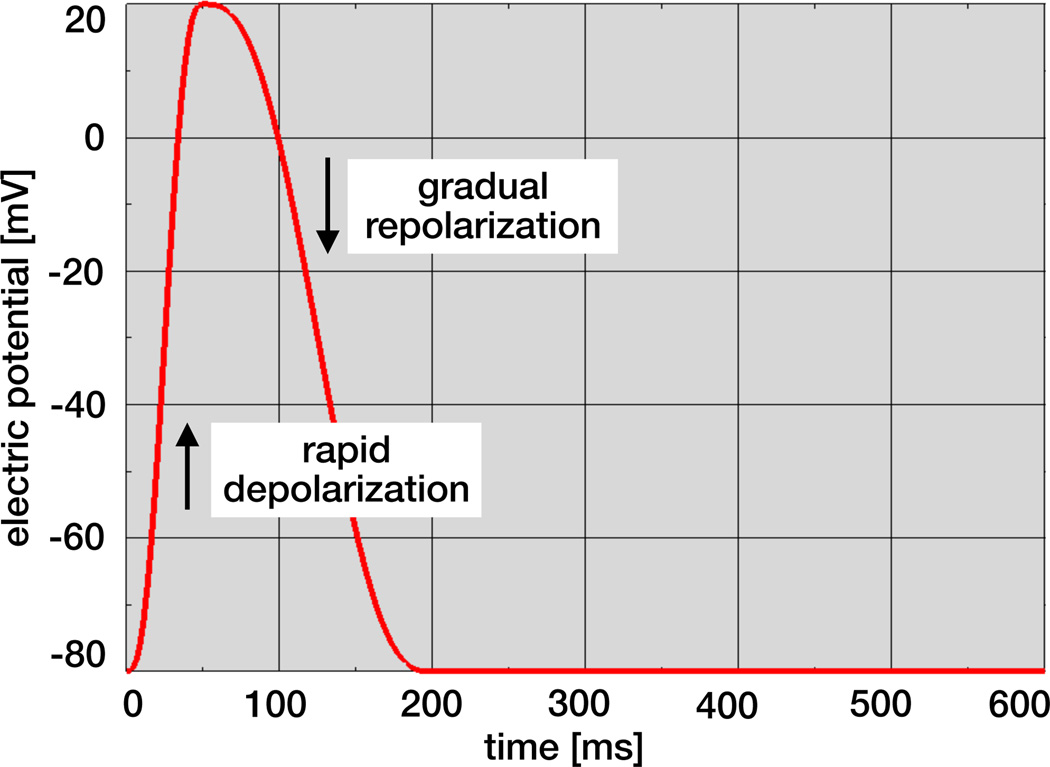
Figure 8 illustrates the local temporal evolution of the electrical potential ϕ for an individual cardiac muscle cell. During excitation, the cell depolarizes rapidly and its electrical potential increases from −80mV to +20mV within the order of milliseconds. This excitation causes the cell to contract. Unlike nerve cells, cardiac cells briefly plateau at the excited state before they begin to relax. During relaxation, cardiac cells gradually repolarize and return to their stable baseline state at −80mV.
Figure 8.
Temporal evolution of electrical potential. During excitation, cardiac cells rapidly depolarize and the electrical potential increases from −80mV to +20mV within the order of milliseconds. During relaxation, cardiac cells gradually repolarize and return to the stable baseline state at −80mV.
5.3. Mechanical deformation throughout a cardiac cycle
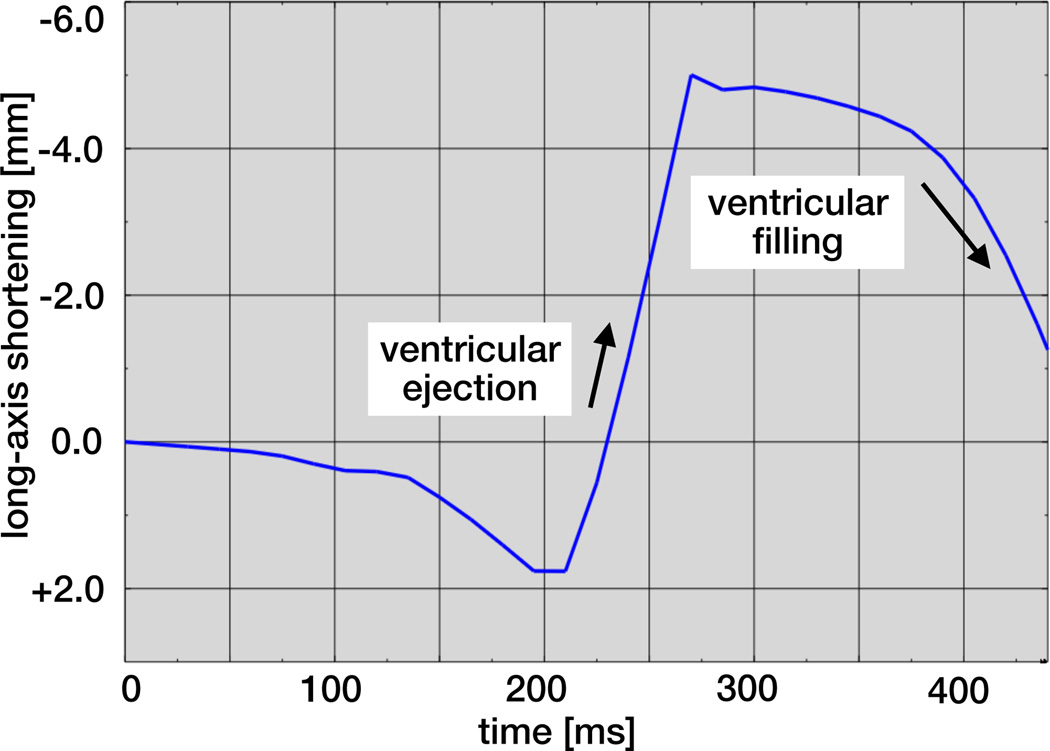
Figure 9 illustrates the dynamics of the heart’s long axis. During ventricular ejection, the distance between apex and base decreases rapidly and the ventricles shorten by approximately 7mm. Shortening plateaus towards end systole to ensure that enough blood is ejected. During ventricular filling, the long axis gradually returns to its initial length as the heart muscle relaxes.
Figure 9.
Temporal evolution of long-axis shortening. During ventricular ejection, the distance between apex and base decreases rapidly as the ventricles shorten by approximately 7mm. During ventricular filling, the long axis gradually returns to its initial length as the heart muscle relaxes.
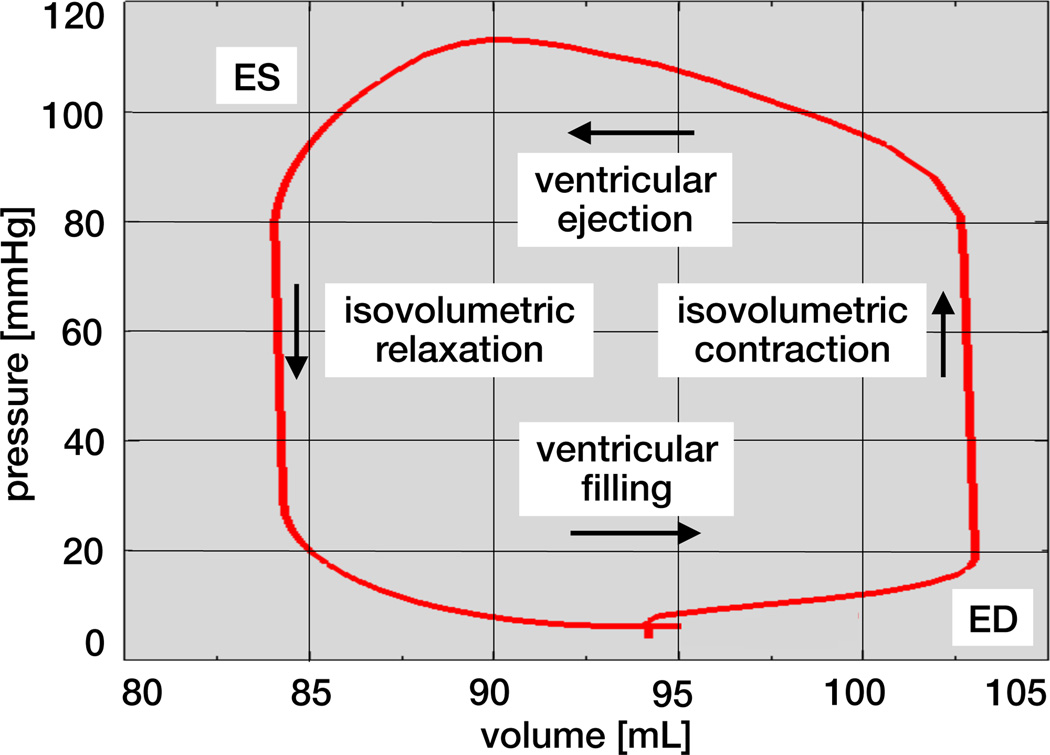
Figure 10 illustrates the pressure-volume loop of the human heart, the temporal evolution of the left ventricular pressure and volume throughout a cardiac cycle. The first phase, ventricular filling, begins with the opening of the mitral valve and continues towards end diastole, the point of maximum volume and minimum pressure in the bottom right corner. The second phase, isovolumetric contraction, is characterized through a steep increase in pressure while the ventricular volume remains unchanged. Once the ventricular pressure exceeds the aortic pressure the aortic valve opens. This is the beginning of the third phase, ventricular ejection, during which the volume of the ventricle decreases, while the pressure still remains high. Ejection continues towards end systole, the point of minimum volume and maximum pressure in the top left corner. The fourth phase, isovolumetric relaxation, begins with closure of the aortic valve followed by a drastic pressure drop. A new cycle starts with the reopening of the mitral valve and the beginning of ventricular filling.
Figure 10.
Pressure-volume loop of the human heart with characteristic phases of ventricular filling, isovolumetric contraction, ventricular ejection, and isovolumetric relaxation. The enclosed area characterizes the work performed throughout the cardiac cycle.
6. Discussion
Modeling the human heart with all four chambers and all four valves is increasingly recognized as a critical step towards reliable, predictive modeling of cardiac function [44]. Although the origin of cardiac disease is often strictly local, the consequences are typically spatially and temporally complex, and almost always affect the entire heart [31]. Until recently, whole heart simulations were virtually impossible because of a lack of sufficient image resolution and computational power. Recent advances in non-invasive imaging and computer simulation now allows us to create fully three-dimensional models of the entire human heart to explore the interplay between electrical and mechanical fields under healthy, diseased, and treatment conditions [20]. With these goals in mind, we have designed a basic prototype model for excitation-contraction coupling in the human heart.
In this proof-of-concept study, we have demonstrated that it is feasible to model whole heart function within a single, unified finite-element based modeling environment. First, we have shown that our whole heart simulation predicts spatio-temporal profiles of the electrical potential, the mechanical deformation, and the muscle fiber strain, which agree nicely with clinical observations and engineering intuition [48]. Throughout the cardiac cycle, the electrical potential varies between −80mV and +20mV, the mechanical deformation takes values in the 10mm regime, and the maximum muscle fiber contraction is in the order of 20%, see Figure 7. Second, we have illustrated how our heart muscle cells locally depolarize rapidly from the resting state at −80mV to the excited state at +20mV and depolarize gradually from +20mV back to −80mV [15], see Figure 8. Last, we have globally extracted metrics of cardiac function, long-axis shortening and pressure-volume loops, see Figures 9 and 10. Our long-axis shortening of approximately 7.0mm agrees nicely with previous simulations of a bi-ventricular human heart model, which predicted a shortening of 7.6mm [48] and with clinical observations [39]. Our pressure-volume loop with left ventricular volumes between 83mL and 103mL and pressures between 5mmHg and 118mmHg lies nicely within the clinically expected range [4, 8]. Our current run time for the electro-mechanical simulation of an entire cardiac cycle is 94 minutes on a standard 16 CPU machine.
6.1. Limitations and future perspectives
Our geometric representation of the human heart is promising and our first simulations are encouraging, both from an engineering and clinical perspective. Yet, our current model has a few limitations, which can be addressed with modular changes and refinements. In particular, our ongoing work aims to implement the following enhancements:
For the electrical module, as a first step, we have assumed that the cellular response is homogeneous across the heart. Recent studies have shown that cellular heterogeneity is critical to accurately represent the electrical activation sequence of the heart: The first regions to depolarize are the last to repolarize [27]. This is true for both regional and transmural activation and can be addressed via different cell types or via a spatially varying refractoriness [25]. In addition, cellular conduction varies hugely between standard cardiac muscle cells and Purkinje fiber cells, which are fast-conducting cells that transmit the electrical signal rapidly from the atrioventricular node to the apex [27]. We can incorporate this fast conduction, which is critical for bottom up excitation, by adding one-dimensional cable elements across the inner wall [29].
For the mechanical module, probably the most significant limitation is the parameter identification, which has been performed on explanted tissue samples. Recent studies have indicated that in vivo properties can be up to four orders of magnitude different from ex vivo properties [38]. Ideally, a series of in vivo experiments should be designed around calibrating these parameters in the beating heart [46]. While the passive properties are relatively easy to access, identifying the active properties can be challenging. Here we have assumed a phenomenological representation of active contraction through equations (10) and (11). Integrating cellular phenomena such as calcium release, actin-myosin sliding, and cross bridging could provide a more mechanistic representation of active force generation [34]. The current trend is to replace active stress with active strain [19, 37], a property that is easier to interpret, easier to bound with physically meaningful values, easier to link to tissue microstructure [41], and easier to measure overall.
For the interaction between the electrical and mechanical fields, we have assumed that coupling is primarily uni-directional: Changes in the electrical field ϕ induce major changes in the mechanical field φ, while changes in the mechanical field only induce marginal or no changes in the electrical field. The entries of the coupling matrices and and in equations (20.2) and (20.3) provide quantitative insight into the nature of these coupling effects, which manifest themselves in the active stress Pact, the electrical flux q, and the electrical source fphi. Our current model neglects the effects of mechanical deformation on the electrical field [16]. These phenomena, which are commonly believed to be of minor importance, come in two flavors: A mechanically sensitive flux q(F) would mimic stretch-induced changes in conductivity, whereas a mechanically sensitive source fϕ(F) would mimic the effect of stretch-activated ion channels [33]. Neglecting these effects allows us to solve the electrical and mechanical problems in a decoupled way. While we ultimately aim to solve the coupled problem of electro-mechanics in equations (19) fully monolithically, here, we solve the electrical module (19.1) using Abaqus/Standard 6.13 and the mechanical module (19.2) using Abaqus/Explicit 6.13 [1].
For the fluid module, we have assumed a simplified resistance model of Windkessel type [13]. While some approaches suggest to improve this model with additional capacitors or time-varying resistances [43], our ultimate goal is to replace the compartment approach with a real fluid simulation. A fully coupled fluid-structure interaction model of the human heart is highly desirable, albeit hugely challenging, and the major research thrust in numerous groups around the world. Including fluid flow would allow us to predict shear stresses on the myocardial wall, and more importantly, on the four heart valves, throughout the entire cardiac cycle [21]. This presents tremendous opportunities to better understand the mechanisms of valvular disease and optimize their treatment in the form of valve repair or replacement, either through open heart surgery or minimally invasive intervention [14].
6.2. Concluding Remarks
We have presented a proof-of-concept simulator for cardiac excitation and contraction in the human heart. Using human computer tomography and magnetic resonance images, we have created a whole heart model with all four chambers, connected through four valves. The coordinated opening and closing of these valves regulates the filling of the chambers; the controlled interplay of electrical and mechanical fields coordinates their ejection. To simulate the blood flow from chamber to chamber, we have adopted a classical resistance-based Windkessel model. To simulate passive filling and active contraction, we have implemented a two-field finite element formulation based on coupled electrical and mechanical fields. We have shown that our model is capable of predicting the spatio-temporal evolution of electrical potentials and mechanical deformation across the heart. From these, we have extracted two common metrics of cardiac function, long-axis shortening and pressure-volume loops, which agreed well with clinical observations. Our ultimate goal is to employ our human heart simulator to probe landscapes of clinical parameters, and guide device design and treatment planning in cardiac diseases of the aortic, pulmonary, tricuspid, or mitral valve such as stenosis, regurgitation, or prolapse, and in other forms of cardiac dysfunction.
Acknowledgements
This work was performed as part of the Living Heart Project. The authors thank Dr. Julius M. Guccione, Dr. Manuel K. Rausch, Dr. Jonathan Wong, and Dr. Martin Genet for stimulating discussions. Ellen Kuhl acknowledges support by the National Science Foundation CAREER award CMMI 0952021, by the National Science Foundation INSPIRE grant 1233054, and by the National Institutes of Health grant U54 GM072970.
Footnotes
Publisher's Disclaimer: This is a PDF file of an unedited manuscript that has been accepted for publication. As a service to our customers we are providing this early version of the manuscript. The manuscript will undergo copyediting, typesetting, and review of the resulting proof before it is published in its final citable form. Please note that during the production process errors may be discovered which could affect the content, and all legal disclaimers that apply to the journal pertain.
References
- 1.Abaqus 6.13. Analysis User’s Manual. Simulia: Dassault Systèmes; 2013. [Google Scholar]
- 2.American Heart Association. Heart disease and stroke statistics 2014 update. Circulation. 2014;129:e28–e292. doi: 10.1161/01.cir.0000441139.02102.80. [DOI] [PMC free article] [PubMed] [Google Scholar]
- 3.Aliev RR, Panfilov AV. A simple two-variable model of cardiac excitation. Chaos. 1996;7:293–301. [Google Scholar]
- 4.Berberoglu E, Solmaz HO, Göktepe S. Computational modeling of coupled cardiac electromechanics incorporating cardiac dysfunctions. Euro. J. Mech. A/Solids. 2014 this issue. [Google Scholar]
- 5.Berne RM, Levy MN. Cardiovascular Physiology. The Mosby Monograph Series. 2001 [Google Scholar]
- 6.Bonet J, Wood RD. Nonlinear Continuum Mechanics for Finite Element Analysis. Cambridge University Press; 1997. [Google Scholar]
- 7.Braunwald E. Heart Disease: A Textbook of Cardiovascular Medicine. W.B. Saunders Company; 1997. [Google Scholar]
- 8.Burghoff D. Pressure-volume loops in clinical research. J. Am. College Cardiology. 2013;62:1173–1176. doi: 10.1016/j.jacc.2013.05.049. [DOI] [PubMed] [Google Scholar]
- 9.Dal H, Göktepe S, Kaliske M, Kuhl E. A fully implicit finite element method for bidomain models of cardiac electrophysiology. Comp. Meth. Biomech. Biomed. Eng. 2012;15:645–656. doi: 10.1080/10255842.2011.554410. [DOI] [PubMed] [Google Scholar]
- 10.Dal H, Göktepe S, Kaliske M, Kuhl E. A fully implicit finite element method for bidomain models of cardiac electromechanics. Comp. Meth. Appl. Mech. Eng. 2013;253:323–336. doi: 10.1016/j.cma.2012.07.004. [DOI] [PMC free article] [PubMed] [Google Scholar]
- 11.Eriksson TSE, Prassl AJ, Plank G, Holzapfel GA. Modeling the dispersion in electromechancially coupled myocardium. Int. J. Num. Meth. Biomed. Eng. 2013;29:1267–1284. doi: 10.1002/cnm.2575. [DOI] [PMC free article] [PubMed] [Google Scholar]
- 12.Fitzhugh R. Impulses and physiological states in theoretical models of nerve induction. Biophys. J. 1961;1:455–466. doi: 10.1016/s0006-3495(61)86902-6. [DOI] [PMC free article] [PubMed] [Google Scholar]
- 13.Frank O. Die Grundform des arteriellen Pulses. Zeitung für Biologie. 1899;37:483–586. doi: 10.1016/0022-2828(90)91459-k. [DOI] [PubMed] [Google Scholar]
- 14.Gessat M, Hopf R, Pollok T, Russ C, Frauenfelder T, Sundermann SH, Hirsch S, Mazza E, Szekely G, Falk V. Image-based mechanical analysis of stent deformation: Concept and exemplary implementation for aortic valve stents IEEE Trans. Biomed. Eng. 2014;61:4–15. doi: 10.1109/TBME.2013.2273496. [DOI] [PubMed] [Google Scholar]
- 15.Göktepe S, Kuhl E. Computational modeling of electrophysiology: A novel finite element approach. Int. J. Num. Meth. Eng. 2009;79:156–178. doi: 10.1002/cnm.2565. [DOI] [PMC free article] [PubMed] [Google Scholar]
- 16.Göktepe S, Kuhl E. Electromechanics of the heart - A unified approach to the strongly coupled excitation-contraction problem. Comp. Mech. 2010;45:227–243. [Google Scholar]
- 17.Göktepe S, Wong J, Kuhl E. Atrial and ventricular fibrillation - Computational simulation of spiral waves in cardiac tissue. Arch. Appl. Mech. 2010;80:569–580. [Google Scholar]
- 18.Göktepe S, Acharya SNS, Wong J, Kuhl E. Computational modeling of passive myocardium. Int. J. Num. Meth. Biomed. Eng. 2011;27:1–12. [Google Scholar]
- 19.Göktepe S, Menzel A, Kuhl E. The generalized Hill model: A kinematic approach towards active muscle contraction. 2014 doi: 10.1016/j.jmps.2014.07.015. submitted for publication. [DOI] [PMC free article] [PubMed] [Google Scholar]
- 20.Gonzales MJ, Sturgeon G, Krishnamurthy A, Hake J, Jonas R, Stark P, Rappel WJ, Narayan SM, Zhang Y, Segars WP, McCulloch AD. A three-dimensional finite element model of human artrial anatomy: New methods for cubic Hermite meshes with extraordinary ventricles. Med. Im. Anal. 2013;17:525–537. doi: 10.1016/j.media.2013.03.005. [DOI] [PMC free article] [PubMed] [Google Scholar]
- 21.de Hart J, Peters GWM, Schreurs PJG, Baaijens FPT. A three-dimensional computational analysis of fluid-structure interaction in the aortic valve. J Biomech. 2003;36:103–112. doi: 10.1016/s0021-9290(02)00244-0. [DOI] [PubMed] [Google Scholar]
- 22.Holzapfel GA. Nonlinear Solid Mechanics: A Continuum Approach for Engineering. John Wiley & Sons; 2000. [Google Scholar]
- 23.Holzapfel GA, Ogden RW. Constitutive modelling of passive myocardium: A structurally based framework for material characterization. Phil. Trans. A. 2009;367:3445–3475. doi: 10.1098/rsta.2009.0091. [DOI] [PubMed] [Google Scholar]
- 24.Hunter PJ, Pullan AJ, Smaill BH. Modeling total heart function. Ann. Rev. Biomed. Eng. 2003;5:147–177. doi: 10.1146/annurev.bioeng.5.040202.121537. [DOI] [PubMed] [Google Scholar]
- 25.Hurtado DE, Kuhl E. Computational modeling of electrocardiograms: Repolarization and T-wave polarity in the human heart. Comp. Meth. Biomech. Biomed. Eng. 2014;17:986–996. doi: 10.1080/10255842.2012.729582. [DOI] [PMC free article] [PubMed] [Google Scholar]
- 26.Hurtado DE, Henao D. Gradient flows and variational principles for cardiac electrophysiology: Toward efficient and robust numerical simulations of the electrical activity of the heart. Comp. Meth. Appl. Mech. Eng. 2014;273:238–254. [Google Scholar]
- 27.Keener J, Sneyd J. Mathematical Physiology. Springer Science and Business Media; 2004. [Google Scholar]
- 28.Klepach D, Lee LC, Wenk JF, Ratcliffe MB, Zohdi TI, Navia JL, Kassab GS, Kuhl E, Guccione JM. Growth and remodeling of the left ventricle: A case study of myocardial infarction and surgical ventricular restoration. Mech. Res. Comm. 2012;42:134–141. doi: 10.1016/j.mechrescom.2012.03.005. [DOI] [PMC free article] [PubMed] [Google Scholar]
- 29.Kotikanyadanam M, Göktepe S, Kuhl E. Computational modeling of electrocardiograms - A finite element approach towards cardiac excitation. Int. J. Num. Meth. Biomed. Eng. 2010;26:524–533. [Google Scholar]
- 30.Krishnamoorthi S, Sarkar M, Klug WS. Numerical quadrature and operator splitting in finite element methods for cardiac electrophysilogy. Int. J. Num. Meth. Biomed. Eng. 2013;29:1243–1266. doi: 10.1002/cnm.2573. [DOI] [PMC free article] [PubMed] [Google Scholar]
- 31.Kumar V, Abbas AK, Fausto N. Robbins and Cotran Pathologic Basis of Disease. Elsevier Saunders; 2005. [Google Scholar]
- 32.Lee LC, Wenk JF, Zhong L, Klepach D, Zhang ZH, Ge L, Ratcliffe MB, Zohdi TI, Hsu E, Navia JL, Kassab GS, Guccione JM. Analysis of patient-specific surgical ventricular restoration: Importance of an ellipsoidal left ventricular geometry for diastolic and systolic function. J. Appl. Phys. 2013;115:136–144. doi: 10.1152/japplphysiol.00662.2012. [DOI] [PMC free article] [PubMed] [Google Scholar]
- 33.Markhasin VS, Solovyova O, Katsnelson LB, Protsenko Y, Kohl P, Noble D. Mechano-electric interactions in heterogeneous myocardium: Development of fundamental experimental and theoretical models. Prog. Biophys. Mol. Biol. 2003;82:207–220. doi: 10.1016/s0079-6107(03)00017-8. [DOI] [PubMed] [Google Scholar]
- 34.Murtada SC, Arner A, Holzapfel GA. Experiments and mechanochemical modeling of smooth muscle contraction: Significance of filament overlap. J. Theor. Bio. 2012;297:176–186. doi: 10.1016/j.jtbi.2011.11.012. [DOI] [PubMed] [Google Scholar]
- 35.Nagumo J, Arimoto S, Yoshizawa S. An active pulse transmission line simulating nerve axon. Proc. Inst. Radio Eng. 1962;50:2061–2070. [Google Scholar]
- 36.Nash MP, Panfilov AV. Electromechanical model of excitable tissue to study reentrant cardiac arrhythmias. Progr. Biophys. Mol. Bio. 2004;85:501–522. doi: 10.1016/j.pbiomolbio.2004.01.016. [DOI] [PubMed] [Google Scholar]
- 37.Pezzuto S, Ambrosi D, Quarteroni A. An orthotropic activestrain numerical model for the mechanics of the myocardium. Euro. J. Mech. A/Solids. 2014 this issue. [Google Scholar]
- 38.Rausch MK, Kuhl E. On the effect of prestrain and residual stress in thin biological membranes. J. Mech. Phys. Solids. 2013;61:1955–1969. doi: 10.1016/j.jmps.2013.04.005. [DOI] [PMC free article] [PubMed] [Google Scholar]
- 39.Robers WJ, Shapiro EP, Weiss JL, Buchalter MB, Rademakers FE, Weisfeldt ML, Zerhouni EA. Quantification of and correlation for left-ventricular systolic long-axis shortening by magnetic-resonance tissue tagging and slice isolation. Circulation. 1991;84:721–731. doi: 10.1161/01.cir.84.2.721. [DOI] [PubMed] [Google Scholar]
- 40.Rossi S, Ruiz-Baier R, Pavarino L, Quarteroni A. Orthotropic active strain models for the numerical simulation of cardiac biomechanics. Int. J. Num. Meth. Biomed. Eng. 2012;28:761–788. doi: 10.1002/cnm.2473. [DOI] [PubMed] [Google Scholar]
- 41.Rossi S, Lassila T, Ruiz-Baier R, Sequeira A, Quarteroni A. Thermodynamically consistent orthotropic activation model capturing ventricular systolic wall thickening in cardiac electromechanics. Euro. J. Mech. A/Solids. 2014 this issue. [Google Scholar]
- 42.Shmukler M. Density of Blood. The Physics Factbook. 2004 [Google Scholar]
- 43.Smith BW. Dissertation. Christchurch, New Zeland: University of Canterbury; 2004. Minimal haemodynamic modelling of the heart and circulation for clinical application. [Google Scholar]
- 44.Trayanova NA. Whole-heart modeling: Applications to cardiac electrophysiology and electromechanics. Circ. Res. 2011;108:113–128. doi: 10.1161/CIRCRESAHA.110.223610. [DOI] [PMC free article] [PubMed] [Google Scholar]
- 45.Trayanova NA, Constantino J, Gurev V. Electromechanical models of the ventricles. Am. J. Phys. Heart Circ. Phys. 2011;301:H279–H286. doi: 10.1152/ajpheart.00324.2011. [DOI] [PMC free article] [PubMed] [Google Scholar]
- 46.Tsamis A, Bothe W, Kvitting JP, Swanson JC, Miller DC, Kuhl E. Active contraction of cardiac muscle: In vivo characterization of mechanical activation sequences in the beating heart. J. Mech. Behavior Biomed. Mat. 2011;4:1167–1176. doi: 10.1016/j.jmbbm.2011.03.027. [DOI] [PMC free article] [PubMed] [Google Scholar]
- 47.Walker JC, Ratcliffe MB, Zhang P, Wallace AW, Fata B, Hsu EW, Saloner D, Guccione JM. MRI-based finite-element analysis of left ventricular aneurysm. Am. J. Physiol. Heart Circ. Physiol. 2005;289:H692–H700. doi: 10.1152/ajpheart.01226.2004. [DOI] [PubMed] [Google Scholar]
- 48.Wong J, Göktepe S, Kuhl E. Computational modeling of chemo-electro-mechanical coupling: A novel implicit monolithic finite element approach. Int. J. Num. Meth. Biomed. Eng. 2013;29:1104–1133. doi: 10.1002/cnm.2565. [DOI] [PMC free article] [PubMed] [Google Scholar]
- 49.Wong J, Kuhl E. Generating fiber orientation maps in human heart models using Poisson interpolation. Comp. Meth. Biomech. Biomed. Eng. 2014;17:1217–1226. doi: 10.1080/10255842.2012.739167. [DOI] [PMC free article] [PubMed] [Google Scholar]
- 50.Zygote Media Group, Inc. The Zygote Solid 3D Heart Model. 2013 [Google Scholar]


