Abstract
Ultrasound frame rates play a key role for accurate cardiac deformation tracking. Insufficient frame rates lead to an increase in signal decorrelation artifacts; resulting in erroneous displacement and strain estimation. Joint probability density distributions generated from estimated axial strain and its associated signal-to-noise ratio provide a useful approach to assess the minimum frame rate requirements. Previous reports have demonstrated that bimodal distributions in the joint probability density indicate inaccurate strain estimation over a cardiac cycle. In this study, we utilize similar analysis to evaluate a two-dimensional multi-level displacement tracking and strain estimation algorithm for cardiac strain imaging. The impact of different frame rates, final kernel dimensions, and a comparison of radiofrequency and envelope based processing are evaluated using echo signals derived from a three-dimensional finite element cardiac model and 5 healthy volunteers. Cardiac simulation model analysis demonstrate that the minimum frame rates required to obtain accurate joint probability distributions for the signal to noise ratio and strain, for a final kernel dimension of 1 λ by 3 A-lines, was around 42 Hz for radiofrequency signals. On the other hand, even a frame rate of 250Hz with envelope signals did not replicate the ideal joint probability distribution. For the volunteer study, clinical data was acquired only at a 34 Hz frame rate which appears to be sufficient for radiofrequency analysis. We also show that an increase in the final kernel dimensions significantly impact the strain probability distribution and joint probability density function generated; with a smaller impact on the variation in the accumulated mean strain estimated over a cardiac cycle. Our results demonstrate that radiofrequency frame rates currently achievable on clinical cardiac ultrasound systems are sufficient for accurate analysis of the strain probability distribution, when a multi-level two-dimensional algorithm and kernel dimensions on the order of 1 λ by 3 A-lines or smaller are utilized.
Keywords: ultrasound, elastography, echocardiographic strain imaging, deformation imaging, cardiac strain imaging
Introduction
Ultrasound based elasticity imaging, was first developed in the early 1990s primarily for the detection and characterization of masses in the breast and prostate (Wilson and Robinson 1982; Krouskop et al. 1987; Parker et al. 1990; Ophir et al. 1991a; Ophir et al. 1991b; Cespedes et al. 1993; O'Donnell et al. 1994; Garra et al. 1997; Insana et al. 2000; Varghese et al. 2001; Nightingale et al. 2002; Hall et al. 2003; Varghese 2009). For strain imaging, local and accessible tissues were deformed externally with local displacements estimated by tracking tissue deformation between two snapshots of ultrasound echo signals; acquired before and after the applied deformation, using normalized cross-correlation based echo signal analysis (Wilson and Robinson 1982; Ophir et al. 1991a; Ophir et al. 1991b; Cespedes et al. 1993; O'Donnell et al. 1994; Garra et al. 1997; Insana et al. 2000; Varghese et al. 2001; Hall et al. 2003; Varghese 2009).
Unlike traditional strain imaging for tumor detection, in cardiac strain imaging (D'Hooge et al. 2000; Konofagou et al. 2002; Varghese et al. 2003; Jia et al. 2009; Geyer 2010; Bouchard et al. 2011; Hsu et al. 2012) and for plaque characterization, the deformation of tissue is not initiated by forces applied externally, but rather, by the constant physiological excitation initiated by heart itself, e.g., during systolic phase the left ventricular wall contracts to propel blood into the aorta, while during the diastolic phase it expands to enable blood to flow in from the left atrium. While the cardiac wall deformation has been extracted utilizing strain imaging of cardiac muscle; the vascular deformations generated by cardiac pulsation, provide the deformation source for plaque characterization (Odonnell et al. 1994; Talhami et al. 1994; van der Steen et al. 1998). In order to thoroughly investigate functional characteristics of cardiac muscle under these variable and pulsatile deformations, ultrasound signals are acquired and deformations tracked over each phase of cardiac cycle for strain imaging. Incremental strain maps obtained between these echo signal frames can also be accumulated to obtain localized and accumulated strain variations across cardiac cycles.
Insufficient temporal frame rates in the ultrasound echo signal data acquired may introduce signal de-correlation artifacts between consecutive echo signal frames due to high tissue deformation rate and significant out-of-plane motion, especially during the systolic phase (Lopata et al. 2010). Increased signal de-correlation will produce both erroneous incremental strains and corrupt the cumulative displacement and strain estimated (Alam and Ophir 1997).
The minimum frame rate needed to successfully recover cardiac strain has been studied by several groups (Langeland et al. 2005; Chen et al. 2009; Provost et al. 2012). Chen et al. (2009) conducted uniformly elastic tissue-mimicking (TM) phantom studies using a cyclic compression platform; their phantom experiment results obtained using a two-step one-dimensional (1D) cross-correlation method (Shi and Varghese 2007) showed that frame rates higher than 10 times the cyclic compression frequency was necessary to maintain high elastographic signal-to-noise ratio (SNRe) levels (≈16dB) using radiofrequency (RF) signals.
Open-chest sheep studies by Langeland et al. (2005) showed good agreement on longitudinal and radial strain estimated using two-dimensional (2D) tracking using RF signals when compared to sonomicrometry at a frame rate of 168 Hz. However, they did not explore the impact of lower frame rates in their study (Langeland et al. 2005). Recently, Provost et al. (2012) proposed the use of a joint probability density function (pdf) map of the SNRe and strain probability distribution to analyze the frame rate problem for cardiac applications. They reported a sharp decline in the SNRe values in the joint pdf maps in the vicinity of 4% strain in their open-chest canine heart study using a phased array transducer operated at a 3.3 MHz center frequency (Provost et al. 2012). Their results showed that a minimum frame rate of 350 Hz was needed to eliminate distortions in the strain probability distribution and to obtain a unimodal distribution in the joint pdf. This minimum frame rate corresponds to roughly 210 frames/cardiac cycle, although this was not directly specified in their paper. They reported that lower frame rates resulted in an artifactual bimodal distribution in the joint pdf corresponding to increased errors in the strain estimated. Displacement and strain were estimated using a 1D normalized cross-correlation algorithm with a processing window length of 4.6 mm and a 90% overlap between the data segments in their study.
In this paper, we utilize the same joint pdf concept proposed by Provost et al. (2012), to assess the frame rate requirement for cardiac strain imaging using a multi-level 2D cross-correlation algorithm previously developed in our laboratory (Shi and Varghese 2007). The joint pdf was first demonstrated for an inclusion phantom by Varghese and Ophir (Varghese and Ophir 1998) (see Figure 12 in Varghese and Ophir (1998)). The impact of the final processing 2D cross-correlation kernel dimensions (denoted as “final kernel dimensions” for the rest of the paper) of the multi-level algorithm on the joint pdf obtained will be evaluated on a three-dimensional (3D) finite element based cardiac simulation data set (Chen and Varghese 2010) and echo signal data acquired on 5 normal healthy volunteers. In addition, we also compare axial strain estimation results on short axis echocardiographic views estimated using RF and envelope echo signals.
Materials and Methods
Finite Element Cardiac Simulation
A 3D canine cardiac simulation model previously developed in our laboratory was utilized for this study (Chen and Varghese 2010). This model is based on a 3D finite element analysis (FEA) model of a canine heart developed by the Cardiac Mechanics Research Group at University of California San Diego (UCSD). The heart rate of the canine heart model was 2 cycles per second, with a sampling/frame rate of 250 Hz. This frame rate corresponds to 125 frames/cardiac cycle. The initial data contained movement information of 1296 points located in the canine heart, which then are interpolated into over 1 million points for our analysis. This interpolation was essential to include sufficient number of scatterers on the order of 10 scatterers per cubic millimeter of tissue, to ensure Rayleigh scattering statistics for ultrasound echo signals.
In this study, a mid-cavity slice of the left ventricle along the short axis view was selected to generate simulated ultrasound echo signals. A frequency domain ultrasound simulation previously developed in our laboratory (Li and Zagzebski 1999) was utilized. Simulated RF signals were generated using inverse Fourier transformation of the frequency domain results. The purpose of the simulation study was to take advantage of the known displacement/strain information that can be extracted from the FEA model as a comparison standard for displacement/strain estimation accuracy obtained using our algorithm.
In vivo Volunteer data Acquisition
Echocardiography data from 5 healthy human volunteers were acquired in the UW adult echocardiography clinic under a protocol approved by UW-Madison Health Sciences institutional review board (IRB). Informed consent was obtained from each volunteer before echocardiographic scanning and RF data acquisition. A GE Vivid 7 system (GE Ultrasound, Waukesha, WI, USA) equipped with a phased array transducer operated at a 2.5 MHz center frequency was utilized for data acquisition. RF signals along a parasternal short axis view along the mid-cavity were collected over several cardiac cycles. Data from one of the volunteers was used for most of the results reported in this paper. The heart rate of the selected volunteer was 0.81 beats /second. Repeatability of the results was demonstrated using RF data acquired on all the 5 volunteers. RF data was acquired at a frame rate of 34 Hz with a sampling frequency of 20 MHz.
Multi-level Strain Estimation
A 2D multi-level strain estimation algorithm previously developed in our laboratory (Shi and Varghese 2007) was adapted for strain estimation for data acquired using a phased array transducer (Chen and Varghese 2009). This algorithm uses an iterative coarse-to-fine searching scheme to estimate displacement between frames. Displacement estimation results at a coarse level were utilized as a search guide for the next finer level. The resolution of the estimated displacement field was refined by reducing the cross-correlation kernel dimensions at each iteration level, while keeping the kernel overlap fixed. In the initial coarse search, the envelope of the RF echo signal was processed, for faster estimation; while RF signals, which contain phase information, were utilized for the remaining levels. In this paper, a total of 4 iteration levels were used to generate the final displacement estimate. The 2D kernel overlap was kept at 50% for all 4 levels. Axial strain along the beam propagation direction were then estimated using a 9 point least squares fit (Kallel and Ophir 1997).
Joint Probability Function and Analysis
Improvements in the SNRe estimated have been previously utilized by many investigators in assessing the quality of strain information obtained (Bilgen and Insana 1997; Varghese and Ophir 1997). The SNRe is defined as:
| (1) |
where μe stands for the mean strain value within a given region-of-interest (ROI), while σe denotes the corresponding standard deviation. For SNRe measurements, any spatial variation in tissue elasticity could induce additional artifacts (Varghese and Ophir 1997); as a result, SNRe values are usually measured in uniformly elastic phantoms where a sufficiently large ROI can also be incorporated. The joint pdf shown in Varghese and Ophir (Varghese and Ophir 1998) substituted the normalized correlation coefficient value estimated into the expression for the standard deviation. Cardiac strain images are not ideal for generating SNRe values, as the elasticity of myocardial wall varies spatially in heart. Provost et al. (2012) showed a way to alleviate this problem by using smaller ROIs for standard deviation calculations. In their study, SNRe values were calculated using a 1-D 4.85 mm processing window along the axial direction. In this paper, we compute the SNRe in a 3 pixel by 3 pixel ROI (9 strain data points). The ROI used for the joint pdf computations are not overlapped, and moved over the entire strain image in the short axis view of the 2-D left ventricle slice for SNRe computations. (Physical dimensions of our ROI are determined by the axial dimension of the final 2D strain estimation kernel.)
The joint probability density functions (pdf) for SNRe and strain estimates are defined as:
| (2) |
Where f (SNRe, Strain) is the joint probability density between the SNRe estimated and local strain. (ε1, ε2) and (s1, s2) represents the intervals within which the incremental strain and SNRe are measured. And Pr represents the probability that such joint measurement occurs. By calculating Pr within different intervals, a 2D joint pdf map can be formed. A 200 by 200 grid is used to map the joint pdf in our study.
The focus of our analysis in this paper is to explore the joint pdf map of the SNRe and incremental axial strain using different displacement estimation frame rates (frame rate at which the incremental displacement is estimated) and final 2D kernel dimensions. Again, the incremental axial strain is defined as strain estimated along the beam propagation direction between two consecutive frames. The frame rates range from 21 Hz to 250 Hz for cardiac simulations and 8 Hz to 34 Hz for the in vivo volunteer study. The final kernel dimension is reported based on the wavelength (λ) along the beam propagation direction, and number of A-lines perpendicular to the beam propagation direction. The choice of parameters utilized in this study is listed in Table 1. Furthermore, we will also assess differences in the joint pdf map of the SNRe and strain, obtained using either RF and envelope echo signals for displacement estimation. Note that when envelope signals are evaluated, these signals will be used in all 4 iteration levels in the coarse-to-fine search, whereas in the RF case, envelope signals will be only used in the initial iteration level.
Table 1.
Parameters used in the 2-D multilevel strain estimation algorithm.
| Simulation study | In vivo study | |
|---|---|---|
| Final kernel dimension ([wavelengths, A-lines]) | [1,3], [3,3], [4,5], [8,5] | |
| Displacement estimation frame rates (Hz) | 250,83,42,21 | 34,17,8 |
Results
Simulation Results
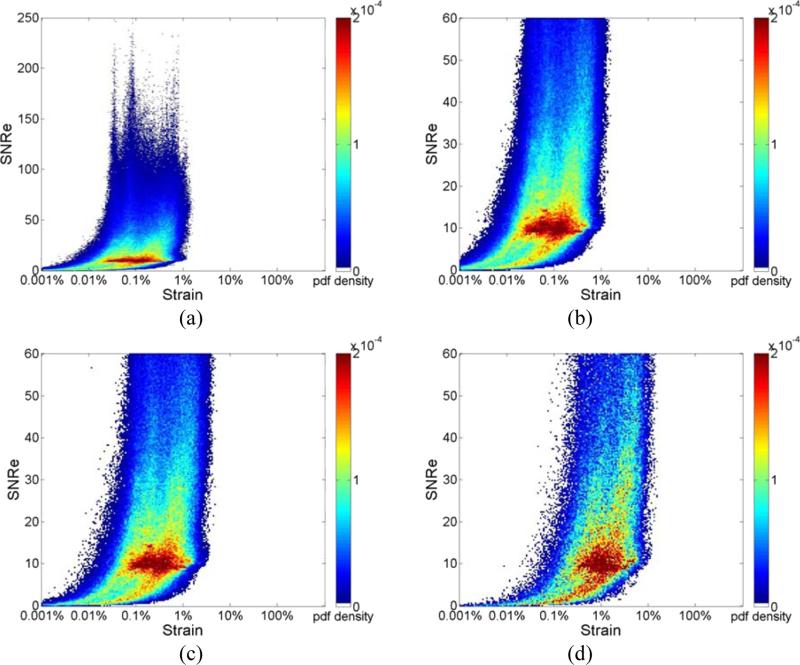
Joint pdf maps of the ideal strain directly derived from cardiac FEA model are presented in Fig. 1. The x-axis denotes incremental strain on a logarithmic scale and the y-axis presents the computed SNRe. Observe that the maximum SNRe in the ideal FEA distribution is about 200, as illustrated in Fig. 1(a) at the full frame rate of 250 Hz. Fig. 1 (b-d) show the ideal FEA joint pdf maps obtained utilizing frame rates of 250Hz, 83Hz and 21 Hz respectively (by appropriately decimating the frame rate), with the upper limit of SNRe set at 60 to highlight the high probability density region with SNRe values around 10. Because all these strains are directly derived from the cardiac FEA model, as the frame rate is decreased, the joint pdf only shifts towards higher strain values while the shape of the joint pdf remains nearly unchanged, and is clearly visualized in Figs. 1(b-d).
Figure 1.
Joint probability density function of the corresponding SNRe of the ideal incremental strain estimates, derived directly from the FEA model at frame rate of (a) 250Hz where the y-axis of the SNRe plot ranges from 0 to 250; (b) 250Hz;(c) 83Hz; and (d) 21Hz where the y-axis of the SNRe plot ranges from 0 to 60 for improved visualization of different strain concentrations in the probability density function mapping.
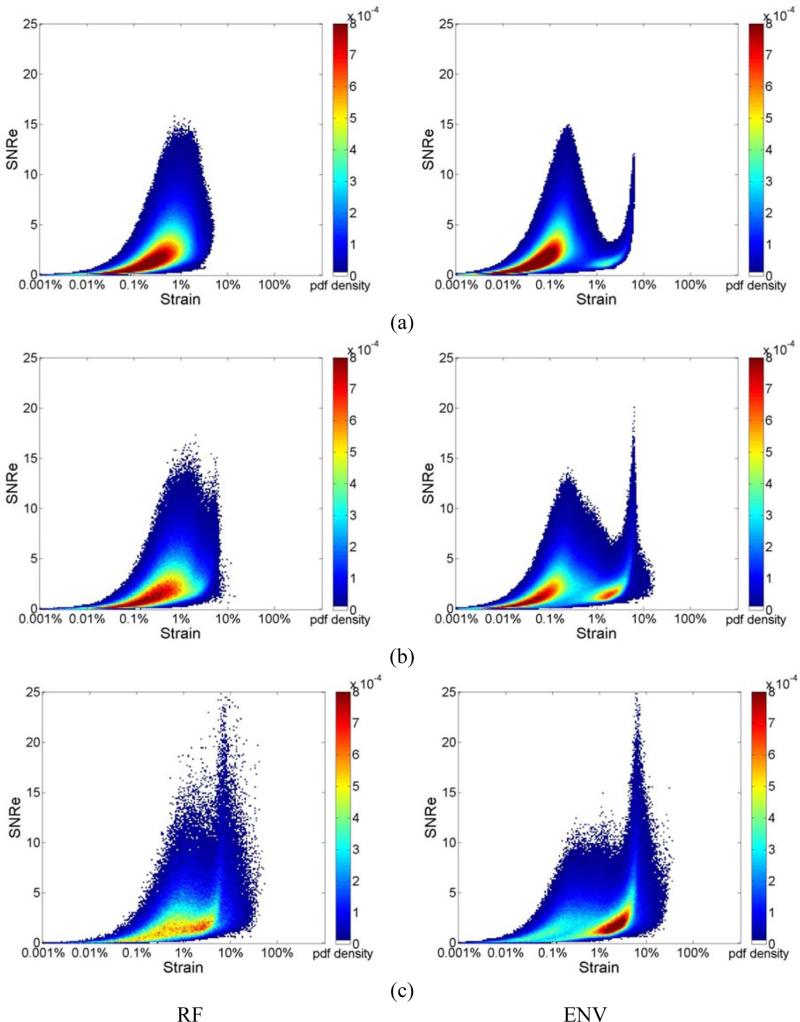
Figure 2, presents the joint pdf of strains estimated from ultrasound RF echo signals, where the deformation from the FEA model is incorporated into the echo signal loop over the cardiac cycle. Strain estimation is then performed using both RF and envelope signals. Joint pdf's obtained using RF echo signals are shown in the left column while the joint pdf's obtained using envelope signals are shown in the right column. All the three plots in Fig. 2 (a-c) were obtained with a final 2D kernel dimension of 1 λ by 3 A-lines respectively. Figure 2 RF (a-c) show the joint pdf maps obtained using RF signals at frame rate of 250Hz, 83Hz and 21Hz respectively. Fig. 2 ENV (a-c) shows the joint pdf maps obtained using envelope signals at frame rate of 250Hz, 83Hz and 21Hz. In Fig. 2, the high probability regions is concentrated at lower SNRe values (around 2.5) when compared with the pdf maps generated with ideal strain from the FEA model. While the RF result at 250 Hz and 83Hz show a clear unimodal shape, when the frame rate decreases to 21 Hz, a bimodal tendency can be observed, although not as apparent when compared to the envelope results. Note that the bimodal pattern is present in all the joint pdf maps obtained using envelope processing as illustrated in Fig. 2 ENV (a-c), even for the highest frame rate of 250 Hz.
Figure 2.
Joint probability density function of the corresponding SNRe of the incremental strain estimated from simulations at a frame rate of (a) 250Hz, (b) 83Hz and (c) 21Hz for RF and envelope signals.
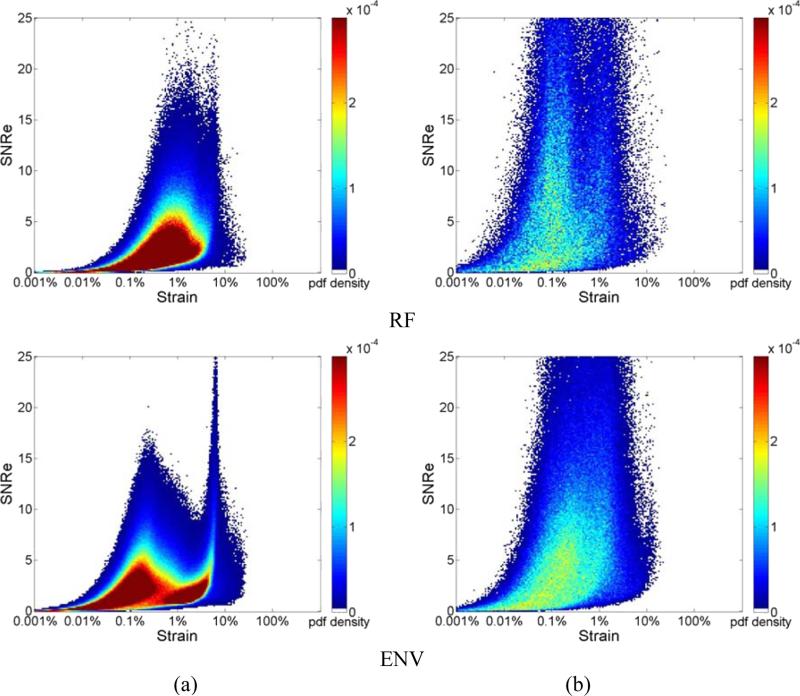
Figure 3 illustrates the joint pdf obtained for different final kernel dimensions. Results are shown for a frame rate of 83Hz. We compare results generated using a final kernel of 1 λ by 3 A-line in Fig. 3 (a), to the joint pdf obtained using a larger final kernel of 8 λ by 5 A-lines in Fig. 3(b), for estimation using RF echo signals. Observe that a unimodal distribution is obtained for processing with RF signals for the smaller kernel dimension, while the unimodal shape changes into a slightly bimodal pattern even for RF processing with the larger 2D kernel as illustrated in Fig. 3(b) for the same frame rate of 83 Hz. On the other hand the bimodal pattern remains for envelope processing for both the small kernel in Fig. 3 (a) and the larger final kernel dimension in Fig. 3(b). A comparison between Figs. 3(a) and 3(b) indicate a movement towards a unimodal distribution in Fig. 3(b) for envelope processing with the larger kernel.
Figure 3.
Joint probability density function of the corresponding SNRe of the incremental strain estimated from simulations at a frame rate of 83 Hz using a final kernel dimension (λ by A-lines) of (a) 1 by 3, (b) 8 by 5 for RF and envelope signals.
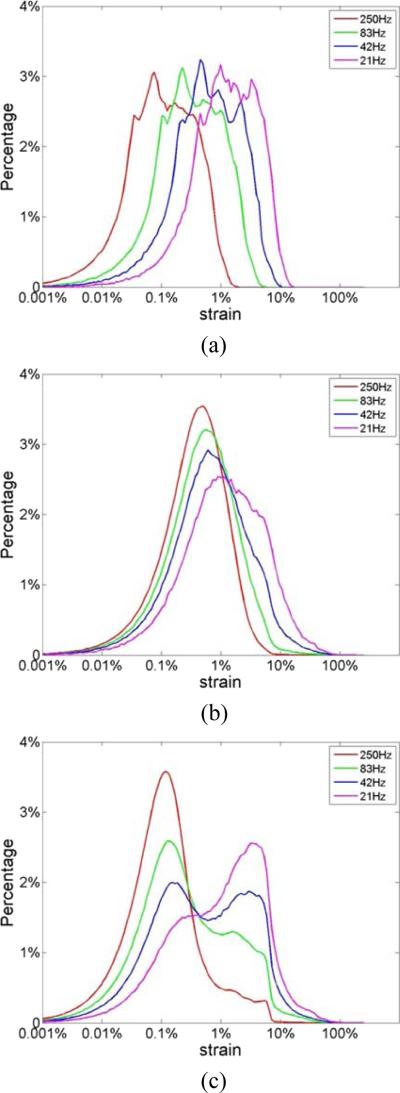
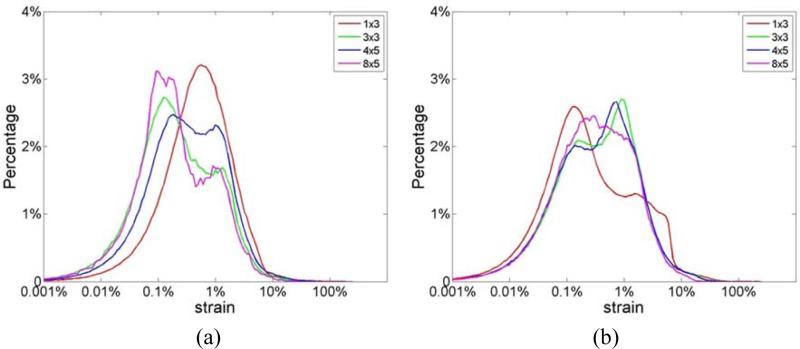
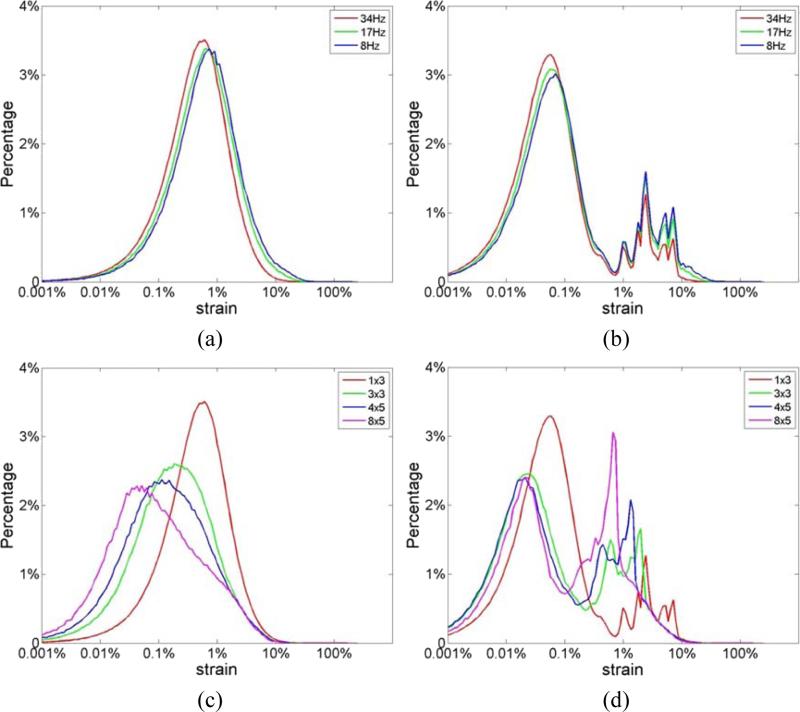
The incremental strain values directly derived from the 3D FEA cardiac model (denoted as “ideal strain”) can be utilized to evaluate the accuracy of strain estimation based on the corresponding estimated incremental strain along with the variations in the strain over several cardiac cycles (Chen and Varghese 2009; Chen and Varghese 2010; Ma and Varghese 2012b; Ma and Varghese 2012a). Plots of the strain probability distribution at different frame rates are shown in Fig. 4, with the underlying ideal FEA strain probability distribution shown in Fig. 4(a). The y-axis represents the probability (shown in percentage) that a specific strain value appears in the strain probability distribution. Note that neither of the strain probability distributions estimated using RF or envelope echo signals, illustrated in Figs. 4(b-d), possess the exact similar shape as the ideal strain probability distribution directly derived from FEA model shown in Fig. 4(a). However, we do anticipate that the strain probability distribution estimated would not resemble the underlying strain probability distribution (FEA) due to the finite sonographic SNR associated with ultrasound echo signals, along with errors in the subsequent displacement estimation performed on the echo signals as illustrated using the ‘strain filter’ concept (Varghese and Ophir 1997). Observe that processing the RF echo signals provides the closest correspondence to the underlying FEA strain probability distribution shown in Fig. 4(b). However, even tracking with RF signals using the smaller kernel (1 λ by 3 A-line), appear incapable of tracking strains lower than 0.01% obtained at the 250 Hz frame rate, when comparing the strain curves in Figs. 4(a) and (b). In addition, Fig. 4(b) clearly shows the unimodal shape of the strain probability distribution when RF signals are processed with a 1 λ by 3 A-line 2D final kernel dimension, even with frame rates as low as 21 Hz, which corresponds to approximately 10 frames/ cardiac cycle. Note that the area under the strain probability distribution would always add up to 100% in Fig. 4.
Figure 4.
Comparison of the ideal strain probability distribution obtained directly from the (a) FEA model; to that estimated from ultrasound simulations using a 1 λ by 3 A-lines final kernel dimension; using (b) RF and (c) envelope signals at different temporal frame rates.
The ‘strain filter’ concept introduced by Varghese and Ophir (1997), demonstrate that estimated strains depicted in the strain image (using an algorithm such as cross-correlation), would be a sub-set of the actual strains present in tissue. The strain estimator behaves akin to a bandpass filter in the strain domain (Varghese and Ophir 1999). The deviation from an ideal all-pass characteristic in the strain domain is due to limitations introduced by the ultrasound system parameters, signal processing parameters, finite sonographic SNR (due to electronic and quantization noise) and the impact of signal decorrelation due to the applied deformation (Varghese et al. 1998). Signal decorrelation determines the largest strain value that is accurately estimated, while the sonographic SNR determines the lowest strain value estimated with a reasonable SNRe. As a result, the dynamic range of the imaging system is limited by the lowest and highest strain estimated in tissue with a reasonable SNRe. Tradeoffs associated with strain imaging have been discussed previously (Varghese et al. 2001).
Figure 4(c) presents strain estimation results at different frame rates using envelope signals, which indicate a bimodal strain probability distribution for all frame rates. Note that near the lower end of the strain probability distribution, a peak appears around 0.1% strain, with a higher peak at around 5%. This is very similar to the pattern observed in the joint pdf plots of the SNRe in Fig. 3 with envelope signals. Another interesting observation in Fig. 4 is that at 250 Hz, the peak of the ideal curve was located at less than 0.1% whereas that of the RF-based curve was located at around 0.5%. This is because the performance of strain estimation indicated by the SNRe declines when strains to be estimated become too small and are dominated by sonographic noise artifacts (Varghese and Ophir 1997). This has been previously described based on the ‘strain filter’ concept (Bilgen and Insana 1997; Varghese and Ophir 1997), and also discussed above. Figures 5(a) and (b) present the strain probability distribution obtained when larger final kernel dimensions are used for both RF and envelope signals respectively. Note that, similar to the observation in Fig. 3, bimodal strain probability distribution patterns are obtained when larger kernel dimensions are used for RF echo signal processing.
Figure 5.
Comparison of the strain probability distribution generated from simulations using the final 2D kernel dimensions shown in the caption using (a) RF and (b) envelope signals at a frame rate of 83 Hz.
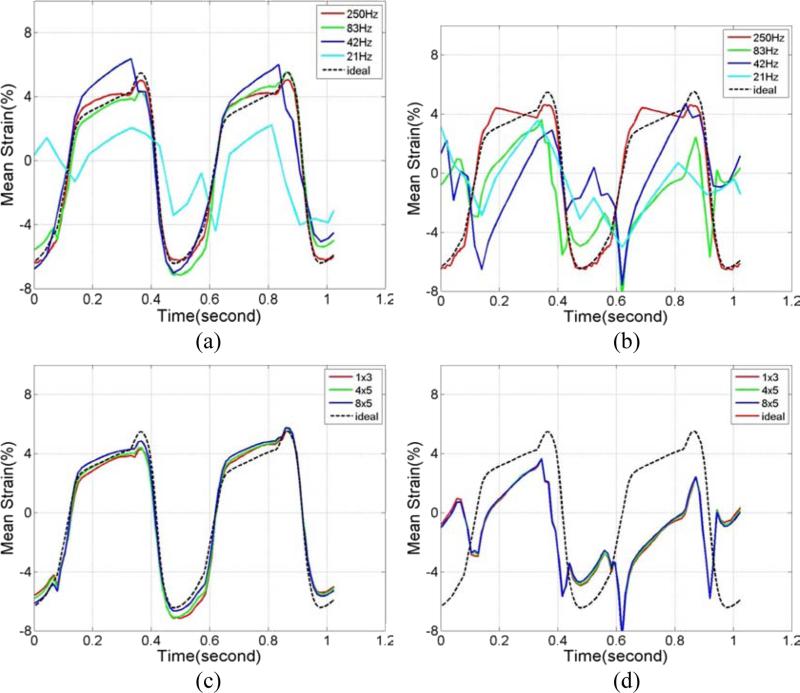
The incremental strains estimated from two consecutive frames can be accumulated over time to better illustrate the strain variation over a cardiac cycle. In Fig. 6, we compare the variation of the accumulated mean ideal strain curves over time (cardiac cycle) obtained using FEA to the accumulated mean strains estimated using both RF and envelope signal processing. Plots are shown for mean strains estimated within a 1 cm2 ROI located in the left ventricle over two cardiac cycles in segment 6 (Ma and Varghese 2012a). Comparison with ideal strains at different frame rates for RF and envelope signals are plotted separately in Figs. 6(a) and (b). Note that while the mean strain estimated using RF signals follow the ideal FEA curve closely for frame rates as low as 42 Hz, strain estimated using envelope signals fail to track the ideal curve even at an 83 Hz frame rate. Detailed analysis on strain estimated using RF and envelope strains at 250 Hz was described in our previous papers (Ma and Varghese 2012b; Ma and Varghese 2012a). Note that in Fig. 3, we selected 83 Hz as the frame rate to analyze the effect of final kernel dimensions on joint pdf maps. In Figs. 6(c) and (d), 83 Hz was also selected to compare accumulated strain curves generated using different final kernel dimensions. As expected, strain estimated using RF signals closely follow the ideal FEA curve, while none of the curves follows the ideal strain curve for strain estimated using envelope signals. In addition, note that the joint pdf's for the SNRe and strain were computed using a smaller ROI (3×3 pixels); while the mean accumulated strain curves were computed over larger 1 cm2 ROIs. The increased averaging over the 1 cm2 ROIs also reduce accumulated strain fluctuations in Fig. 6.
Figure 6.
Comparison of the accumulated mean strain plots within the ROI estimated from simulations using 1 λ by 3 A-lines final kernel with (a) RF, and (b) envelope signals at different frame rates. A comparison of the estimation performance using different final kernel dimensions for a frame rate of 83 Hz with (c) RF signals and (d) envelope signals are also shown.
Quantitative analysis of the accuracy of the accumulated strain estimated in Fig 6 is shown in Tables 2 and 3. The mean absolute error (MAE) between the estimated and ideal accumulated strain over two cardiac cycles is given by:
| (3) |
where Ii denotes the ideal accumulated strain and Ei represents the estimated accumulated strain respectively at a time instant i. The absolute value of the difference between Ii and Ei were averaged over two cardiac cycles containing n time points. To present the MAE between the ideal and estimated values as a percentage, we normalize the MAE to the average ideal accumulated strain value over the two cardiac cycles, to obtain:
| (4) |
Table 2 presents the normalized MAE (nMAE) for different frame rates, where the final kernel dimension was 1 λ by 3 A-lines for both RF and envelope signals. For RF signals, the nMAE value increased from 8.4% to 16.3%, while that for the envelope signals increased from 12.7% to 91.6% when frame rate was decimated from 250 Hz to 83 Hz. Note that the increase in the nMAE with frame rate was gradual for the RF signals, a steep increase in the nMAE value for the envelope signals is observed from 12.7% to 91.6%. These abrupt increases in the nMAE are consistent with our observations on strain estimation accuracy in Figs. 6(a) and (b). Table 3 presents the nMAE for different final cross-correlation window dimensions. The frame rate used was 83 Hz for both RF and envelope signals. Again, similar to our observations in Figs. 6(c) and (d), for RF signals, the nMAE value remains around 16.3-12.3% for all the four final kernel dimensions, while for envelope signals, the nMAE value for the four final kernel dimensions are quite high between 91.6%-89.8%. A slight reduction in the error is seen with larger kernel dimensions, however, the tradeoff with the improved resolution obtained is more significant.
Table 2.
Normalized MAE between estimated and ideal accumulated strain over two cardiac cycles for different frame rates. The final kernel dimension was 1 λ by 3 A-line for both RF and envelope signals.
| Frame Rate (Hz) | 250 | 83 | 42 | 21 |
|---|---|---|---|---|
| RF nMAE value | 8.4% | 16.3% | 26.3% | 80.5% |
| Envelope nMAE value | 12.7% | 91.6% | 95.3% | 94.5% |
Table 3.
Normalized MAE between estimated and ideal accumulated strain over two cardiac cycles for different final kernel dimensions. The frame rate used was 83Hz for both RF and envelope signals.
| Final kernel dimensions ([wavelengths, A-lines]) | [1,3] | [3,3] | [4,5] | [8,5] |
|---|---|---|---|---|
| RF nMAE value | 16.3% | 15.4% | 14.7% | 12.3% |
| Envelope nMAE value | 91.6% | 89.5% | 90.1% | 89.8% |
Normal Volunteer Study
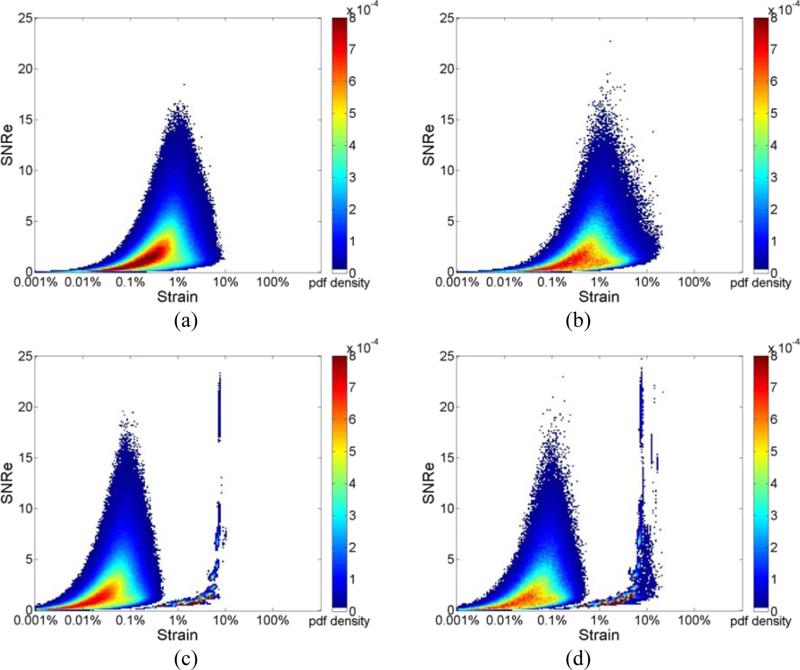
Joint pdf plots of the SNRe for estimated strains from a healthy volunteer at different frame rates are shown in Fig. 7. Figs. 7(a) and (b) present results obtained using RF signals, while Figs. 7(c) and (d) were obtained using envelope signals at frame rates of 34 Hz and 8 Hz respectively. Note that similar to the results presented in Fig. 2 for 3D cardiac simulated data, we observe a unimodal distribution with RF processing, when compared to the bimodal distribution observed with two probability concentration regions at around 0.1% and 5% strain with envelope signals. Note also that for envelope processing, the concentration region for the joint pdf is narrow when compared to that obtained with RF analysis.
Figure 7.
Joint probability density function of the corresponding SNRe of the incremental strain estimated from in vivo data at a frame rate of (a) 34Hz; (b)8Hz for RF signals; (c) 34Hz; (d)8Hz for envelope signals.
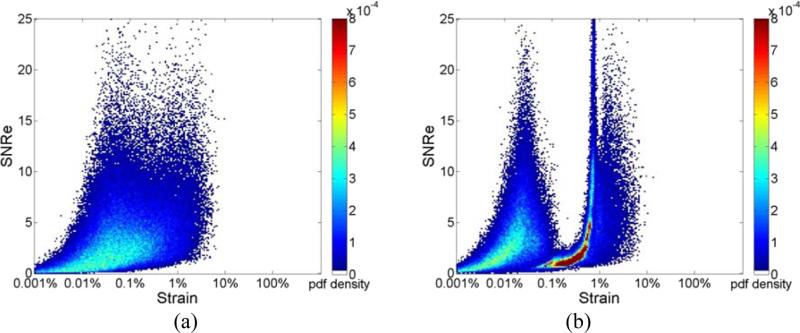
Figure 8 shows the joint pdf plots of the SNRe obtained with a final kernel dimension of 8 λ by 5 A-lines for a frame rate of 34Hz. For both RF and envelope processing, the joint pdf maps generated with larger final kernel dimensions are more distributed as shown in Figs. 8(a) and (b), with the joint pdf even for RF signals slowly deviating to a bimodal distribution.
Figure 8.
Joint probability density function of the corresponding SNRe of the incremental strain from in vivo data at a frame rate of 34 Hz with final processing kernel dimension of 8 λ by 5 A-lines for (a) RF and (b) envelope signals.
In a similar manner, the incremental strain probability distributions for the volunteer data are shown in Fig. 9. Similar to simulation results, no bimodal behavior is observed with RF processing using a 1 λ by 3 A-line final kernel as shown in Fig. 9(a). On the other hand, with envelope processing using the same final kernel dimensions, we observe a bimodal distribution with the lower distribution peak at around 0.1% strain, and the higher peak around 5%. Finally, we present the strain probability distribution obtained with larger final kernel dimensions in Figs. 9(c) and (d) for RF and envelope signals respectively. Note that for processing with RF signals, increasing the final kernel dimension, moves the strain probability distribution obtained towards lower strains as expected, along with a reduction in the percentage of strain values that are accurately estimated. However, a unimodal distribution is preserved in the strain probability distribution obtained using RF signals with the larger final kernel dimensions. On the other hand, the strain probability distribution is always bimodal when envelope signals are used as shown in Fig. 9 (d) with larger final kernel dimensions, with a similar movement in the distribution towards lower strains observed in Fig. 9(c).
Figure 9.
Distribution of strain generated from in vivo data using a 1 λ by 3 A-lines final kernel dimension using (a) RF and (b) envelope signals at different frame rates. The strain probability distribution obtained for different final kernel dimensions at a frame rate of 34 Hz using (c) RF and (d) envelope are also shown.
Variation in the mean accumulated strain curves in segment 1 (Ma and Varghese 2012a) over two cardiac cycles from a 1 cm2 ROI located in the left ventricle were also computed for the volunteer study. Comparisons of strain estimated using RF and envelope signals at different frame rates are plotted in Figs. 10(a) and (b), respectively. For both RF and envelope processing, mean strain curves obtained with the lower frame rate of 8 Hz deviate from results obtained at the higher frame rate. Figures 10(c) and (d) present mean accumulated strain curves generated using different final kernel dimensions. Similar to simulation results, varying the final kernel dimension has little impact on mean accumulated strain curves when comparing the variation of the mean strain estimated over cardiac cycles.
Figure 10.
Regional mean strain plot generated from in vivo data using 1 λ by 3 A-lines final kernel for (a) RF and (b) envelope signals at different frame rates. The strain probability distribution obtained for different final kernel dimensions at a frame rate of 34 Hz using (c) RF and (d) envelope are also shown.
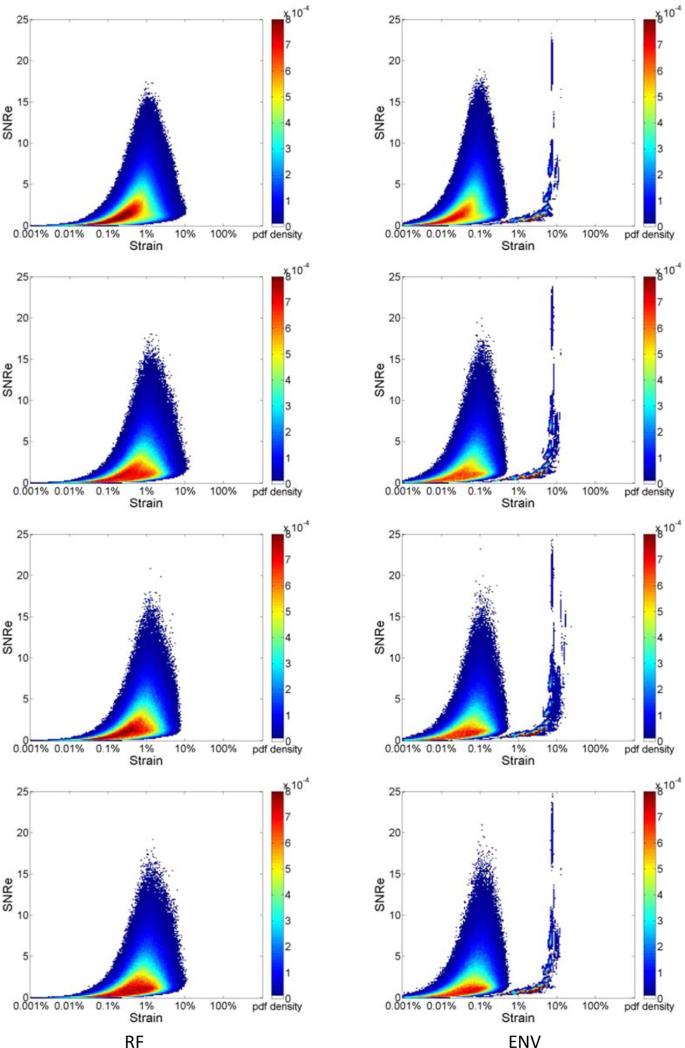
Finally, joint pdf plots of the SNRe from 4 additional healthy volunteers are shown in Fig 11. Incremental strains were estimated at a frame rate of 34 Hz with a 1 λ by 3 A-line final processing kernel. For both RF and envelope signals, we observe very consistent results regarding the shape of the joint pdf maps for the different volunteers. Note that in all cases processing using the RF signals resulted in a unimodal distribution, while processing using envelope signals always resulted in a bimodal strain probability distribution.
Figure 11.
Joint probability density function of the corresponding SNRe, for incremental strain from in vivo data at a frame rate of 34 Hz with a final processing kernel dimension of 1 λ by 3 A-lines for RF (left) and envelope (right) signals from 4 additional healthy volunteers.
Discussion
The FEA canine heart model adapted in this study possesses peak-to-peak accumulated regional strain values of around 12%, as illustrated in Fig 6. This value is within the range of strain values reported in human studies (Leitman et al. 2004; Risum et al. 2012; Takigiku et al. 2012), which typically range from 10% to 75%, probably due to the variability in the measurements made using different equipment and analysis techniques (inter-vendor variability). Results obtained from our cardiac simulation using the FEA model provide the ability to compare results obtained using different processing techniques to the ideal or expected results from the FEA model. In this paper, we demonstrate that incremental displacements and strains estimated using RF signals using a small final processing kernel (1λ by 3 A-lines), provides the closest correspondence to the ideal FEA results. This is illustrated in the joint pdf plots of the SNRe, the strain probability distribution and in the variation of the mean accumulated strain (computed in a larger ROI) over two cardiac cycles. Results obtained demonstrate that analysis of RF signals using small processing kernels produce the expected unimodal joint pdf plots of the SNRe at almost all the frame rates utilized in this study (see Figs 2(a) and (b)). Note that at a 21 Hz frame rate, the strain probability distribution is more spread out than that obtained at higher frame rates, and the corresponding mean accumulated strain curve in Fig. 6(a), fails to track the ideal FEA strain curve.
For strain imaging using envelope signals, bimodal distributions are the norm at all the frame rates used, with an artifactual probability concentration region at high strains (around 5% strain). This behavior is clearly observed for frame rates lower than 83 Hz in Figs. 2(d) and 4(c). For envelope processing with such bimodal behavior in the joint pdf plots of the SNRe, the corresponding accumulated strain curve over a cardiac cycle, fails to track the ideal FEA strain curves. Note that with envelope processing, we obtain good tracking only at the 250 Hz frame rate, where the accumulated strain curve successfully tracks the ideal FEA curve.
Frame rate variation results in the joint pdf plots of the SNRe using volunteer data are similar to that obtained from the 3D cardiac simulation. Joint pdf curves along with the strain probability distribution from RF processing exhibit unimodal behavior as shown in Figs. 7 and 9. Results from envelope processing are always bimodal with two probability concentration regions at around 0.1% and 5% strain (artifactual peak), as illustrated in Figs. 7 and 9. However, unlike the simulation results, the artifactual probability concentration region at 5% strain is narrower and not as well defined. Note that this narrow artifactual region is consistently observed among all the remaining 4 different normal volunteers in Fig 11.
The frame rates at which the strain probability distribution, deviate from the ideal FEA case, and those estimated at higher frame rates, lies around 21 Hz for RF analysis of simulated signals and 8 Hz for the volunteer study respectively, as demonstrated in Fig 6 and Fig 10. When the heart rates are taken into account, these numbers convert to 10.5 frames/cardiac cycle and 9.8 frames/cardiac cycle respectively, which agree with previous results reported from our laboratory on TM phantom studies (Chen et al. 2009). We have also previously reported that when frame rates are lower than 10 times the heart beat, displacement tracking fails to capture finer details in the deformation introduced in the uniformly elastic experimental phantom results (Chen et al. 2009). Note that although the accuracy of mean accumulated strain curves estimated in the volunteers, cannot be conclusively established due to the lack of an ideal accumulated strain curve (as opposed to the ideal FEA results); the fact that the lowest frame rates required for successful strain tracking from simulation, TM phantom and in vivo are very similar cannot be ignored.
Note that the absence of bimodal behavior in the joint pdf does not guarantee strain estimation accuracy. The bimodal behavior of the joint pdf of SNRe and strain indicates the presence of an artifactual peak that is not seen in the ideal joint pdf of the SNRe and strain probability distribution. In this paper, we show similar bimodal patterns as reported by Provost et al. (2012). This indicates the increased probability for erroneous strain estimation with envelope signals, and for RF signals processed with larger kernel dimensions. We have previously reported on the mean and standard deviation variations in the estimated strain and the corresponding SNRe, to demonstrate the accuracy and precision of displacement tracking and strain estimation in uniformly elastic and homogeneous phantoms (Varghese and Ophir 1996; Varghese et al. 1996; Varghese et al. 2001; Chen et al. 2007). The probability density function, on the other hand, is able to depict SNRe and strain in an inhomogeneous medium with large stiffness variations.
Also, in our previous study (Ma and Varghese 2012a), we demonstrated that for RF signals, the reduction in the final processing kernel's axial dimension does not significantly lower SNRe values obtained until it becomes less than one wavelength. Strain estimation using 1λ by 3 A-lines yield relatively accurate results with acceptable noise levels. Note that, this conclusion is also demonstrated in Figs. 6 and 10: where the final kernel dimension change from 8 λ by 3 A-lines to 1λ by 3 A-lines does not appear to have a huge impact on the variation in the mean accumulated strain curves. We recommend the use of the smallest final kernel dimensions possible along with RF processing for improved spatial resolution. On the other hand, the strain probability distribution and the joint pdf plots of the SNRe in Figs. 3 and 8 demonstrate the significant variation in the corresponding distribution with different final kernel dimensions when envelope signals are used. Note that cases where larger final kernel dimensions tend to generate bimodal and distributed distributions were also reported in Provost et al. (2012). They proposed the use of higher frame rates to alleviate this problem by significantly coning down the scanned section, and stitching together multiple small coned regions together to derive high frame rates in the full-frame ultrasound echo signals. The use of smaller final kernel dimensions on the order of 1λ by 3 A-lines as reported in this paper always results in unimodal distributions at currently achievable RF echo signal frame rates in clinical ultrasound systems.
Conclusion
In this paper we explore the characteristics of the joint pdf plots of the SNRe and incremental strain estimated using a multi-level 2-D displacement tracking and strain estimation algorithm. Both 3D FEA based cardiac simulations and RF data from healthy volunteers were evaluated. We utilized different frame rates, final 2D processing kernel dimensions and data types (RF and envelope) for our analysis. The minimum frame rates required for the closest correspondence to the ideal FEA results, of the joint pdf and strain probability distribution were 42Hz for RF signals and 250Hz for envelope signals from simulations. For the volunteer study, we settled on the 17 Hz frame rate for both RF and envelope signals where significant deviations from data acquired at the highest frame rate was not observed.
We demonstrate in this paper that RF frame rates currently achievable on clinical cardiac ultrasound systems are sufficient for the analysis of strain probability distributions, using our multi-level 2-D displacement tracking and strain estimation using final kernel dimensions on the order of 1 λ by 3 A-lines. We also show that larger 2D processing kernel dimensions can have deleterious effects on the joint pdf of the SNRe and the strain probability distribution by deviating towards artifactual and erroneous bimodal distributions even when processing RF signals. In addition, we also showed using the 3D cardiac simulation model that use of significantly higher frame rates, will move the strain probability distribution towards lower strains in the RF echo signals which may then necessitate the use of larger 2D processing kernel dimensions for accurate tracking, which would significantly reduce the spatial resolution in the strain images (Varghese et al. 1998).
The results presented in this paper also demonstrate the estimation of artifactual and erroneous strain probability distributions with the use of envelope signals for all the kernel dimensions evaluated in this paper. Processing envelope signals produce bimodal distribution both for the joint pdf plots of the SNRe and strain probability distribution for all the 2D final kernel dimensions used for processing the echo signals.
Acknowledgements
This work is supported in part by NIH grant 5R21EB010098-02 and R01 CA112192-06. The authors gratefully acknowledge the use of the cardiac mechanics model from the Cardiac Mechanics Research Group at UCSD.
Footnotes
Publisher's Disclaimer: This is a PDF file of an unedited manuscript that has been accepted for publication. As a service to our customers we are providing this early version of the manuscript. The manuscript will undergo copyediting, typesetting, and review of the resulting proof before it is published in its final citable form. Please note that during the production process errors may be discovered which could affect the content, and all legal disclaimers that apply to the journal pertain.
References
- Alam SK, Ophir J. On the use of envelope and rf signal decorrelation as tissue strain estimators. Ultrasound in Medicine and Biology. 1997;23:1427–33. doi: 10.1016/s0301-5629(97)00186-5. [DOI] [PubMed] [Google Scholar]
- Bilgen M, Insana MF. Error analysis in acoustic elastography. II. Strain estimation and SNR analysis. J Acoust Soc Am. 1997;101:1147–54. doi: 10.1121/1.418019. [DOI] [PubMed] [Google Scholar]
- Bouchard RR, Hsu SJ, Palmeri ML, Rouze NC, Nightingale KR, Trahey GE. Acoustic radiation force-driven assessment of myocardial elasticity using the displacement ratio rate (DRR) method. Ultrasound Med Biol. 2011;37:1087–100. doi: 10.1016/j.ultrasmedbio.2011.04.005. [DOI] [PMC free article] [PubMed] [Google Scholar]
- Cespedes I, Ophir J, Ponnekanti H, Maklad N. Elastography: elasticity imaging using ultrasound with application to muscle and breast in vivo. Ultrason Imaging. 1993;15:73–88. doi: 10.1177/016173469301500201. [DOI] [PubMed] [Google Scholar]
- Chen H, Shi H, Varghese T. Improvement of elastographic displacement estimation using a two-step cross-correlation method. Ultrasound Med Biol. 2007;33:48–56. doi: 10.1016/j.ultrasmedbio.2006.07.022. [DOI] [PMC free article] [PubMed] [Google Scholar]
- Chen H, Varghese T. Multilevel hybrid 2D strain imaging algorithm for ultrasound sector/phased arrays. Med Phys. 2009;36:2098–106. doi: 10.1118/1.3121426. [DOI] [PMC free article] [PubMed] [Google Scholar]
- Chen H, Varghese T. Three-dimensional canine heart model for cardiac elastography. Med Phys. 2010;37:5876–86. doi: 10.1118/1.3496326. [DOI] [PMC free article] [PubMed] [Google Scholar]
- Chen H, Varghese T, Rahko PS, Zagzebski JA. Ultrasound frame rate requirements for cardiac elastography: experimental and in vivo results. Ultrasonics. 2009;49:98–111. doi: 10.1016/j.ultras.2008.05.007. [DOI] [PubMed] [Google Scholar]
- D'Hooge J, Heimdal A, Jamal F, Kukulski T, Bijnens B, Rademakers F, Hatle L, Suetens P, Sutherland GR. Regional strain and strain rate measurements by cardiac ultrasound: principles, implementation and limitations. Eur J Echocardiogr. 2000;1:154–70. doi: 10.1053/euje.2000.0031. [DOI] [PubMed] [Google Scholar]
- Garra BS, Cespedes EI, Ophir J, Spratt SR, Zuurbier RA, Magnant CM, Pennanen MF. Elastography of breast lesions: initial clinical results. Radiology. 1997;202:79–86. doi: 10.1148/radiology.202.1.8988195. [DOI] [PubMed] [Google Scholar]
- Geyer Assessment of Myocardial Mechanics Using Speckle Tracking Echocardiography: Fundamentals and Clinical Applications (vol 23, pg 351, 2010). J Am Soc Echocardiog. 2010;23:734. doi: 10.1016/j.echo.2010.02.015. [DOI] [PubMed] [Google Scholar]
- Hall TJ, Zhu Y, Spalding CS. In vivo real-time freehand palpation imaging. Ultrasound Med Biol. 2003;29:427–35. doi: 10.1016/s0301-5629(02)00733-0. [DOI] [PubMed] [Google Scholar]
- Hsu SJ, Byram BC, Bouchard RR, Dumont DM, Wolf PD, Trahey GE. Acoustic radiation force impulse imaging of mechanical stiffness propagation in myocardial tissue. Ultrason Imaging. 2012;34:142–58. doi: 10.1177/0161734612456580. [DOI] [PMC free article] [PubMed] [Google Scholar]
- Insana MF, Cook LT, Bilgen M, Chaturvedi P, Zhu Y. Maximum-likelihood approach to strain imaging using ultrasound. Journal of the Acoustical Society of America. 2000;107:1421–34. doi: 10.1121/1.428429. [DOI] [PMC free article] [PubMed] [Google Scholar]
- Jia C, Olafsson R, Kim K, Kolias TJ, Rubin JM, Weitzel WF, Witte RS, Huang SW, Richards MS, Deng CX, O'Donnell M. Two-dimensional strain imaging of controlled rabbit hearts. Ultrasound Med Biol. 2009;35:1488–501. doi: 10.1016/j.ultrasmedbio.2009.04.007. [DOI] [PMC free article] [PubMed] [Google Scholar]
- Kallel F, Ophir J. A least-squares strain estimator for elastography. Ultrason Imaging. 1997;19:195–208. doi: 10.1177/016173469701900303. [DOI] [PubMed] [Google Scholar]
- Konofagou EE, D'Hooge J, Ophir J. Myocardial elastography--a feasibility study in vivo. Ultrasound Med Biol. 2002;28:475–82. doi: 10.1016/s0301-5629(02)00488-x. [DOI] [PubMed] [Google Scholar]
- Krouskop TA, Dougherty DR, Vinson FS. A pulsed Doppler ultrasonic system for making noninvasive measurements of the mechanical properties of soft tissue. Journal of Rehabilitation Research & Development. 1987;24:1–8. [PubMed] [Google Scholar]
- Langeland S, D'Hooge J, Wouters PF, Leather HA, Claus P, Bijnens B, Sutherland GR. Experimental validation of a new ultrasound method for the simultaneous assessment of radial and longitudinal myocardial deformation independent of insonation angle. Circulation. 2005;112:2157–62. doi: 10.1161/CIRCULATIONAHA.105.554006. [DOI] [PubMed] [Google Scholar]
- Leitman M, Lysyansky P, Sidenko S, Shir V, Peleg E, Binenbaum M, Kaluski E, Krakover R, Vered Z. Two-dimensional strain-a novel software for real-time quantitative echocardiographic assessment of myocardial function. J Am Soc Echocardiogr. 2004;17:1021–9. doi: 10.1016/j.echo.2004.06.019. [DOI] [PubMed] [Google Scholar]
- Li Y, Zagzebski JA. A frequency domain model for generating B-mode images with array transducers. IEEE Trans Ultrason Ferroelectr Freq Control. 1999;46:690–9. doi: 10.1109/58.764855. [DOI] [PubMed] [Google Scholar]
- Lopata RG, Nillesen MM, Verrijp CN, Singh SK, Lammens MM, van der Laak JA, van Wetten HB, Thijssen JM, Kapusta L, de Korte CL. Cardiac biplane strain imaging: initial in vivo experience. Phys Med Biol. 2010;55:963–79. doi: 10.1088/0031-9155/55/4/004. [DOI] [PubMed] [Google Scholar]
- Ma C, Varghese T. Comparison of cardiac displacement and strain imaging using ultrasound radiofrequency and envelope signals. Ultrasonics. 2012a doi: 10.1016/j.ultras.2012.11.005. [DOI] [PMC free article] [PubMed] [Google Scholar]
- Ma C, Varghese T. Lagrangian displacement tracking using a polar grid between endocardial and epicardial contours for cardiac strain imaging. Med Phys. 2012b;39:1779–92. doi: 10.1118/1.3691905. [DOI] [PMC free article] [PubMed] [Google Scholar]
- Nightingale K, Scott Soo M, Nightingale R, Trahey G. Acoustic radiation force impulse imaging: in vivo demonstration of clinical feasibility. Ultrasound in Medicine and Biology. 2002;28:227–35. doi: 10.1016/s0301-5629(01)00499-9. [DOI] [PubMed] [Google Scholar]
- O'Donnell M, Skovoroda AR, Shapo BM, Emelianov SY. Internal displacement and strain imaging using ultrasonic speckle tracking. IEEE Trans Ultrason Ferroel Freq Cont. 1994;41:314–25. [Google Scholar]
- Odonnell M, Skovoroda AR, Shapo BM, Emelianov SY. Internal Displacement and Strain Imaging Using Ultrasonic Speckle Tracking. Ieee T Ultrason Ferr. 1994;41:314–25. [Google Scholar]
- Ophir J, Cespedes I, Ponnekanti H, Yazdi Y, Li X. Elastography: a quantitative method for imaging the elasticity of biological tissues. Ultrason Imaging. 1991a;13:111–34. doi: 10.1177/016173469101300201. [DOI] [PubMed] [Google Scholar]
- Ophir J, Cespedes I, Ponnekanti H, Yazdi Y, Li X. Elastography: a quantitative method for imaging the elasticity of biological tissues. Ultrasonic Imaging. 1991b;13:111–34. doi: 10.1177/016173469101300201. [DOI] [PubMed] [Google Scholar]
- Parker KJ, Huang SR, Musulin RA, Lerner RM. Tissue response to mechanical vibrations for ‘sonoelasticity imaging’. Ultrasound Med Biol. 1990;16:241–6. doi: 10.1016/0301-5629(90)90003-u. [DOI] [PubMed] [Google Scholar]
- Provost J, Thiebaut S, Luo J, Konofagou EE. Single-heartbeat electromechanical wave imaging with optimal strain estimation using temporally unequispaced acquisition sequences. Phys Med Biol. 2012;57:1095–112. doi: 10.1088/0031-9155/57/4/1095. [DOI] [PMC free article] [PubMed] [Google Scholar]
- Risum N, Ali S, Olsen NT, Jons C, Khouri MG, Lauridsen TK, Samad Z, Velazquez EJ, Sogaard P, Kisslo J. Variability of global left ventricular deformation analysis using vendor dependent and independent two-dimensional speckle-tracking software in adults. J Am Soc Echocardiogr. 2012;25:1195–203. doi: 10.1016/j.echo.2012.08.007. [DOI] [PubMed] [Google Scholar]
- Shi HR, Varghese T. Two-dimensional multi-level strain estimation for discontinuous tissue. Physics in Medicine and Biology. 2007;52:389–401. doi: 10.1088/0031-9155/52/2/006. [DOI] [PubMed] [Google Scholar]
- Takigiku K, Takeuchi M, Izumi C, Yuda S, Sakata K, Ohte N, Tanabe K, Nakatani S. Normal range of left ventricular 2-dimensional strain: Japanese Ultrasound Speckle Tracking of the Left Ventricle (JUSTICE) study. Circ J. 2012;76:2623–32. doi: 10.1253/circj.cj-12-0264. [DOI] [PubMed] [Google Scholar]
- Talhami HE, Wilson LS, Neale ML. Spectral tissue strain: a new technique for imaging tissue strain using intravascular ultrasound. Ultrasound Med Biol. 1994;20:759–72. doi: 10.1016/0301-5629(94)90033-7. [DOI] [PubMed] [Google Scholar]
- van der Steen AF, de Korte CL, Cespedes EI. Intravascular ultrasound elastography. Ultraschall Med. 1998;19:196–201. doi: 10.1055/s-2007-1000491. [DOI] [PubMed] [Google Scholar]
- Varghese T. Quasi-Static Ultrasound Elastography. Ultrasound Clin. 2009;4:323–38. doi: 10.1016/j.cult.2009.10.009. [DOI] [PMC free article] [PubMed] [Google Scholar]
- Varghese T, Bilgen M, Ophir J. Multiresolution imaging in elastography. IEEE Trans Ultrason Ferroelectr Freq Control. 1998;45:65–75. doi: 10.1109/58.646912. [DOI] [PubMed] [Google Scholar]
- Varghese T, J O, Konofagou EE, Kallel F, Righetti R. Tradeoffs in elastographic imaging. Ultrasonic Imaging. 2001;23:216–48. doi: 10.1177/016173460102300402. [DOI] [PubMed] [Google Scholar]
- Varghese T, Ophir J. Performance optimization in elastography: multicompression with temporal stretching. Ultrasonic Imaging. 1996;18:193–214. doi: 10.1177/016173469601800303. [DOI] [PubMed] [Google Scholar]
- Varghese T, Ophir J. A theoretical framework for performance characterization of elastography: the strain filter. IEEE Trans Ultrason Ferroelectr Freq Control. 1997;44:164–72. doi: 10.1109/58.585212. [DOI] [PubMed] [Google Scholar]
- Varghese T, Ophir J. Characterization of elastographic noise using the envelope of echo signals. Ultrasound Med Biol. 1998;24:543–55. doi: 10.1016/s0301-5629(98)00008-8. [DOI] [PubMed] [Google Scholar]
- Varghese T, Ophir J. A method for experimental characterization of the noise performance of elastographic systems. Ultrasonic Imaging. 1999;21:17–30. doi: 10.1177/016173469902100102. [DOI] [PubMed] [Google Scholar]
- Varghese T, Ophir J, Cespedes I. Noise reduction in elastograms using temporal stretching with multicompression averaging. Ultrasound Med Biol. 1996;22:1043–52. doi: 10.1016/s0301-5629(96)00128-7. [DOI] [PubMed] [Google Scholar]
- Varghese T, Zagzebski JA, Rahko P, Breburda CS. Ultrasonic imaging of myocardial strain using cardiac elastography. Ultrason Imaging. 2003;25:1–16. doi: 10.1177/016173460302500101. [DOI] [PubMed] [Google Scholar]
- Wilson LS, Robinson DE. Ultrasonic measurement of small displacements and deformations of tissue. Ultrasonic Imaging. 1982;4:71–82. doi: 10.1177/016173468200400105. [DOI] [PubMed] [Google Scholar]


