

Abstract
The traditional de novo drug discovery is known as a high cost and high risk process. In response, recently there is an increasing interest in discovering new indications for known drugs—a process known as drug repositioning—using computational methods. In this study, we present a new systematic approach for identifying potential new indications of an existing drug through its relation to similar drugs. Different from the previous similarity-based methods, we adapted a novel bipartite-graph based method when considering common drug targets and their interaction information. Furthermore, we added drug structure information into the calculation of drug pairwise similarity. In cross-validation experiments, our method achieved a sensitivity of 0.77 and specificity of 0.92 (AUC = 0.888) and compared favorably to the state of the art. When compared with a control group of drug uses, our drug repositioning results were found to be significantly enriched in both the biomedical literature and clinical trials. Our results indicate that combining chemical structure and drug target information results in better prediction performance and that the proposed approach successfully captures the implicit information between drug targets.
Keywords: drug repositioning, bipartite graph, target similarity, chemical similarity, target interaction
I. Introduction
In response to the high cost and risk in traditional de novo drug discovery [1], discovering potential new uses for existing drugs, also known as drug repositioning, has attracted increasing interests from both the pharmaceutical industry and research community. Nowadays, the advances in molecular measurements laid a foundation for a surging domain—computational drug repositioning [2]. For instance, with the availability of the Connectivity Map (CMap) [3], a comprehensive reference collection of ranked gene expression profiles produced by different drug candidates, several approaches have been developed to leverage such drug molecular information. Iorio et al. used gene expression profiles of drugs in the CMap to compute drug pairwise similarity [4] and the resulting drug-drug network to explore repositioning opportunities for known drugs. Hu et al. compared the gene expression profiles of drugs with those of diseases and identified the correlation/anti-correlation between drugs and diseases [5]. They further showed that the anti-correlation relationships in the resulting disease-drug network can suggest new therapeutic uses for existing drugs. In addition to the genomic data, other drug-related information has also been investigated in similarity-based approaches, which assume that similar drugs are indicated for similar diseases. For instance, Campillos et al. used drug adverse effects to identify novel drug-target relationships (off-target interactions) which further connected drugs to new uses [6]. Li et al. integrated disease, gene/protein and drug connectivity information based on protein interaction networks and literature mining [7]. More recently, Chiang et al. presented a ‘Guilt by Association’ (GBA) approach to predict novel drug uses based on the known treatment relationships between drugs and diseases [8]. In this study, we implemented the GBA method and used it for comparison.
In this study, we proposed a new systematic method to identify a drug's potential new uses through its similar drugs found. Different from other similarity-based methods, we adapted a novel bipartite-graph based method when considering common drug target proteins and their interaction information. By applying it to our data, we were able to boost target similarity by making use of their corresponding interaction information and to obtain target similarity scores for drug pairs in cases where no common targets can be found.
II. Methods
In this study, we identify a target drug dx's potential new indications through its similar drugs (e.g., dy) as follows:
If two drugs dx and dy are found to be similar, and dy is used for treating disease s, then dx is a repositioning candidate for disease s treatment.
When computing pairwise similarity between a drug pair dx and dy, we combine the similarities of their chemical structures SIMchem(dx, dy) and target profiles SIMtarget(dx, dy).
A. Computing Similarity of Drug Chemical Structures
For each drug pair, we compute the chemical structure similarity SIMchem(dx, dy) as the Tanimoto coefficient of their 2D chemical fingerprints f(dx) and f(dy):
| (1) |
Where, |f(dx)| and |f(dy)| are the count of structure fragments drugs dx and dy respectively. The dot product f(dx)•f(dy) represents the number of structure fragments shared by two drugs.
B. Computing Similarity of Drug Target Profiles
We represent the relationships between drugs and their target proteins as a bipartite graph G(V, E) for computing SIMtarget(dx, dy). The node set, V(G)={D, P}, consists of two types of object (i.e., the drug set D and protein set P). The edge set, E(G) ⊆ D×P, consists of relationships between drugs and their target proteins. Fig 1(A) shows an example bipartite graph, where there are four drugs D={d1, d2, d3, d4}, two proteins P={p1, p2}, and five links (proteins p1 and p2 are the targets of drugs {d1, d2} and {d2, d3, d4} respectively). Given a drug d, we represent its target protein set as P(d). In this example, P(d1)={p1}, P(d2)={p1, p2}, P(d3)={p2}, and P(d4)={p2}. Likewise, we represent a protein's linked drug set as D(p). For instance, D(p1)={d1, d2}. Based on this bipartite graph, many methods can be applied to compute SIMtarget(dx, dy). Perhaps the most straightforward approach is to simply count the number of common proteins shared by two drugs i.e., . As shown in Fig 1(B), drug pairs are only connected if they share common target proteins. This is not ideal because no target protein stands alone in biological systems. With an aim to capture the interactions between target proteins, we derived a graph model G2 [9] from the bipartite graph G(V, E), as shown in Fig 1(C). Where, the nodes in G2 are all the possible combinations of drug pairs and protein pairs V2={D2,P2}={D×D, P×P}. Let R(dx, dy) and R(pa, pb) denote similarity of drug pairs and protein pair respectively. For self-pairs such as {d1, d1} and {p1, p1}, their similarity scores are set to be 1. The edges between drug and protein pairs in G2 are built based on the drug-protein connections in the original bipartite graph G. For instant, an edge is established in G2 between a drug pair {d1, d2} and protein pair {p1, p2} because there exist edges <d1, p1> and <d2, p2> in G.
Figure 1.

Models for computing drug pairwise similarity.
Given the G2 graph model, we can iteratively compute the pairwise similarity of drug pairs R2k+1(dx, dy) and protein pairs R2k+2(pa, pb) as follows:
| (2) |
As can be seen in equation (2), the drug pairwise similarity R2k+1(dx, dy) is the average similarity of protein pairs they connected to in the G2 graph. In turn, the protein pairwise similarity R2k+2(pa , pb) also depends on the drug pairwise similarities. The iterative calculation is initialized with the protein pairwise similarity R0(pa , pb) as follows:
| (3) |
In theory, the similarity of drug target profiles should be calculated as:
| (4) |
It has been reported that the similarity score is rapidly converged, with relative rankings stabilizing within a fixed number of iterations to perform [9]. We have the same observation on our large-scale real-world data (see the Result section for details).
C. Computing Drug Pairwise Similarity
The final drug pairwise similarity SIM(dx, dy) score is derived by summing up the weighted chemical similarity and target similarity as shown in equation (5), which readily integrates drug chemical structure, drug target and target interaction in one score ranging from 0 to 1.
| (5) |
Where, λ (0<λ<1) is a predefined constant for weighting the target similarity.
III. Results and Discussion
A. Experimental Data
1) Approved Drug List and Target Protein Information
From DrugBank [10], a widely used public database of drug data, we collected 1007 approved small-molecule drugs with their corresponding target protein information.
2) Drug-Disease Treatment Relationships
From the National Drug File - Reference Terminology (NDF-RT) [11], we extracted therapeutic uses for 799 drugs out of the 1007 drugs, which constructed a gold standard set of 3250 treatment relationships between 799 drugs and 719 diseases.
3) Protein-protein Interactions
From the Human Protein Reference Database (HPRD) [12], we collected 39,240 binary interactions between 9673 human proteins.
B. Test of Our Method Assumption
In this study, we built our method on the basis that similar drugs are indicated for similar diseases and conditions. To confirm this, we compared the computed pairwise similarities of 4066 drug pairs involved in treating cardiovascular diseases (e.g., both ‘Doxazosin’ and ‘Terazosin’ are known to treat hypertension) against 4,000 randomly selected drug pairs. As expected, the drug pairs with similar therapeutic uses have significantly higher chemical and target similarities (t-test P value < 2.2×10⁻¹⁶).
C. Leave-One-Out Cross Validation
To assess our method in predicting novel indications, we conducted cross-validation experiments in which we used the known treatment relationships between drugs and diseases as the gold standard. Specifically, for each target drug, we removed its known uses and attempted to recover them through its top N similar drugs found. For instance, ‘Fluoxetine’ is a drug known to treat 4 different diseases ‘Bulimia’, ‘Depressive Disorder’, ‘Obsessive-Compulsive Disorder’, and ‘Panic Disorder’ in our gold standard. Table I shows its top 3 most similar drugs found by our method. To measure our prediction performance, we report sensitivity, specificity and positive predictive value (PPV) in this work. In the ‘Fluoxetine’ example in Table I (B), the corresponding values for the three metrics are 0.5, 0.99 and 0.33 respectively when only considering the first returned drug, and the performance increase to 0.75, 0.99 and 0.43 when the top 2 drugs are considered.
TABLE I.
Top 3 Drugs Simialr with ‘Fluoxetine’
| (A) | ||
|---|---|---|
| Given drug | Chemical Structure | Target |
| Fluoxetine |
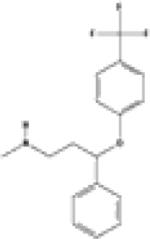
|
P28223 (5-hydroxytryptamine 2A receptor) P31645 (Sodium-dependent serotonin transporter) |
| (B) | ||||
|---|---|---|---|---|
| Similar Drug (SIM) | Drug Chemical Structure (SIMchem) | Drug Targe (SIMtarget) | Original Use | |
| 1 | Citalopram SIM=0.556 |
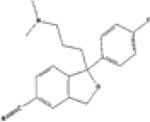 SIMchem=0.66 |
P31645 SIMtarge=0.53 |
•Alcoholism •Depressive Disorder •Diabetic Neuropathies •Obsessive-Compulsive Disorder •Tobacco Use Disorder •Dementia |
| 2 | Fluvoxamine SIM=0.542 |
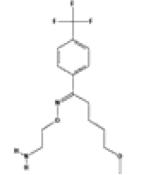 SIMchem=0.59 |
P31645 SIMtarge=0.53 |
•Depressive Disorder •Obsessive-Compulsive Disorder •Panic Disorder |
| 3 | Cyclobenzaprine SIM=0.532 |
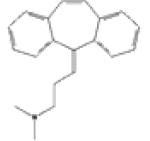 SIMchem=0.54 |
P28223 SIMtarge=0.53 |
•Myositis •Muscle Rigidity •Pain •Spasm •Muscle Cramp •Muscle Spasticity •Tetanus |
To show the performance over the entire dataset of 799 drugs, we calculated overall sensitivity and specificity tradeoffs for different drug pair-wise similarity calculation by varying N—the number of similar drugs—from 1 to 798. The area under the ROC curve (AUC) score was used as the evaluation metric.
1) Comparison of Three Different Ways of Computing Target Similarity
(a) the number of overlapping target proteins (|P(dx, dy)|); (b) Pearson's correlation of drug targets (Pearson); and (c) drug target similarity using the our G2 method with iterations varying from R1 to R9 (see Fig 2). As can be seen, our G2 method achieved stable performance after 3-5 iterations as the result of the rapid convergence of drug pairwise similarity and stabilized relative ranking. Hereafter, we set SIMtarget to be R5(dx, dy).
Figure 2.

Comparison of different target similarity calculation methods.
Using target similarity alone, our G2 method achieved higher AUC score (0.876) than using Pearson's correlation (0.842) or simply counting the overlap (0.838). This indicates that our method is able to better capture interactions between target proteins through iteratively propagating similarities from protein pairs to drug pairs, and vice versa.
2) Combination of Chemical Similarity and Target Similarity
We assessed the performance of combining target similarity (R5(dx, dy)) with chemical similarity. By experimenting with different values (from 0 to 1) of the weight parameter λ in equation 5, we observed the highest performance (AUC=0.888) when λ = 0.8. This confirmed our hypothesis that the two similarities can complement each other in identifying similar drugs. We show in Fig 3 the overall performance of our method with respect to the number of top-ranked similar drugs returned in a ROC curve. As highlighted in Fig 3, when N (the number of most similar drugs returned) was 20, our method achieved a specificity of 0.92 and sensitivity of 0.77.
Figure 3.

ROC curve of our method with combining SIMchem and SIMtarget with respect to different N (iteration R5(dx, dy), weight λ = 0.8)
3) Comparison with the state of the art
We implemented the guilt-by-association (GBA) approach [8] and evaluated it on our data. As shown in Fig 3, the GBA approach yielded a specificity of 0.85 and sensitivity of 0.74, which is below the ROC curve of our method. Not only does our method outperform the GBA approach, it is also able to rank its prediction results (the GBA approach cannot), an important feature for prioritizing drug repositioning candidates in practice.
D. Analysis of Novel Predictions in Clinical Trials and the Biomedical Literature
In addition to cross validation, we further evaluated the validity of our novel drug use prediction by searching the predicted drug-disease pairs against the trials in ClinicalTrials.gov and scientific abstracts in PubMed. Take the drug ‘Fluoxetine’ for example (see Table I). As stated above, our method would predict 6 indications based on its most similar drug ‘Citalopram’. Two of the predicted uses are known uses, thus leaving the other 4 as novel predictions. When searching for their evidence, we found that the ‘Alcoholism’ use is indicated in a clinical trial (NCT00027378) which was conducted to study Fluoxetine in treatment adolescents with alcohol use disorder and major depression and that the other three uses have been investigated with study results published in the literature [13-15].
When setting λ = 0.8 and N = 20 (best performance obtained in cross-validation experiments), our method predicted 30,872 novel indications for the 1,007 drugs. 1,340 of these predictions can be found in clinical trials. As a matter of fact, it is 5 times more likely for our predicted uses to be found in a trial than those drug uses not predicted by our method (Chi2 test P value < 2.2×10⁻¹⁶). In addition, 8,564 (~30%) of the predicted novel uses can be found in the literature. Hence, we conclude that the novel uses predicted by our method are significantly enriched in both scientific literature and clinical trials.
IV. Conclusions and future work
Computational drug repositioning offers promise for discovering new uses of existing drugs, as drug related molecular, chemical, and clinical information has increased over the past decade and become broadly accessible. In this study, we developed a systematic method for mining potential new drug indications by exploring both chemical and molecular features in similar drugs. The proposed bipartite graph model successfully boosted target similarity by iteratively integrating explicit evidence (common target proteins shared by drugs) and implicit evidence (common drugs shared by target proteins).
Our method has some limitations. First, our method relies on existing knowledge of drugs, targets, protein interactions. The incompleteness of such information would limit our prediction power. Second, our method would fail to identify any reusable drugs for a disease if no current treatment is available for that disease. This is because our predicted indications are based on the known uses of other drugs. Lastly, in this work we limit our method to only the approved small molecules with known target proteins. This would exclude some drugs which is not a small molecular (e.g., Rituximab) or whose protein targets are not known yet (e.g., Mannitol). We plan to investigate these issues in future.
Acknowledgment
This research was supported by the Intramural Research Program of the National Institutes of Health, National Library of Medicine. The authors would like to thank Profs. Xiaoyan Zhu and Jake Chen for their valuable discussion at the beginning of this work, and thank Dr. W. John Wilbur for his helpful comments and proofreading.
References
- 1.Ashburn TT, Thor KB. Drug repositioning: identifying and developing new uses for existing drugs. Nat Rev Drug Discov. 2004;3(8):673–83. doi: 10.1038/nrd1468. [DOI] [PubMed] [Google Scholar]
- 2.Shaughnessy AF. Old drugs, new tricks. BMJ. 2011;342:d741. doi: 10.1136/bmj.d741. [DOI] [PubMed] [Google Scholar]
- 3.Lamb J, Crawford ED, Peck D, et al. The Connectivity Map: using gene-expression signatures to connect small molecules, genes, and disease. Science. 2006;313(5795):1929–1935. doi: 10.1126/science.1132939. [DOI] [PubMed] [Google Scholar]
- 4.Iorio F, Bosotti R, Scacheri E, et al. Discovery of drug mode of action and drug repositioning from transcriptional responses. Proc Natl Acad Sci U S A. 2010;107(33):14621–6. doi: 10.1073/pnas.1000138107. [DOI] [PMC free article] [PubMed] [Google Scholar]
- 5.Hu G, Agarwal P. Human disease-drug network based on genomic expression profiles. PLoS One. 2009;4(8):e6536. doi: 10.1371/journal.pone.0006536. [DOI] [PMC free article] [PubMed] [Google Scholar]
- 6.Campillos M, Kuhn M, Gavin AC, et al. Drug target identification using side-effect similarity. Science. 2008;321(5886):263–6. doi: 10.1126/science.1158140. [DOI] [PubMed] [Google Scholar]
- 7.Li J, Zhu X, Chen JY. Building disease-specific drug-protein connectivity maps from molecular interaction networks and PubMed abstracts. PLoS Comput Biol. 2009;5(7):e1000450. doi: 10.1371/journal.pcbi.1000450. [DOI] [PMC free article] [PubMed] [Google Scholar]
- 8.Chiang AP, Butte AJ. Systematic evaluation of drug-disease relationships to identify leads for novel drug uses. Clin Pharmacol Ther. 2009;86(5):507–10. doi: 10.1038/clpt.2009.103. [DOI] [PMC free article] [PubMed] [Google Scholar]
- 9.Jeh G, Widom J. SimRank: a measure of structural-context similarity. Proceedings of the eighth ACM SIGKDD international conference on Knowledge discovery and data mining. 2002:538–543. [Google Scholar]
- 10.Wishart DS, Knox C, Guo AC, et al. DrugBank: a knowledgebase for drugs, drug actions and drug targets. Nucleic Acids Res. 2008;36(Database issue):D901–6. doi: 10.1093/nar/gkm958. [DOI] [PMC free article] [PubMed] [Google Scholar]
- 11.National Drug File - Reference Terminology (NDF-RT) http://www.nlm.nih.gov/research/umls/sourcereleasedocs/current/NDFRT/
- 12.Keshava Prasad TS, Goel R, Kandasamy K, et al. Human Protein Reference Database--2009 update. Nucleic Acids Res. 2009;37(Database issue):D767–72. doi: 10.1093/nar/gkn892. [DOI] [PMC free article] [PubMed] [Google Scholar]
- 13.Max MB, Lynch SA, Muir J, et al. Effects of desipramine, amitriptyline, and fluoxetine on pain in diabetic neuropathy. N Engl J Med. 1992;326(19):1250–6. doi: 10.1056/NEJM199205073261904. [DOI] [PubMed] [Google Scholar]
- 14.Saules KK, Schuh LM, Arfken CL, et al. Double-blind placebo-controlled trial of fluoxetine in smoking cessation treatment including nicotine patch and cognitive-behavioral group therapy. Am J Addict. 2004;13(5):438–46. doi: 10.1080/10550490490512762. [DOI] [PubMed] [Google Scholar]
- 15.Mowla A, Mosavinasab M, Haghshenas H, et al. Does serotonin augmentation have any effect on cognition and activities of daily living in Alzheimer's dementia? A double-blind, placebo-controlled clinical trial. J Clin Psychopharmacol. 2007;27(5):484–7. doi: 10.1097/jcp.0b013e31814b98c1. [DOI] [PubMed] [Google Scholar]