Abstract
This work focuses on the accuracy of the mode content measurements in an overmoded corrugated waveguide using measured radiated field patterns. Experimental results were obtained at 250 GHz using a vector network analyzer with over 70 dB of dynamic range. The intensity and phase profiles of the fields radiated from the end of the 19 mm diameter helically tapped brass waveguide were measured on planes at 7, 10, and 13 cm from the waveguide end. The measured fields were back propagated to the waveguide aperture to provide three independent estimates of the field at the waveguide exit aperture. Projecting that field onto the modes of the guide determined the waveguide mode content. The three independent mode content estimates were found to agree with one another to an accuracy of better than ±0.3%. These direct determinations of the mode content were compared with indirect measurements using the experimentally measured amplitude in three planes, with the phase determined by a phase retrieval algorithm. The phase retrieval technique using the planes at 7, 10, and 13 cm yielded a mode content estimate in excellent agreement, within 0.3%, of the direct measurements. Phase retrieval results using planes at 10, 20, and 30 cm were less accurate due to truncation of the measurement in the transverse plane. The reported measurements benefited greatly from a precise mechanical alignment of the scanner with respect to the waveguide axis. These results will help to understand the accuracy of mode content measurements made directly in cold test and indirectly in hot test using the phase retrieval technique.
Index Terms: Corrugated waveguide, gyrotron, vector network analyzer (VNA), waveguide mode decomposition and phase retrieval
I. Introduction
Corrugated waveguides are used as transmission lines to transmit high-power microwaves for various applications, e.g., electron cyclotron resonance heating (ECRH) of fusion plasmas [1], plasma diagnostics [2], radar, materials heating, and dynamic nuclear polarization (DNP) nuclear magnetic resonance (NMR) spectroscopy [3], etc. The power is transferred by coupling the output microwave beam from a gyrotron to the fundamental HE11 mode of an overmoded corrugated waveguide. The linear polarization of the HE11 mode and its field vanishing at the waveguide boundary provide the maximum coupling to the free space microwave beam which in turn maximizes the power transmission efficiency through the corrugated transmission lines [4]–[6]. The transmission losses due to ohmic losses and higher order modes must be estimated correctly for optimizing the performance of different components which are part of the whole transmission system, e.g., mirrors and polarizers at the miter bends [7]. Though corrugated waveguide transmission lines have low loss, higher order modes and alignment are still a big concern in the ECRH transmission lines of a tokamak where several tens of meters of corrugated waveguide are used for megawatt level power transmission from a gyrotron to the plasma [8]–[10]. Recent developments in high field NMR spectroscopy require the transmission of high power at higher frequencies, extending to the terahertz (THz) band [11]–[16]. In DNP-NMR experiments, the gyrotron and NMR magnets are placed far apart to avoid interference. This increases the length of the transmission line required to transfer the microwave power to the NMR sample. This arrangement is done via a probe assembly consisting of several tapers and miter bend reflectors in order to couple the microwave beam to a smaller diameter waveguide for final transfer to the NMR sample [13], [17]. A misalignment in the system will reduce the transmitted microwave power to the DNP-NMR sample. With an increase in frequency, higher tolerances are needed on the dimensions of the waveguide components and their precision alignment for low mode conversion loss and high transmission efficiency. Measurement inaccuracies and misalignment such as tilted injection into the waveguide can excite unwanted higher order modes which cause high transmission loss and arcing events in the waveguides [18], [19]. A gyrotron output beam that is not a perfect Gaussian in quality also deteriorates the waveguide performance by coupling to higher order modes and increases losses and reflections.
In this paper, we focused on two issues: to experimentally validate the phase retrieval technique and to correctly determine the higher order mode content in a transmission line in order to estimate the power loss due to higher order modes [7], [19], [20]. First, we performed measurements of the intensity and phase profiles of the radiated field from an open-ended corrugated waveguide. We then used diffraction theory to propagate the measured field back to the waveguide aperture and analyzed the misalignment errors in the measurement system and their effect on the calculated higher order modes. We used a helically tapped corrugated waveguide designed for 330 GHz. The field measurements were performed using a vector network analyzer (VNA). This is explained in Section II. The phase measurements, down to ~−70 dB of the peak field intensity using the VNA, also help to analyze the misalignment errors and validate the phase retrieval technique [21]–[23]. This technique is explained in Sections III and IV. Section V discusses the modes of the corrugated waveguide using the complex field (intensity and phase) information and the diffraction theory by propagating the field back to the waveguide aperture.
II. Experimental Setup and Measurements
A. Experimental Setup and Procedure
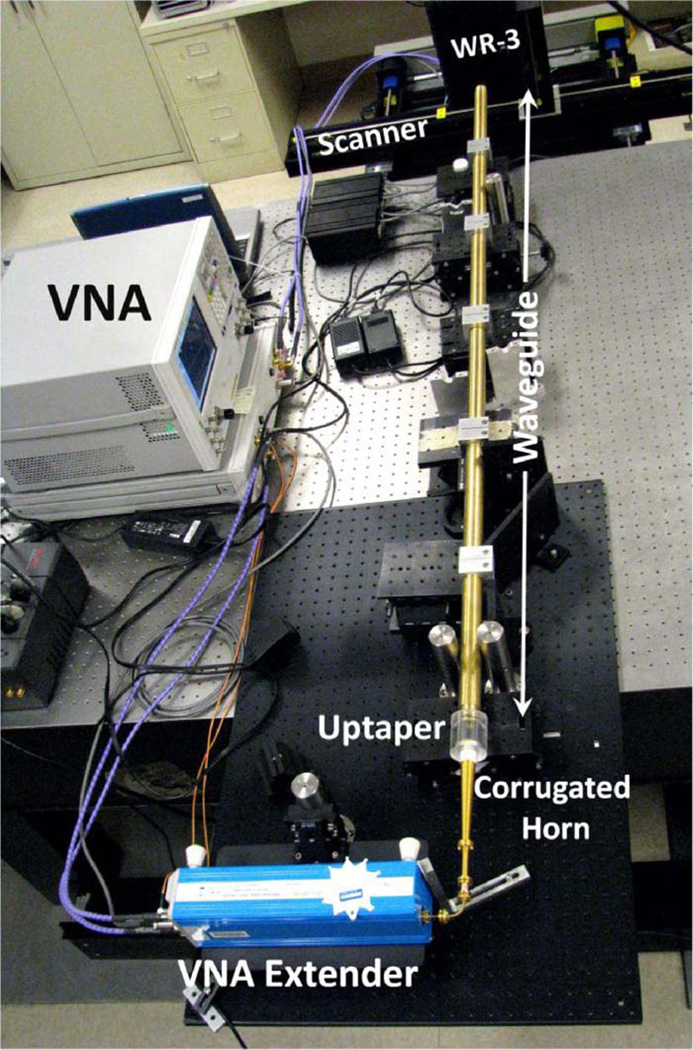
We used a 1.8 m long helically tapped corrugated waveguide designed for 330-GHz frequency and constructed from six 19 mm ID, 30 cm long brass tubing sections tapped with an 80 grooves per in (3.15/mm) tap [24], [25]. The corrugated waveguide is designed for transferring the microwave power from a 330-GHz tunable gyrotron [12] to a 500-MHz DNP-NMR spectrometer. A VNA (Agilent E8363B with millimeter wave extender V03VNA2-T/R) was used to measure the amplitude and phase profiles over a 10 cm × 10 cm scanned cross section of the measurement plane. The operating frequency was 250 GHz with a bandwidth of 10 MHz. The linearly polarized (LP) HE11 mode for testing was obtained from the combination of waveguide transitions; WR-3 VNA waveguide to WR-5 waveguide transition; rectangular to circular waveguide; smooth circular to corrugated waveguide transition; and a transition to a corrugated horn. The corrugated horn was then connected to the brass waveguide for testing using a smooth-wall dielectric uptaper. The receiving waveguide and the VNA head were placed on an automated computer-controlled 3-D scanner to measure the intensity and phase profiles on a plane parallel to the waveguide aperture at many locations along the waveguide axis. The experimental setup is shown in Fig. 1. Alignment of the intensity and phase measurement setup is an important issue in correctly evaluating the excited modes of the corrugated waveguide. We aligned the setup using a laser and two irises with a pinhole of 1 mm on both ends of a 2-m section of the corrugated brass waveguide (Fig. 1). The receiving antenna is a cut waveguide (WR-3) that is attached to the VNA extender which is placed on the scanner rails. The total mechanical error induced by the scanner alignment in the measurement plane parallel to the waveguide aperture is estimated to be less than 0.12° in both x and y directions. The offset error of the receiver waveguide with respect to the center of the corrugated waveguide aperture is estimated to be 0.25 mm in both x and y directions.
Fig. 1.
Picture of the experimental set up showing 2 m (six sections, 30 cm each) of the brass waveguide connected to the VNA extender using WR-3 waveguide to WR-5 waveguide, rectangular to circular, smooth to corrugated transition, and to a corrugated horn.
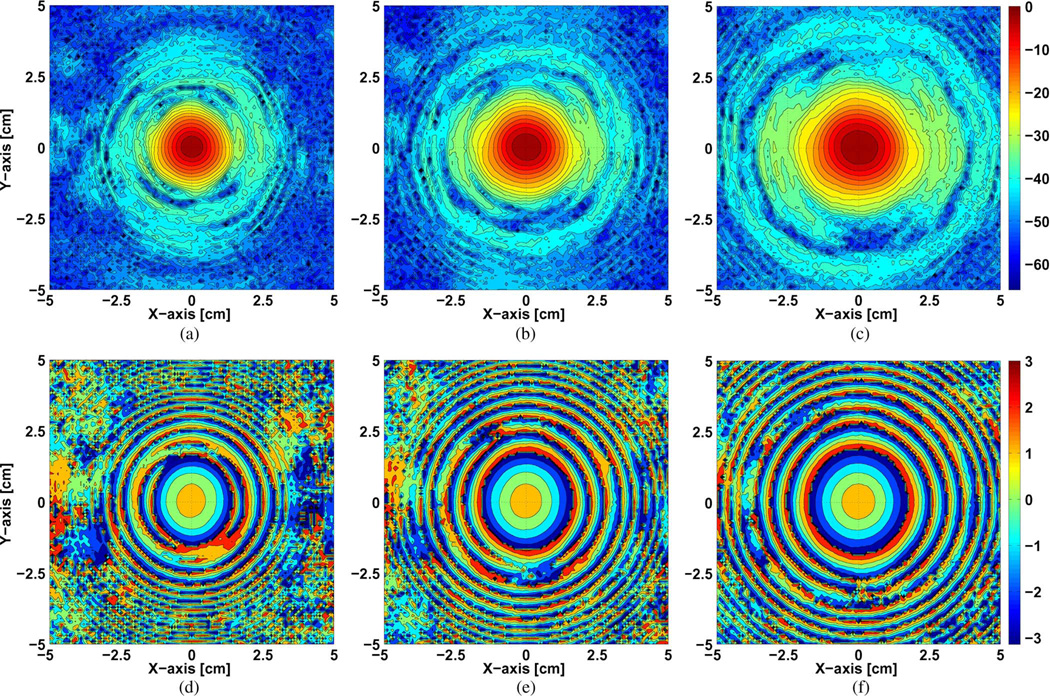
Measurements were done at several distances from 7 cm to 30 cm from the waveguide aperture to validate the phase retrieval technique and mode content accuracy. The step size of the measurement points in each cross section of the plane was chosen to be on the order of the wavelength at 250 GHz. Fig. 2 shows the measured intensity and phase profiles at 7/10/13 cm from the waveguide aperture. The electric field in the present setup is parallel to the x-axis of Fig. 2. Although the VNA measured the intensity from ~−24 dB down to ~−94 dB, the shown intensity is normalized with respect to the peak intensity value. Our phase measurement accuracy can be seen clearly in terms of concentric rings in the low power density areas down to −50 dB or less of the corresponding intensity pattern (Fig. 2). The sidelobes in the intensity profiles around the main lobe are due to field diffraction at the waveguide aperture.
Fig. 2.
Measured intensity (a), (b), and (c) and phase (d), (e), and (f) profiles on a 10 cm × 10 cm plane size at 7/10/13 cm from the waveguide aperture. Intensity contours are at every −3 dB from the peak intensity. Phase is shown in radians and wrapped in a modulo of 2π.
Cross polarization measurements were also done at the same frequency. The measured peak field intensity in the cross-polarized field is 26 dB less with respect to the peak intensity of the co-polarized field. Polarization rotation by a helically grooved waveguide is less of an issue at higher frequencies because of the inverse frequency squared scaling [6]. The rotation angle in radians can be estimated as θ ≅ ((2.405/ka)3Lp/λa), where p is the groove pitch, L is the waveguide length, a is the internal waveguide radius, k = 2π/λ is the wavenumber and λ is the wavelength. For our waveguide parameters, the total rotation is estimated as 0.04° at 330 GHz for the 2-m section of waveguide.
B. Amplitude and Phase Repeatability Error of VNA
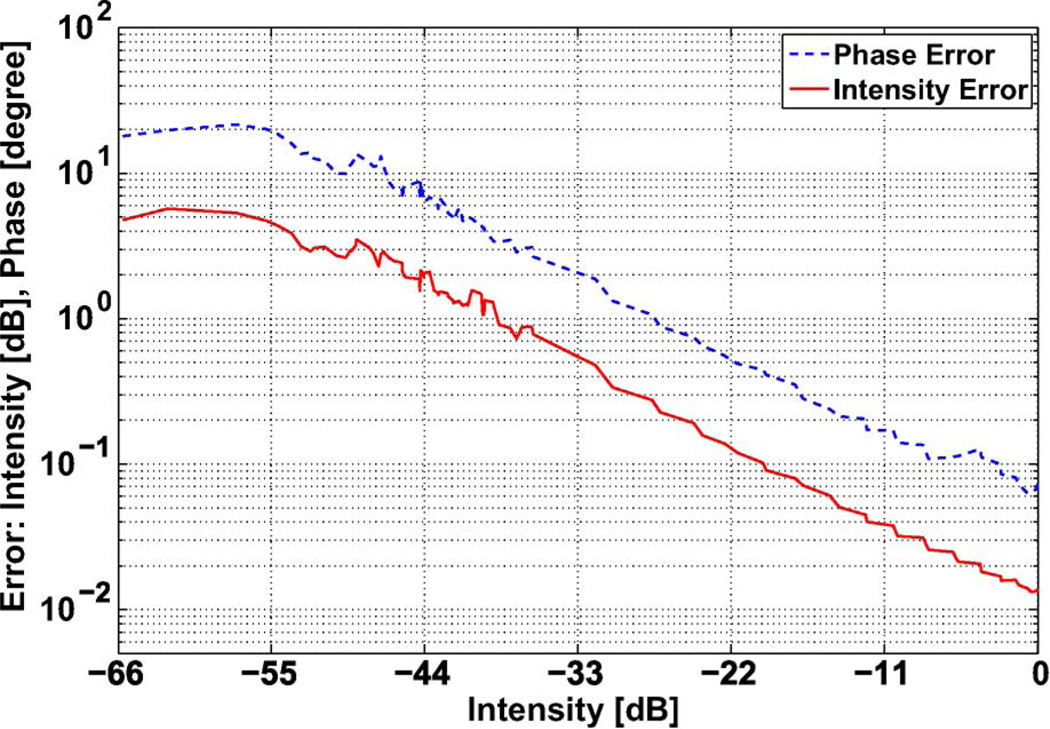
The VNA adds the ability to measure the phase characteristics of microwave signals over a very large dynamic range with high accuracy. We start with an assessment of the errors of our VNA extender. One significant source of error was due to the changes in the electrical length of the cables supplying the local oscillator signal to the two extension heads. We found that movement of the heads, even after the heads are moved back to their initial positions, led to differences in the measured phase. This phase change is due to the positioning errors and unavoidable bending of the cables that the movement involved, resulting in changes of the electrical length of these cables that remains even after the heads are moved back to their initial position. We supported the cables to constrain their movement to a similar path for all sets of measurements. Then, we performed repeated intensity and phase measurements to quantify the error due to the drift in the local oscillator signals supplied to the heads. The repeated measurements were made at 7 cm from the waveguide aperture. The VNA detected the intensity signal in dB and phase was wrapped in the modulo of 2π. Fig. 3 shows the intensity and phase repeatability error of the VNA with respect to the measured intensity. The repeatability error of phase and intensity is calculated with respect to intensity at every (x, y) location on the measurement plane by evaluating the standard deviation of the repeated measurements and plotted with respect to the measured intensity from peak value to minimum. The error in the intensity in the high intensity region down to −40 dB of the peak intensity is less than 0.5 dB and the phase error is less than 3°. In the low intensity areas in the range below −40 dB (Fig. 2) the phase error is 5 to 12° and the intensity error is more than 1 dB. These errors are sufficiently small that they do not affect the final results.
Fig. 3.
Intensity and phase measurement repeatability error of the VNA. The error is plotted with respect to the intensity normalized to the peak value.
The accuracy of the estimate of the mode content is affected by the accuracy of alignment of the scanner with respect to the axis of the waveguide. We estimate that the uncertainties in the orientation and position of the scanner due to misalignment are θx = 0.12°, θy = 0.12°, Δx = 0.25 mm and Δy = 0.25 mm. The total error is estimated using the square root of the sum of squares of the x and y angular and offset errors. We used (22) of [19] and find that the mode content error is estimated to be 0.3%.
III. Analysis of Measured Intensity and Phase Profiles
A. Mode Content Results
The measured complex field (intensity and phase) u(x′, y′, zj) was analyzed in detail by propagating it back to the waveguide aperture using the complete diffraction integral [23], [26] given by
| (1) |
where r is the propagation vector representing the distance between any point in the observation plane at zj and the input plane at zi, given by
| (2) |
(x, y, zi) are the waveguide aperture plane coordinates, (x′, y′, zj) are the measurement plane coordinates, and, Ω is the size of the measurement plane.
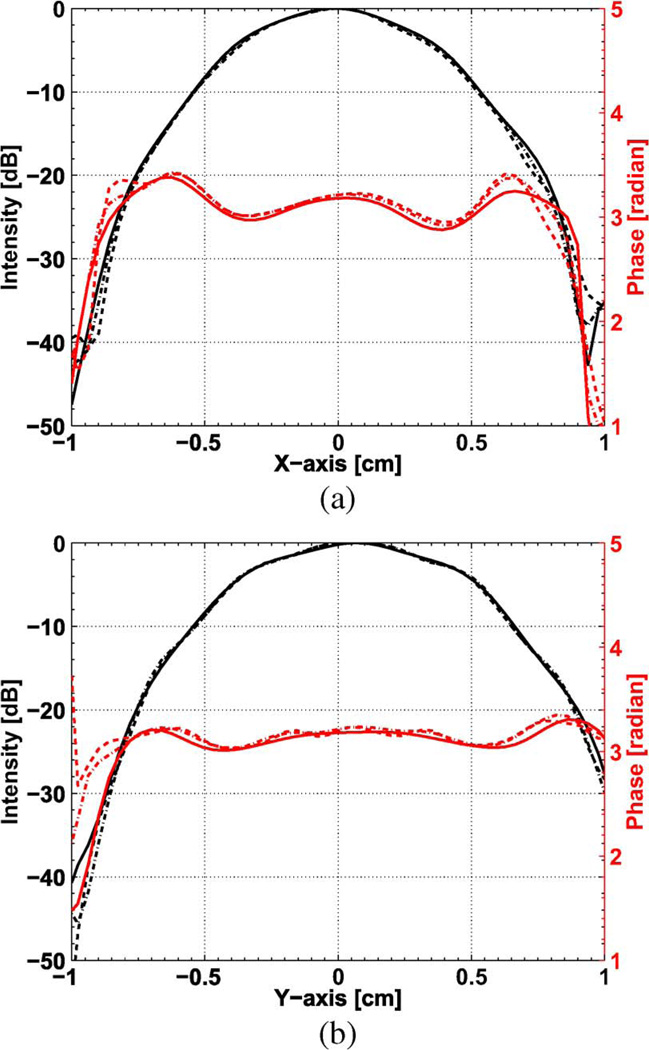
Fig. 4(a) and (b) shows the intensity and phase at the waveguide aperture, propagated back from 7, 10, and 13 cm, along the x and y dimensions, respectively. The data shown are the raw data without any tilt and offset correction. An excellent agreement can be seen in the three back propagated field intensities down to −42 dB of the peak intensity. The three phase profiles are also in good agreement. The small departure of phase profiles from being flat at the waveguide aperture is due to the higher order modes that were present in the waveguide. The three phase profiles in Fig. 4(a) and (b) agree within the misalignment error and measurement error of the VNA.
Fig. 4.
Intensity and phase profiles along the (a) x and (b) y dimensions at the waveguide aperture back propagated from 7 cm (dashed lines), 10 cm (dashed dotted lines), and 13 cm (solid lines). The waveguide radius is 9.5 mm.
The back-propagated fields can be projected onto the modes of the corrugated waveguide to determine the mode content. The coefficients of fundamental and higher order modes excited in the waveguide are calculated using the orthonormality condition of the corrugated waveguide modes. For commonly used circular corrugated waveguides, the wave equation leads to the orthonormal cylindrical modes in terms of Bessel functions given by
| (3) |
where a is the waveguide radius, χmn is the nth zero of the Bessel function Jm and (r, ϕ) are the cylindrical coordinates, Z0 is the free space impedance and P0 is the power of the radiated field. The field in an open ended waveguide can be written as a combination of these modes
| (4) |
Here, the complex coefficients Amn can be calculated using the orthonormality condition of the Bessel function as
| (5) |
where umn(r, ϕ) is the mnth mode of the corrugated waveguide given by (3).
We obtain three independent measurements, at 7, 10, and 13 cm, as shown in Table I. The agreement between these three independent measurements is found to be within our estimated error of ±0.3%. From these three measurements, we may also obtain an average mode content result, also shown in Table I. The results in Table I show that the mode content is 94.2% HE11 mode; 4.0% LP02 mode; with the remainder spread out over many modes.
TABLE I.
Comparison of the Calculated Mode Content Fraction Given in % of the Even and Odd Linearly Polarized (LP) Modes of an Overmoded Corrugated Waveguide
| Mode | Back Propagated from: | Average Mode Content |
Reconstructed 7/10/13 cm |
Reconstructed 10/20/30 cm |
|||
|---|---|---|---|---|---|---|---|
| 7cm | 10cm | 13cm | |||||
| HE11 | 93.84 | 94.21 | 94.53 | 94.2 | 93.89 | 95.36 | |
|
|
0.06 | 0.05 | 0.09 | 0.1 | 0.67 | 0.01 | |
|
|
0.32 | 0.34 | 0.33 | 0.3 | 0.31 | 0.35 | |
|
|
0.03 | 0.01 | 0.02 | <0.1 | 0.04 | 0.02 | |
|
|
0.43 | 0.41 | 0.38 | 0.4 | 0.42 | 0.30 | |
|
|
0.10 | 0.11 | 0.10 | 0.1 | 0.04 | 0.0 | |
| LP02 | 4.31 | 3.96 | 3.65 | 4.0 | 3.68 | 3.33 | |
| LP03 | 0.23 | 0.32 | 0.35 | 0.3 | 0.28 | 0.04 | |
| LP04 | 1.15 | 0.13 | 0.13 | 0.1 | 0.06 | 0.0 | |
| others | 0.53 | 0.46 | 0.42 | 0.4 | 0.61 | 0.59 | |
The estimated error in the mode content measurement is 0.3%, as noted earlier. Most of the values in Table I are below this level and are therefore not reliable. They are included for completeness. The LP02 mode is likely generated before the entrance to the transmission line in the tapers; this mode has very low loss on the line.
B. Misalignment Analysis
The measured intensity and phase profiles were analyzed for misalignment errors based on the first-and second-order moments. Fig. 5 shows the x and y centroids and the effective spot size of the radiated field along the propagation axis calculated using the expression of the nth order general moments given by
| (6) |
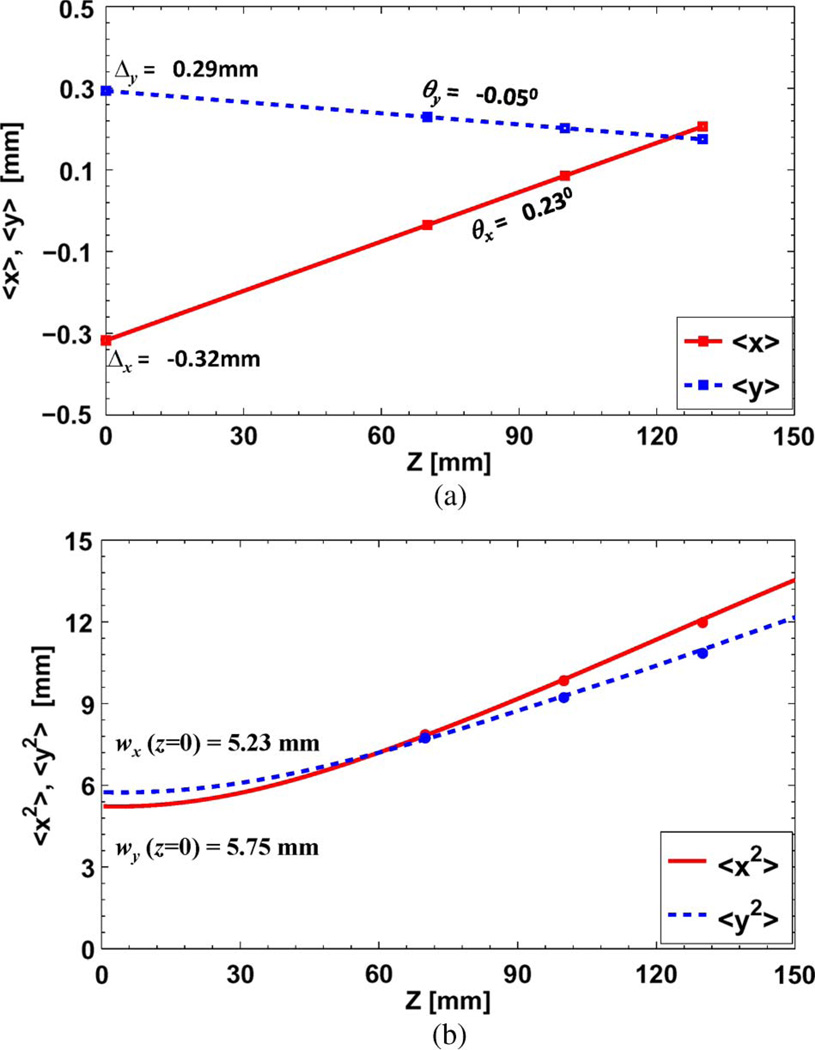
where I(x, y; zi) = |u(x, y; zi)|2 is the intensity of the field at the zi position. A similar expression holds for the y direction. The centroids for the fields measured at 7/10/13 cm, shown in Fig. 5(a), lie almost exactly on a straight line. The centroid at z = 0 is calculated by extrapolating the straight line to z = 0. This gives us the offset of the field at the waveguide aperture Δx = −0.32 mm and Δy = 0.29 mm. The beam propagation angles of the centroids are θx = 0.23° and θy = −0.05°. These slopes of the first moment evolution shown in Fig. 5 are in good agreement with the expressions given by the quasi-optical moment theory [22]. The x and y centroid angles and offsets with respect to the mechanical axis, and, center of the waveguide aperture may be due to the higher order mode contents, the alignment errors or both. In order to further analyze the tilt and offset the fields from the measured positions are propagated back to the waveguide aperture. The centroids of the back propagated fields at z = 0 are then calculated. For an aligned system, the centroids of all the back propagated fields at the aperture should coincide and must be consistent with the centroid calculated by extrapolating the straight line (Fig. 5) at z = 0. A disagreement could arise from scanner misalignment error leading to incorrect data analysis. It is found from the calculations that the x centroid was offset by 0.18 mm whereas the y centroid was almost perfectly aligned. Therefore, based on back propagating the fields to the waveguide aperture and their centroid calculations, a tilt correction was made in the x direction. From the analysis, we confirmed that the setup was aligned within the mechanical limits, θx,y ~ 0.12° tilt of the measurement plane and Δx,y ~ 0.25 mm in offset at the waveguide aperture.
Fig. 5.
(a) The x and y centroids of the radiated field along the propagation axis. The x centroid makes an angle of 0.23° with the propagation axis whereas the y centroid makes an angle of −0.05°. The corresponding offsets are −0.32 mm and 0.29 mm in the x and y direction, respectively. The Δx and Δy are referenced to the center of the waveguide aperture. (b) represents the effective beam spot size in the x and y direction along z. The dots represent the spot size of the measured field at 7/10/13 cm.
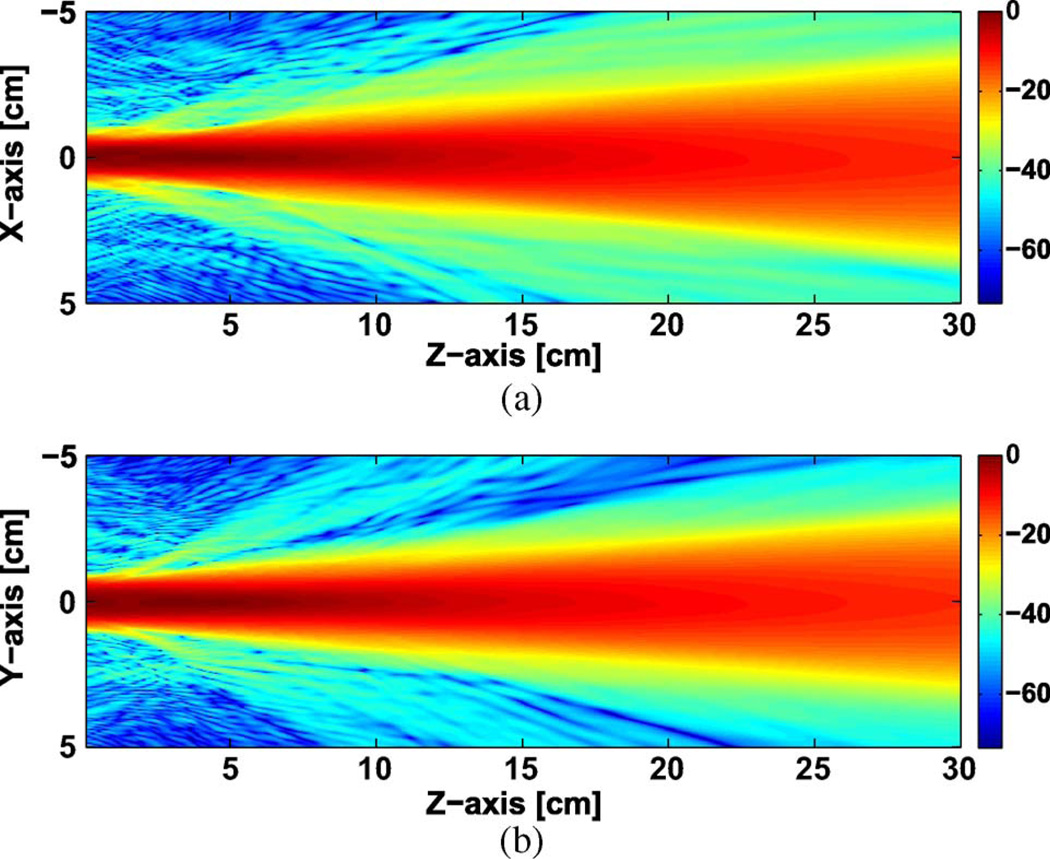
The field is propagated from the aperture plane to 30 cm along the propagation axis and the beam spot size is calculated by the second-order moments using (6). The calculated effective beam spot size is shown in Fig. 5(b). The radiated field profile is elliptical at the aperture extended in the y axis. The simple astigmatic behavior of the radiated field can be seen in Fig. 5(b) where the small ellipticity of the field flips from the y-axis to the x-axis with increasing z. The field diffraction at the aperture of the waveguide in the near field affects the minimum beam spot size location which lies outside the waveguide aperture by 3.5 mm and 4 mm in x and y directions, respectively. Fig. 6 shows the calculated radiated intensity profile in the x and y axis along the direction of propagation. The shown intensity profile is calculated using the field measured at 7 cm from the aperture and (1). Fig. 6 shows that at larger z, the measurement plane in x – y should be increased. At larger distances from the aperture, the field intensity lost outside of the boundary of a fixed measurement plane size affects the mode content retrieval and phase reconstruction of the field.
Fig. 6.
Radiated field intensity in dB along the propagation direction in (a) x and (b) y dimensions.
IV. Phase Retrieval Analysis
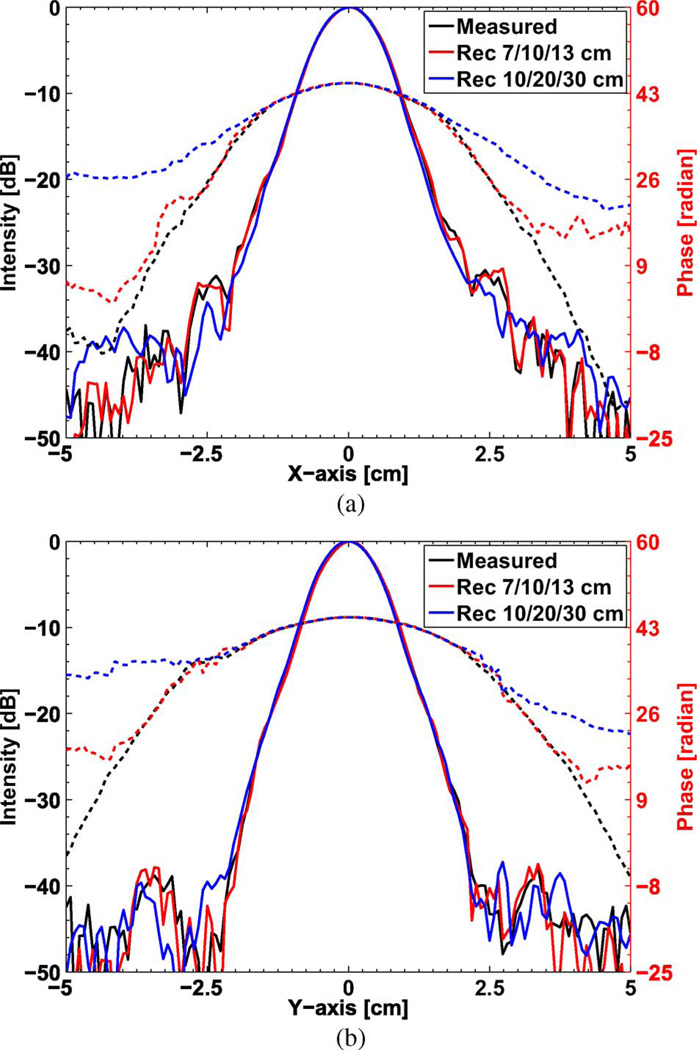
At high-power levels, phase measurements are not practical and one has to rely on the analysis of a series of intensity profiles to retrieve the phase information [21]. The retrieved phase along with the measured intensity are used to analyze the radiated field. Using diffraction theory, the radiated field is used to align the quasi-optical components of the transmission line system and correctly predict the higher order modes in the corrugated transmission line. Therefore, it becomes necessary to estimate the accuracy of the phase retrieval technique. This can be done based on the known (measured) phase information [22]. In our experiments, the highly accurate phase profile measurements made at low power levels using a VNA adds the flexibility to validate the phase retrieval technique. This validation requires many different parameters to be analyzed e.g., separation between the measurement planes, location of the measured intensity with respect to the radiating aperture, measurement cross section dimensions, etc. We performed intensity and phase measurements at two different sets of locations 7/10/13 cm and 10/20/30 cm from the waveguide aperture. The phase was reconstructed by the phase retrieval technique [21]–[23] and compared with the measured phase at all these locations. Fig. 7(a) and (b) shows the measured and reconstructed intensity and phase profiles at 10 cm from the waveguide aperture. The red line (solid and dashed), which represents the field reconstructed for closely spaced planes 7/10/13 cm, shows better agreement with the black line (measured at 10 cm) compared to the blue line which represents the field reconstructed for farther spaced planes 10/20/30 cm. The phase curvature agreement of closely spaced planes in the near field of the aperture within one Rayleigh length ≈ 10 cm (assuming a beam waist of 0.64a, a = radius of the waveguide) goes down to less than −30 dB of the peak intensity in both x and y axis. This clearly indicates the advantage of using closely spaced planes that are close to the radiating aperture. Measurements at greater distances are prone to larger errors due to misalignment because one needs a larger cross section of the measurement plane. These results experimentally validate the phase retrieval method down to ~−40 dB which covers more than 99.95% of the power in high quality beams.
Fig. 7.
Measured and reconstructed intensity (solid lines) and phase (dashed lines) profiles along the x and y dimension of the measurement plane at 10 cm from the radiating waveguide aperture.
V. Discussion of Calculated Mode Content
Table I shows the comparison of the mode contents obtained by five independent measurements; the measured field back propagated to the waveguide aperture from 7, 10, and 13 cm; phase reconstructed field for 7/10/13 cm; and phase reconstructed field for 10/20/30 cm. The higher order modes are calculated in terms of LP modes explained in [20]. Since the output RF beam of a gyrotron is a LP field which is coupled to the HE11 mode (LP) of an open-ended corrugated waveguide for low loss transmission, therefore it is more convenient to represent the field in terms of LP modes. For the three measurements obtained by back propagating the fields from 7, 10, and 13 cm (column 2, 3, and 4), excellent agreement can be seen in the higher order LP modes. The only exception is an increase of 0.7% in the HE11 mode and a decrease in the LP02 mode by the same amount for farther distances. This difference likely derives from the combination of small misalignment in the measurements and the diffraction effects that prevail in the near field for a mode with a higher index. The fifth column is an average of the results in these three columns. The mode contents calculated from the phase reconstructed field (7/10/13 cm) are in good agreement with the mode contents calculated from the back propagated fields.
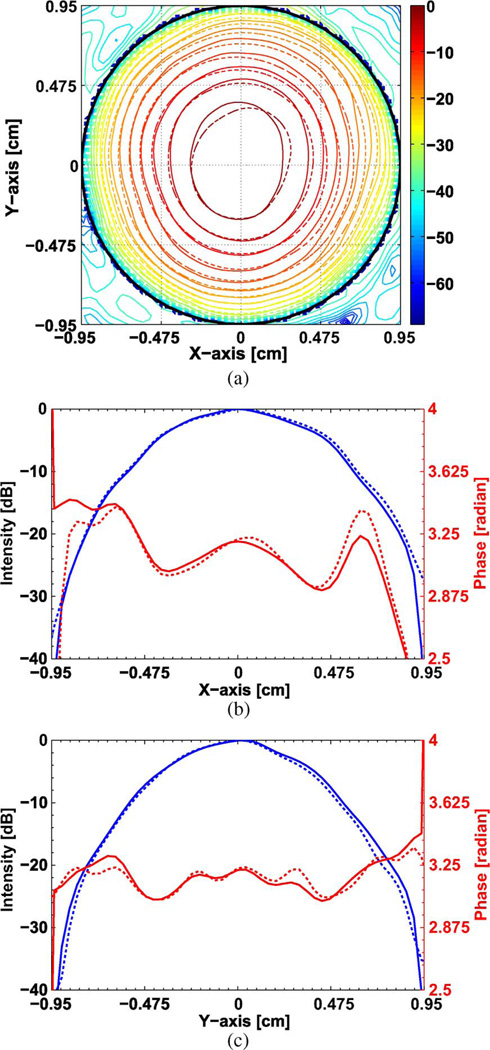
The last case, where the mode contents are calculated from the reconstructed field at 10/20/30 cm, has a significantly higher value of HE11 mode content. This can be confirmed from Fig. 6 where the radiated field is lost outside of the boundary of the cross section for larger distances removing the effect of higher order modes which radiate at larger angles. This result again indicates that the field measured close to the waveguide aperture on closely spaced planes provides more accurate results in comparison to the larger distances due to the limited area of the scanned profile. Fig. 8(a) shows the intensity profile at the waveguide aperture calculated from the back propagation of the field from the 7 cm location and the field reconstructed from the 7/10/13 cm planes. Fig. 8(b) and (c) represents the intensity and phase at the waveguide aperture for the above case along the x and y axes. Good agreement can be seen between the two cases.
Fig. 8.
(a) Intensity profile of the field at the aperture: back propagated from 7 cm (solid line); reconstructed from the intensity measured at 7/0/13 cm (dotted line). The intensity contours are at every −3 dB of the peak intensity value. For the same case, (b) shows the intensity (blue line) and phase (red line) along the x axis, and, (c) shows the intensity (blue line) and phase (red line) along the y axis.
VI. Conclusion
The experimental results and analysis presented in this work demonstrate the importance of highly accurate alignment on the accuracy of the measurement of field patterns and waveguide mode content. Misalignment will clearly lead to incorrect estimation of the higher order modes in an overmoded terahertz corrugated waveguide. This incorrect estimation would also lead to erroneous evaluation of the loss in the waveguide due to these higher order modes. A tilt of more than 0.1° and an offset of 0.25 mm in the intensity measurement cross section at higher frequencies would significantly affect the calculated power in the other modes. The accurate phase measurements performed using the VNA down to ~−50 dB of the peak field intensity helps to correctly predict the alignment problems and to validate the phase retrieval technique. We have shown that intensity measurements made close to the radiating aperture in the near field on closely spaced planes provide more accurate retrieved phase and decomposition of waveguide modes. The error in the mode content based on the direct phase measurements and the retrieved phase is less than ±0.3% for the fundamental mode HE11. A discussion of the losses due to the higher order modes based on this modal decomposition is presented in [25]. This analysis is useful in characterizing the corrugated transmission lines for ECRH and DNP NMR spectroscopy experiments.
Acknowledgments
This work was supported by the NIH and NIBIB under the Contracts R01-EB004866 and R01-EB001965 and by the US ITER project managed by Battelle/Oak Ridge National Laboratory.
Biographies

Sudheer K. Jawla received the M.Sc. degree in physics from the Indian Institute of Technology, New Delhi, India, in 2004, and the Ph.D. degree in physics from the Plasma Physics Research Center, EPFL, Lausanne, Switzerland, in 2010.
He is currently working as Postdoctoral Associate with the Waves and Beams Division of the Plasma Science and Fusion Center at Massachusetts Institute of Technology, Cambridge. His research interests include quasi-optical techniques and components at millimeter/terahertz wavelengths, and high-power, high-frequency Gyrotron systems for plasma fusion and dynamic nuclear polarization nuclear magnetic resonance applications.

Emilio A. Nanni (S’09) received the B.S. degrees in electrical engineering and in physics from the University of Missouri, Rolla, in 2007, and the S.M. degree in electrical engineering from the Massachusetts Institute of Technology, Cambridge, in 2010, where he is currently working toward the Ph.D. degree.
In 2008, he was with the NASA Marshall Space Flight Center, Huntsville, AL, developing nondestructive evaluation techniques for applications related to the US space program. He is currently a Graduate Research Assistant with the Waves and Beams Division of the Plasma Science and Fusion Center, Massachusetts Institute of Technology. His research interests include high-power, high-frequency vacuum electronic devices and their application to dynamic nuclear polarization/nuclear magnetic resonance.

Michael A. Shapiro (M’09) received the Ph.D. degree in radio physics from the University of Gorky, Gorky, Russia, in 1990.
Since 1995, he has been with the Plasma Science and Fusion Center, Massachusetts Institute of Technology, Cambridge, where he is currently Head of the Gyrotron Research Group. His research interests include vacuum microwave electron devices, high-power gyrotrons, dynamic nuclear polarization spectroscopy, high-gradient linear accelerators, quasi-optical millimeter-wave components, and photonic bandgap structures and metamaterials.

Paul P. Woskov (S’74–M’76–SM’99) received the B.S. degree in physics, and the M.S. and Ph.D. degrees in electrical engineering from the Rensselaer Polytechnic Institute, Troy, NY, in 1972, 1974, and 1976, respectively.
He is a Senior Research Engineer at the Plasma Science and Fusion Center, Massachusetts Institute of Technology, Cambridge. His primary research interests include millimeter-wave technologies and applications to energy and environment.
Dr. Woskov is a senior member of the Institute of Electrical and Electronic Engineers, a member of the American Physical Society, American Nuclear Society, American Association for the Advancement of Science, and Eta Kappa Nu. He has served as a member of Executive Committee, IEEE Plasma Sciences and Application Committee from 2007–2010.

Richard J. Temkin (M’87–SM’92–F’94) received the B.A. degree in physics from Harvard College, Cambridge, MA, and the Ph.D. degree in physics from the Massachusetts Institute of Technology (MIT), Cambridge.
From 1971 to 1974, he was a Postdoctoral Research Fellow with the Division of Engineering and Applied Physics, Harvard University. Since 1974, he has been with MIT, first with the Francis Bitter National Magnet Laboratory and later with the Plasma Science and Fusion Center (PSFC) and the Department of Physics. He currently serves as a Senior Scientist in the Physics Department, as the Associate Director of the PSFC, and the Head of the Waves and Beams Division, PSFC. His research interests include novel vacuum electron devices such as the gyrotron and free electron laser, advanced high-gradient electron accelerators, overmoded waveguides and antennas at millimeter/THz wavelengths, high-power microwave sources and their applications, plasma heating, and dynamic nuclear polarization/nuclear magnetic resonance. He has been the author or coauthor of over 200 published journal articles and book chapters and has been the editor of six books and conference proceedings.
Dr. Temkin is a Fellow of the American Physical Society and The Institute of Physics, London, U.K. He has been the recipient of the Kenneth J. Button Prize and Medal of The Institute of Physics, London and the Robert L. Woods Award of the Department of Defense for Excellence in Vacuum Electronics research.
Footnotes
Color versions of one or more of the figures in this paper are available online at http://ieeexplore.ieee.org.
Contributor Information
Sudheer K. Jawla, Email: sudheer@mit.edu.
Emilio A. Nanni, Email: enanni@mit.edu.
Michael A. Shapiro, Email: shapiro@psfc.mit.edu.
Paul P. Woskov, Email: ppwoskov@mit.edu.
Richard J. Temkin, Email: temkin@mit.edu.
References
- 1.Gandini F, Bigelow TS, Becket B, Caughman JB, Cox D, Darbos C, Gassmann T, Henderson MA, Jean O, Kajiwara K, Kobayashi N, Nazare C, Oda Y, Omori T, Purohit D, Rasmussen DA, Ronden DMS, Saibene G, Sakamoto K, Shapiro MA, Takahashi K, Temkin RJ. The EC H&CD transmission line for ITER. Fusion Sci. Technol. 2011 May;59(no. 4):709–717. [Google Scholar]
- 2.Thumm MK, Kasparek W. Passive high-power microwave components. IEEE Trans. Plasma Sci. 2002 Jun;30(no. 3):755–786. [Google Scholar]
- 3.Nanni EA, Barnes AB, Griffin RG, Temkin RJ. THz dynamic nuclear polarization NMR. IEEE Trans. Terahertz Sci. Technol. 2011 Sep;1(no. 1):145–163. doi: 10.1109/TTHZ.2011.2159546. [DOI] [PMC free article] [PubMed] [Google Scholar]
- 4.Clarricoats PJB, Olver AD. Corrugated Horns for Microwave Antennas. Vol. 18. London: Inst. Eng. Technol.; 1984. ser. IEE Electromagnetic Waves Series. [Google Scholar]
- 5.Dragone C. Attenuation and radiation characteristics of the HE11—Mode. IEEE Trans. Microw. Theory Tech. 1980 Jul;MTT-28(no. 7):704–710. [Google Scholar]
- 6.Doane JL. Propagation and mode coupling in corrugated and smooth walled circular waveguides. In: Button KJ, editor. Infrared Millim. Waves. Vol. 13. New York: Academic; 1985. ch. 5. [Google Scholar]
- 7.Shapiro MA, Kowalski EJ, Sirigiri JR, Tax DS, Temkin RJ, Bigelow TS, Caughman JB, Rasmussen DA. Loss estimate for ITER ECH transmission line including multimode propagation. Fusion Sci. Technol. 2010 Apr;57(no. 3):196–207. [Google Scholar]
- 8.Oda Y, Kajiwara K, Takahashi K, Kasugai A, Shapiro MA, Temkin RJ, Sakamoto K. Measurement of RF transmission mode in ITER relevant EC H&CD transmission line. J. Infrared, Millim. Terahertz Waves. 2010;31(no. 8):949–957. [Google Scholar]
- 9.Callis RW, et al. The 6MW, 110 GHz system for the DIII-D tokamak. Conf. Rec. IEEE Int. Plasma Sci. 2002:294–294. [Google Scholar]
- 10.Leuterer F, Beckmann M, Brinkschulte H, Monaco F, Münich M, Ryter F, Schütz H, Empacher L, Gantenbein G, Förster W, Kasparek W, Schüller P, Schwörer K, Borchegowski A, Fix A, Illin V, Popov L, Sigalaev V, Tai E. Experience with the ECRH system of ASDEX-upgrade. Fusion Eng. Des. 2001 Jan;53(no. 1–4):485–489. [Google Scholar]
- 11.Hornstein MK, Bajaj VS, Griffin RG, Kreischer KE, Mastovsky I, Shapiro MA, Sirigiri JR, Temkin RJ. Second harmonic operation at 460 GHz and broadband continuous frequency tuning of a gyrotron oscillator. IEEE Trans. Electron Devices. 2005 May;52(no. 5):798–807. [Google Scholar]
- 12.Torrezan AC, Shapiro MA, Sirigiri JR, Temkin RJ, Griffin RG. Operation of a continuously frequency-tunable second-harmonic CW 330-GHz gyrotron for dynamic nuclear polarization. IEEE Trans. Electron Devices. 2011 Aug;58(no. 8):2777–2783. [Google Scholar]
- 13.Bajaj VS, Farrar CT, Hornstein MK, Mastovsky I, Vieregg J, Bryant J, Eléna B, Kreischer KE, Temkin RJ, Griffin RG. Dynamic nuclear polarization at 9 Tesla using a novel 250 GHz gyrotron microwave source. J. Magn. Reson. 2003 Feb;160(no. 2):85–90. doi: 10.1016/j.jmr.2011.09.010. [DOI] [PubMed] [Google Scholar]
- 14.Woskov PP, Bajaj VS, Hornstein MK, Temkin RJ, Griffin RG. Corrugated waveguide and directional coupler for CW 250-GHz gyrotron DNP experiments. IEEE Trans. Microw. Theory Tech. 2005 Jun;53(no. 6):1863–1869. doi: 10.1109/TMTT.2005.848097. [DOI] [PMC free article] [PubMed] [Google Scholar]
- 15.de Rijk E, Macor A, Hogge JP, Alberti S, Ansermet JP. Note: Stacked rings for terahertz wave-guiding. Rev. Sci. Instrum. 2011 Jun;82(no. 6):066 102. doi: 10.1063/1.3597579. [DOI] [PubMed] [Google Scholar]
- 16.Denisov G, Chirkov A, Belousov V, Bogdashov A, Kalynova G, Sobolev D, Rodin Y, Tai E, Ilin V, Kornishin S, Kulygin M, Malygin V, Soluyanova E, Parshin V, Shmelev M. Millimeter wave multi-mode transmission line components. J. Infrared, Millim. Terahertz Waves. 2011 Mar;32(no. 3):343–357. [Google Scholar]
- 17.Nanni EA, Barnes AB, Matsuki Y, Woskov PP, Corzilius B, Griffin RG, Temkin RJ. Microwave field distribution in a magic angle spinning dynamic nuclear polarization NMR probe. J. Magn. Reson. 2011 May;210(no. 1):16–23. doi: 10.1016/j.jmr.2011.02.001. [DOI] [PMC free article] [PubMed] [Google Scholar]
- 18.Ohkubo K, Kubo S, Iwase M, Idei H, Sato M, Shimozuma T, Takita Y, Kuroda T. Hybrid mode transmission in 62-m corrugated waveguide. Int. J. Infrared Millim. Waves. 1994 Sep;15(no. 9):1507–1519. [Google Scholar]
- 19.Ohkubo K, Kubo S, Idei H, Sato M, Shimozuma T, Takita Y. Coupling of tilting Gaussian beam with hybrid mode in the corrugated waveguide. Int. J. Infrared Millim. Waves. 1997 Jan;18(no. 1):23–41. [Google Scholar]
- 20.Kowalski EJ, Tax DS, Shapiro MA, Sirigiri JR, Temkin RJ, Bigelow TS, Rasmussen DA. Linearly polarized modes of a corrugated metallic waveguide. IEEE Trans. Microw. Theory Tech. 2010 Nov;58(no. 11):2772–2780. [Google Scholar]
- 21.Chirkov AV, Denisov GG, Aleksandrov NL. 3D wavebeam field reconstruction from intensity measurements in a few cross sections. Opt. Commun. 1995 Apr;115(no. 5/6):449–452. [Google Scholar]
- 22.Idei H, Shimozuma T, Shapiro MA, Notake T, Kubo S, Temkin RJ. Experimental verification of phase retrieval of quasi-optical millimeter-wave beams. IEEE Trans. Microw. Theory Tech. 2006 Nov;54(no. 11):3899–3905. [Google Scholar]
- 23.Jawla S, Hogge J-P, Alberti S, Goodman T, Piosczyk B, Rzesnicki T. Infrared measurements of the RF output of 170 GHz/2 MW coaxial cavity gyrotron and its phase retrieval analysis. IEEE Trans. Plasma Sci. 2009 Mar;37(no. 3):414–424. [Google Scholar]
- 24.Woskov PP, Nanni EA, Shapiro MA, Jawla SK, Hummelt JS, Temkin RJ, Barnes AB. Proc. 36th Int. Conf. Infrared, Millim., Terahertz Waves. Houston, TX: 2011. Oct 2–7, 330 GHz helically corrugated waveguide; pp. 1–2. [Google Scholar]
- 25.Nanni EA, Jawla SK, Shapiro MA, Woskov PP, Temkin RJ. Low loss transmission lines for high power terahertz radiation. J. Infrared, Millim. Terahertz Waves. 2012 doi: 10.1007/s10762-012-9870-5. [DOI] [PMC free article] [PubMed] [Google Scholar]
- 26.Goodman JW. Introduction to Fourier Optics. Greenwood Village, CO: Roberts & Co. Publ.; 2004. [Google Scholar]


