Abstract
Introduction
Pattern recognition receptor (PRR)-mediated signaling pathways have recently been elucidated to bridge the innate immune system and atherosclerosis. NLRP3 is among the family members of NOD-like receptors (NLRs), a type of PRRs. At present, most studies about the NLRP3 inflammasome focus on animal models and immune cells. Limited information is available regarding the role of NLRP3 in patients with coronary artery disease (CAD).
Material and methods
In this study, we observed the expression of NLRP3 and downstream cytokines in patients with CAD by ELISA, real-time qPCR and Western blot.
Results
We found that NLRP3 and downstream cytokines were coupled with increasing severity of CAD and a dynamic variation exists in patients with acute myocardial infarction. We also found that NLRP3 was correlated with Gensini score, indicating that NLRP3 might be relevant not only for the severity of CAD but also for the severity of coronary atherosclerosis.
Conclusions
This study provides a new theoretical basis for innate immune participation in atherosclerosis development and highlights the potential of the NLRP3 inflammasome as a target for prevention and treatment of CAD.
Keywords: NLRP3 inflammasome, interleukin 1β, interleukin 18, coronary artery disease, atherosclerosis
Introduction
Coronary artery disease (CAD) is the leading cause of mortality in most developed countries [1]. Atherosclerosis, which is a progressive disorder of the vessel walls with the formation of plaques throughout the arterial system, is the essential pathological process of CAD [2]. Inflammation has been assumed to play a pivotal role in the genesis of atherosclerosis though its pathogenesis is extremely complicated [1, 2]. It is generally accepted that a complex endothelial dysfunction induced by free radicals, low-density lipoproteins (LDL), infectious microorganisms, shear stress, toxins, hypertension or a combination of these and other factors will lead to a chronic inflammatory response which leads to atherosclerosis [2, 3].
Pattern recognition receptor (PRR)-mediated signaling pathways have recently been elucidated to bridge the innate immune system and atherosclerosis [3, 4]. Pattern recognition receptors include the Toll-like receptors (TLRs), located in the cell membrane, and nucleotide-binding oligomerization domain (NOD)-like receptors (NLRs), expressed in the cytoplasm [5]. NOD-like receptor family, pyrin domain containing 3 (NLRP3) is a member of the NLR family. Upon activation, NLRP3 recruits the adapter protein and forms the NLRP3 inflammasome. The NLRP3 inflammasome assembles in response to a variety of exogenous and endogenous activators as an initial priming step, and thereby initiates IL-1β and IL-18 processing, a key step in the innate immune response [6]. It is well known that IL-1β and IL-18 are two multifunctional cytokines involved in chronic inflammation and induce an intense inflammatory response during acute ischemic events, playing important roles in the pathogenesis and progression of atherosclerosis.
At present, most studies about the NLRP3 inflammasome focus on animal models and immune cells, especially in mice and the human acute monocytic leukemia cell line (THP-1) [7, 8]. Limited information is available regarding the role of NLRP3 in patients with CAD [7, 8]. As the role of the NLRP3 inflammasome in human atherosclerosis is unclear yet, we want to determine the expression of the NLRP3 inflammasome and downstream cytokines in patients with different degrees of atherosclerosis, and the variations of NLRP3 at different time points in patients with acute myocardial infarction (AMI). In addition, we also studied the potential role of the NLRP3 inflammasome in the development of atherosclerosis.
Material nad methods
The study was approved by the research ethics committee of the Second Affiliated Hospital of Dalian Medical University. Individual permission was obtained from the patients using standard informed consent procedures. The investigation conforms to the principles outlined in the Declaration of Helsinki regarding the use of human samples.
Patients
The patients were enrolled at the Department of Cardiology in the 2nd Affiliated Hospital of Dalian Medical University from July 2011 to June 2012. Seventy-one CAD patients and 20 healthy controls were enrolled in this study. The diagnosis of stable angina, acute coronary syndrome and AMI were according to the ACC/AHA guidelines. The Gensini scoring system was utilized in the evaluation of CAD severity. The Gensini score was calculated for each patient from the coronary arteriogram by assigning a severity score to each coronary stenosis according to the degree of luminal narrowing and its geographic importance [9]. The exclusion criteria were as follows. First, patients with type 2 diabetes, obesity, gout, silicosis, Alzheimer's disease and Crohn's disease, which are known to affect NLRP3 inflammasome signaling pathways, were excluded. Second, all sorts of acute or chronic infectious disease, serious lung diseases, liver and kidney disease, malignant tumor, autoimmune diseases and patients who used vitamin E or anti-inflammatory drugs were also excluded.
Isolation of monocytes
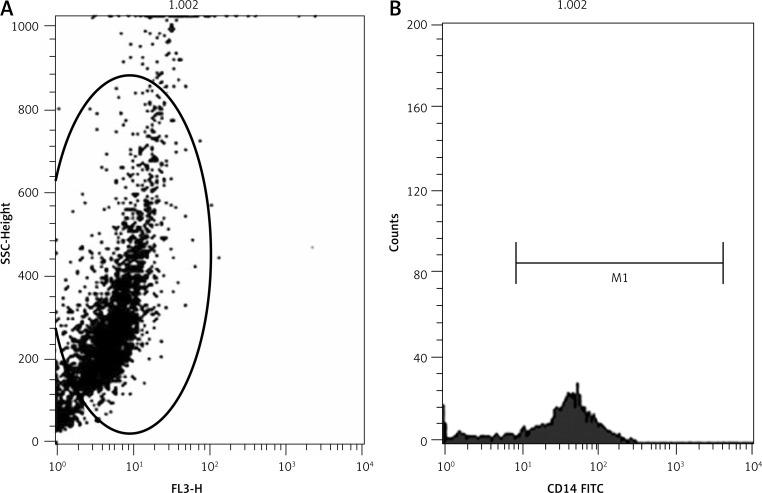
Human peripheral blood mononuclear cells were isolated by density-gradient centrifugation. After that, they were incubated in an incubator at 37°C with 5% CO2 for 2 h to obtain pure monocytes from lymphocytes (T cells, B cells, NK cells) [10]. Flow cytometry was used to check the purity of monocytes with CD14.
Analysis of plasma cytokine levels
ELISA was used to determine the expression level of interleukin 1 β (IL-1β) and interleukin 18 (IL-18) in plasma. Measurement of IL-1β (BMS 224/2, eBioscience) and IL-18 (BMS 267/2, eBioscience) by ELISA was performed according to the manufacturer's instructions.
RNA isolation and real-time reverse transcriptase-polymerase chain reaction
Total RNA was isolated from the monocytes using TRIzol Reagent (15596-026, Invitrogen). RNA from each sample was converted to cDNA using Promega MMLV reverse transcriptase (Cat No: 9PIM170). The reaction protocol of real-time polymerase chain reaction (RT-PCR) was as follows: 94°C for 4 min followed by 40 amplification cycles of 94°C for 30 s, 56°C for 60 s, and 72°C for 40 s. All qRT-PCR reactions, including no-template controls, were performed in triplicate. The qRT-PCR amplification products were assessed using melting curve analysis. The relative expression ratios of mRNAs were determined using the crossing point as the cycle number. The primers for each gene used in this study are as follows. β-actin: forward 5’-CGTGACATTA AGGAGAAGCTG-3’, reverse 5’-CTAGAAGCATTTGCGGTGGA C-3’; NLRP3: forward 5’-CTTCCTTTCCAGTTTGCTGC-3’, reverse 5’-TCTCGCAGTCCA CTTCCTTT-3’; caspase-1: forward 5’-GCCCAAGTTTGAAGGACAAA-3’, reverse 5’-GGTGTGGAAGAGCAGAAAGC-3’; IL-1β: forward 5’-GCCCTAA ACAGATGAAGTGCTC-3’, reverse 5’-GAACCAGCATCTTCCTCAG-3’; IL-18: forward 5’-GCT TGAATCTAAATTATCAGTC-3’, reverse 5’-GAAGATTCAAA TTGCATCTTAT-3’.
Western blot analysis
Western blot was used to examine the protein expression levels of NLRP3, pro-caspase-1, caspase-1, pro-IL-1β, IL-1β, pro-IL-18, and IL-18. Monocytes were washed with cold PBS, and then total proteins were extracted from cells using a total protein extraction kit (KeyGEN, Nanjing, China) according to the manufacturer's instructions. After protein quantification using a BCA protein assay kit (KeyGEN, Nanjing, China), 80–100 µg of protein was heated to 95°C for 5 min. Denatured proteins were separated by 12% SDS-PAGE and then transferred to the nitrocellulose membrane. The membrane was blocked using a confining liquid (5% nonfat milk powder in TTBS) at 4°C overnight. The antibodies were incubated with the most suitable concentration for 4 h and then washed separately using TBST. The results were detected by ECL PlusTM Western blot detection reagents (KeyGEN, Nanjing, China). The amount of protein was determined by densitometry using LabWorks software (UVP, Upland, CA). The antibody for NLRP3 was from Abcam (ab17267), antibody for pro-caspase-1 and caspase-1 were from Sigma-Aldrich (C4851), antibody for pro-IL-1β (MAB6964), IL-1β (MAB201) and pro-IL-18 (MAB 646) were from R&D Systems, and antibody for IL-18 was from MBL (D043-3).
Statistical analysis
SPSS 17.0 software was used to analyze the statistical variability. Normal distribution measurement data were expressed as mean ± SD, and abnormal distribution measurement data were expressed as median (interquartile range). Differences among the groups were assessed by Student's t-test, one-way ANOVA and Wilcoxon (Kruskal-Wallis) test. Pearson correlation coefficient was used for correlation analysis. Multivariate stepwise regression analysis was used to evaluate the relationships between variables and NLRP3. Statistical significance was set at p < 0.05.
Results
Expression levels of NLRP3 and downstream cytokines in patients with different degrees of coronary artery disease
A coronary angiography was performed in all 71 patients with CAD. According to the clinical symptoms and coronary angiography results, patients with CAD were divided into two groups: the stable angina (SA) group and the acute coronary syndrome (ACS) group.
The basic characteristics of the control group, the SA group and the ACS group are shown in Table I. There is no significant difference regarding ages and body mass index (BMI) among the three groups; however, the percentages of SA and ACS patients with a history of hypertension and smoking were higher than those of the control group, which is not surprising. Table II shows the laboratory and angiographic characteristics of the three groups. Creatine kinase myocardial bound (CKMB), cardiac troponin (cTnI) and TG levels were higher in the ACS patients compared with the SA patients and control subjects. In addition, ACS patients had significantly lower high-density lipoprotein (HDL) compared with the SA patients and control subjects. However, the HDL level remained the same between control and SA subjects. In addition, white blood cells (WBC), mononuclear cells, urea, creatinine (Cre), total cholesterol (TC), low-density lipoprotein (LDL), alanine aminotransferase (AST), aspartate aminotransferase (ALT) and lactate dehydrogenase (LDH) did not differ among the three groups (Table II). The ACS patients had a significantly higher Gensini score compared to SA patients (Table II).
Table I.
Basic characteristics of the control group, stable angina group and acute coronary syndrome group
| Group | Number | Gender, n (%) | Age [year] | Hypertension (yes/no) | Smoke (yes/no) | BMI [kg/m2] | |
|---|---|---|---|---|---|---|---|
| Male | Female | ||||||
| Control | 20 | 11 (55.0) | 9 (45.0) | 57.85 ±10.29 | 7/13 | 5/15 | 26.96 ±4.67 |
| SA | 33 | 21 (63.6) | 12 (36.4) | 62.39 ±10.72 | 16/17 | 9/24 | 26.14 ±2.47 |
| ACS | 38 | 25 (66.8) | 13 (34.2) | 60.16 ±7.12 | 24/14 | 10/28 | 26.12 ±3.22 |
SA – stable angina, ACS – acute coronary syndrome
Table II.
Laboratory and angiographic characteristics of three groups
| Clinical characteristics | Control | SA | ACS |
|---|---|---|---|
| WBC [109/l] | 6.63 ±1.60 | 6.06 ±1.06 | 6.19 ±1.75 |
| Mononuclear cells [109/l] | 0.48 ±0.17 | 0.45 ±0.17 | 0.42 ±0.14 |
| Urea [mmol/l] | 5.87 ±2.61 | 6.02 ±1.53 | 5.93 ±1.82 |
| Cre [µmol/l] | 79.33 ±9.63 | 79.45 ±10.39 | 76.93 ±14.18 |
| cTnI [µg/l] | 0.02 ±0.03 | 0.01 ±0.01 | 1.31 ±3.85 |
| CK-MB [µg/l] | 0.62 ±0.58 | 0.84 ±0.29 | 3.40 ±5.70 |
| TC [mmol/l] | 4.49 ±0.79 | 4.26 ±1.30 | 4.77 ±0.87 |
| TG [mmol/l] | 1.67 ±0.65 | 1.40 ±0.33 | 2.08 ±1.21 |
| HDL [mmol/l] | 1.10 ±0.23 | 1.13 ±0.25 | 0.96 ±0.21 |
| LDL [mmol/l] | 2.75 ±0.64 | 2.52 ±1.09 | 2.97 ±0.79 |
| ALT [U/l] | 31.95 ±15.04 | 27.51 ±9.06 | 35.45 ±23.53 |
| AST [U/l] | 22.85 ±7.49 | 28.61 ±17.66 | 35.26 ±30.66 |
| LDH [U/l] | 160.65 ±28.11 | 177.69 ±21.83 | 190.01 ±68.09 |
| Gensini Score | 4.36 ±5.68 | 36.10 ±30.07 |
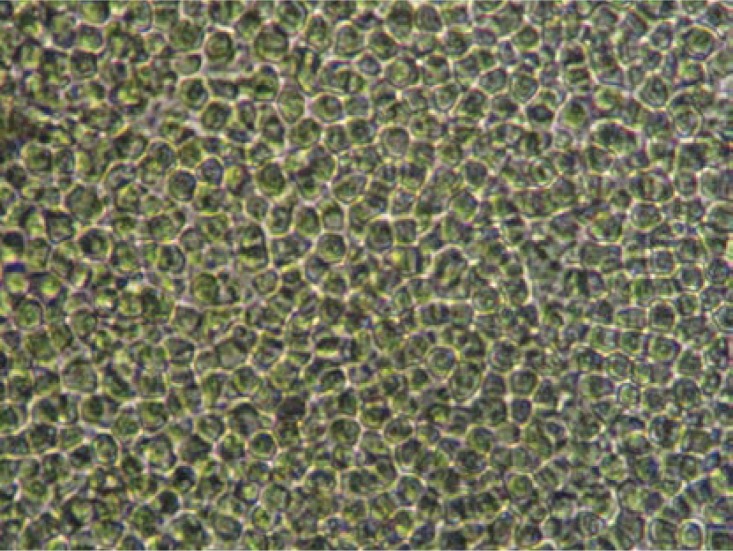
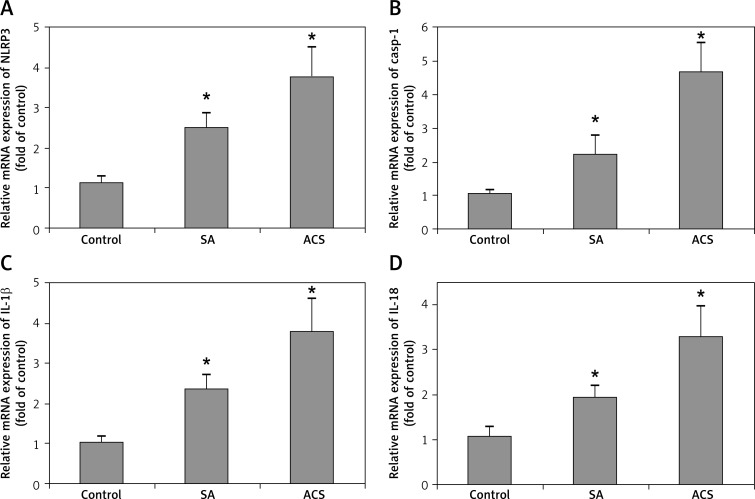
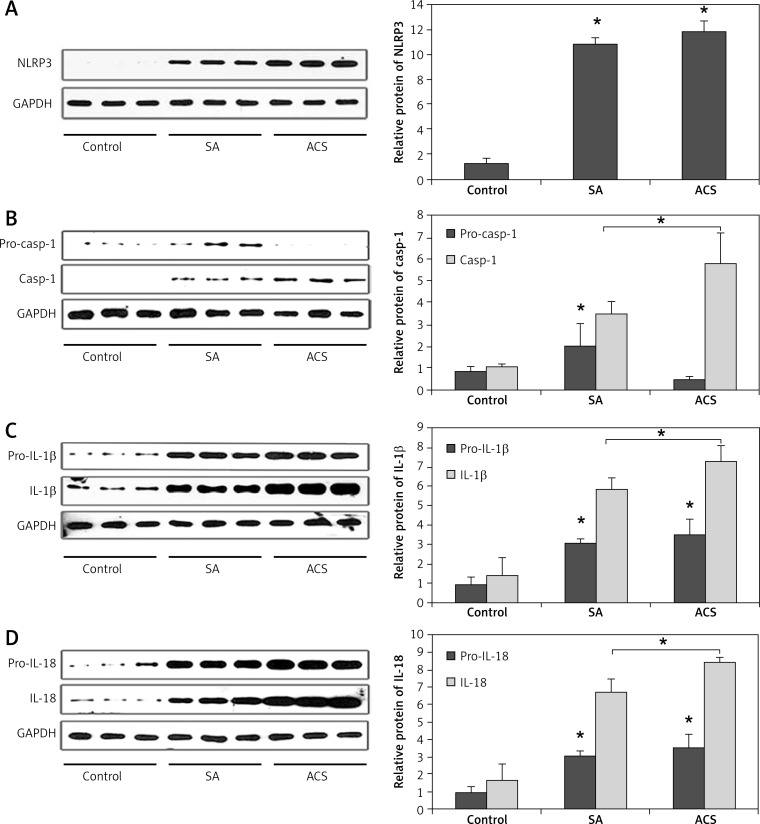
The morphology of human peripheral blood monocytes is shown in Figure 1 and the purity of monocytes is shown in Figure 2. The mRNA levels of NLRP3 and downstream cytokines including caspase-1, IL-1β and IL-18 were increased in patients with CAD compared with those of the control group. In addition, their mRNA levels were also higher in ACS compared with those of SA patients (Figure 3). Moreover, NLRP3 protein levels were also significantly increased in CAD patients compared with those of the controls though no significant difference was observed between those of SA and ACS groups (Figure 4A). To further understand the role of the NLRP3 inflammasome in CAD, the protein levels of downstream cytokines, including pro-caspase-1, caspase-1, pro-IL-1β, IL-1β, pro-IL-18 and IL-18 were also checked. Pro-caspase-1 protein level was significantly higher in SA patients than those of the other two groups, but the cleaved caspase-1 was significantly increased in ACS patients (Figure 4B). As inflammasome activation represents the second step in the generation of the cleaved bioactive caspase-1, these results indicated that the biological effects of the NLRP3 inflammasome enhanced and promoted the cleavage of pro-caspase-1 to caspase-1 in ACS. As shown in Figure 4C–D, pro-IL-1β and pro-IL-18 protein levels were also increased in CAD patients compared to the controls, and there was no significant difference between SA and ACS groups. Interestingly, the expression of IL-1β and IL-18 was significantly higher in the ACS than the SA group. As IL-1β and IL-18 are generated in monocytes and should be secreted into the extracellular space to exert a pro-inflammation role, we examined the plasma levels of IL-1β and IL-18. As shown in Figure 5, plasma IL-1β and IL-18 levels increased gradually along with the increasing severity of CAD.
Figure 1.
Morphology of human peripheral blood monocytes
Figure 2.
Purity of monocytes
Figure 3.
Relative mRNA expression level of NLRP3 and downstream cytokines in patients with different degrees of coronary artery disease. The mRNA expression level of NLRP3 (A), caspase-1 (B), IL-1β (C), and IL-18 (D)
*p < 0.05
Figure 4.
Relative protein expression level of NLRP3 and downstream cytokines in patients with different degrees of coronary artery disease. A – NLRP3 protein expression level was significantly increased in CAD patients compared to the control (p < 0.05), but there was no significant difference between SA and ACS patients. B – Procaspase- 1 protein expression was higher in SA patients than the other two groups, but the cleaved caspase-1 was significantly increased in ACS patients (p < 0.05). C – Pro-IL-1β protein expression level was significantly increased in SA and ACS groups compared to the control, there was no significant difference between SA and ACS groups, but the cleaved IL-1β was significantly higher in ACS patients compared to the SA group (p < 0.05). D – Pro-IL-18 protein expression level was also increased in CAD patients, there was no significant difference between SA and ACS groups, but the level of IL-18 was significantly higher in ACS patients compared to the SA group (p < 0.05)
*p < 0.05, significant difference. SA – stable angina, ACS – acute coronary syndrome
Figure 5.
Plasma IL-1β and IL-18 level in coronary artery disease. Plasma IL-1β (A) and IL-18 (B) concentration in the control, stable angina group, and acute coronary syndrome group
*p < 0.05, significant difference
These results showed that the expression of NLRP3 and downstream cytokines gradually increased along with the increasing severity of CAD, indicating that NLRP3 and downstream cytokines might be relevant for the severity of CAD.
Expression levels of NLRP3 and downstream cytokines at different time points in patients with acute myocardial infarction
Thirty patients with AMI were recruited in this study. The expression levels of NLRP3 and downstream cytokines were determined at four different time points: within 6 h after symptom onset (3.5 ±1.1 h), the acute phase at 48–72 h (57.0 ±9.4 h), the convalescence stage at 1 week (7 ±1 days), and the stable period at 4–6 weeks (5.1 ±0.7 weeks). The clinical characteristics of the AMI and control subjects are shown in Table III. No significant differences with respect to age, BMI, fasting blood glucose (FBG), TC, TG, HDL or LDL were observed between two groups.
Table III.
Clinical characteristics of acute myocardial infarction group and control group
| Parameter | Control (n = 20) | AMI (n = 30) |
|---|---|---|
| Gender (M/F) | 11/9 | 18/12 |
| Age [years] | 57.85 ±10.29 | 58.00 ±13.52 |
| BMI [kg/m2] | 26.96 ±4.67 | 25.27 ±7.42 |
| FBG [mmol/l] | 5.66 ±1.88 | 6.21 ±1.53 |
| TC [mmol/l] | 4.49 ±0.79 | 4.72 ±1.0 |
| TG [mmol/l] | 1.67 ±0.65 | 1.68 ±0.82 |
| HDL [mmol/l] | 1.10 ±0.23 | 1.00 ±0.25 |
| LDL [mmol/l] | 2.75 ±0.64 | 2.96 ±0.87 |
AMI – acute myocardial infarction
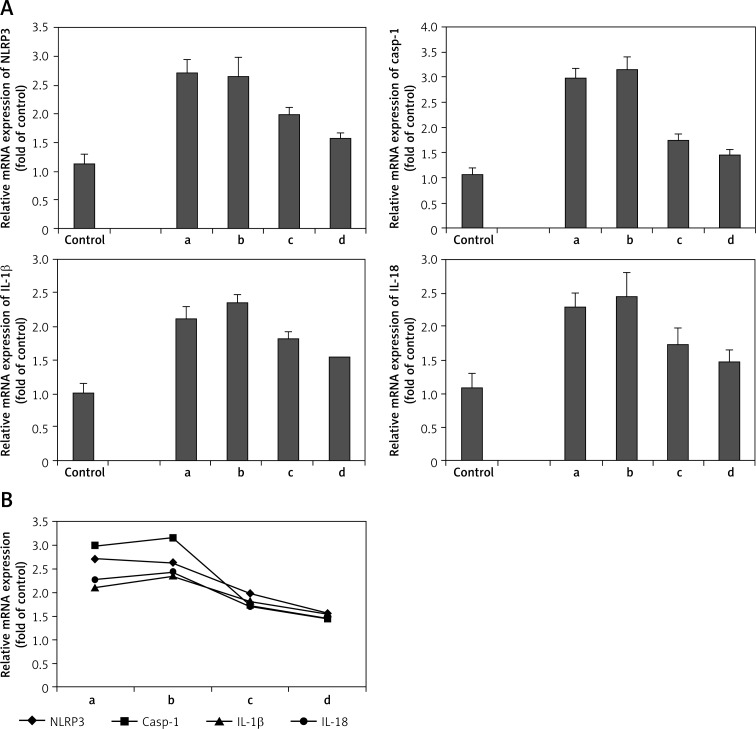
As shown in Figure 6A, the mRNA level of NLRP3 was gradually reduced along with the progress of AMI. At the fourth time point (4–6 weeks after symptom onset), the mRNA level of NLRP3 was the lowest; however, its level was still higher than that of the control (p < 0.05). The caspase-1, IL-1β and IL-18 mRNA levels had a peak at the second time point (48–72 h after symptom onset). They began to fall at 1 week and further decreased at the fourth time point. Despite these variations, the mRNA levels of caspase-1, IL-1β and IL-18 at the fourth time point were still higher than those of the controls (p < 0.05). Figure 6B shows the variation curve of each index.
Figure 6.
Relative mRNA expression level of NLRP3 and downstream cytokines at different time points of acute myocardial infarction patients. A – The mRNA expression level of NLRP3, caspase-1, IL-1β and IL-18. B – The variation curve of each index
a, b, c, d in figures mean the four time points observed in this study: a – within 6 h after symptom onset (3.5 ±1.1 h), b – acute phase at 48–72 h (57.0 ±9.4 h), c – convalescence stage at 1 week (7 ±1 days) and d – stable period at 4–6 weeks (5.1 ±0.7 weeks)
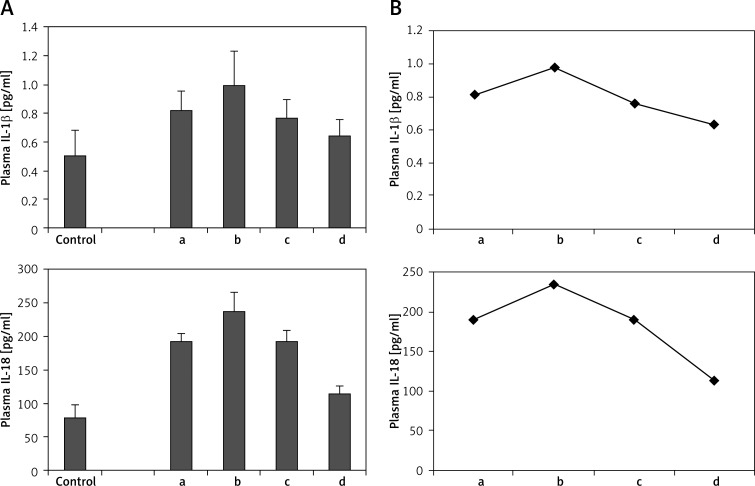
Plasma levels of IL-1β and IL-18 were examined at each time point of AMI patients. As shown in Figure 7A, plasma IL-1β and IL-18 levels also had a slight rise at the second time point (48–72 h after symptom onset). They began to fall at 1 week and further decreased at the fourth time point. The levels of plasma IL-1β and IL-18 at the fourth time point were still higher than those of the controls (p < 0.05). Figure 7B showed the variation curve of plasma IL-1β and IL-18.
Figure 7.
Plasma IL-1β and IL-18 level at different time points of acute myocardial infarction patients. A – Plasma IL-1β and IL-18 level. B – The variation curve of plasma IL-1β and IL-18
a, b, c, d in figures mean the four time points observed in this study: a – within 6 h after symptom onset (3.5 ±1.1 h), b – acute phase at 48–72 h (57.0 ±9.4 h), c – convalescence stage at 1 week (7 ±1 days) and d – stable period at 4–6 weeks (5.1 ±0.7 weeks)
These results showed that NLRP3 and downstream cytokines had a dynamic variation in AMI, indicating that NLRP3 and downstream cytokines might be involved in the acute inflammatory response of AMI.
Correlation and stepwise regression analysis
Pearson's correlation coefficient was used to analyze the correlation between clinical risk factors and NLRP3 expression. As shown in Table IV, the Gensini score was correlated with NLRP3 level (r = 0.516, p < 0.001). The downstream cytokines IL-1β and IL-18 were also correlated with NLRP3. The correlation coefficients were r = 0.454 (p = 0.001) and r = 0.461 (p = 0.001), respectively.
Table IV.
Pearson correlation coefficient between each index and NLRP3
| Index | r | Value of p |
|---|---|---|
| WBC | –0.050 | 0.726 |
| Mononuclear cells | –0.229 | 0.102 |
| Urea | 0.185 | 0.190 |
| Cre | –0.083 | 0.557 |
| CTNI | 0.154 | 0.277 |
| CKMB | 0.262 | 0.061 |
| TC | 0.179 | 0.204 |
| TG | 0.055 | 0.696 |
| HDL | –0.233 | 0.096 |
| LDL | 0.234 | 0.096 |
| ALT | 0.130 | 0.358 |
| AST | 0.106 | 0.452 |
| LDH | 0.183 | 0.195 |
| LVEF | –0.109 | 0.442 |
| Gensini score | 0.516 | < 0.001 |
| IL-1β | 0.454 | 0.001 |
| IL-18 | 0.461 | 0.001 |
Multivariate stepwise regression analysis was performed to determine the independent predictors of NLRP3. BMI, TC, TG, HDL, LDL, Gensini score and WBC were selected to be independent variables. The results showed that the model had the following values: R2 = 0.27, adjusted R2 = 0.251, normal fitting degree, F = 18.13, and p < 0.01. Overall, the model was proved to be successful. Gensini score was an independent predictor of NLRP3 (t = 4.26, p < 0.01).
These results indicated that NLRP3 might be relevant not only for the severity of CAD, but also for the severity of coronary atherosclerosis.
Discussion
The cytosolic pattern recognition receptor NLRs (NOD1, NOD2, NLRP3) mainly recognize exogenous pathogens that break through the cell membranes into the cells and the endogenous activator. Unlike NOD1 and NOD2, most of the ligands for NLRP3 are endogenous. The NLRP3 inflammasome can cause and maintain a chronic inflammatory response in sterile inflammation. It senses various microbial products and endogenous “danger signals” (damage-associated molecular patterns, DAMPs) such as cell necrosis composition, extracellular matrix components, hyaluronic acid, and uric acid salt crystallization to activate caspase-1, thereby initiating IL-1β and IL-18 processing, a key step in the innate immune response [11]. IL-1β and IL-18 were considered as a master switch of inflammation, which acted as mediators to promote the cascade release of other cytokines. IL-1β and IL-18 have been previously implicated in the pathogenesis of atherosclerosis [12–16].
The NLRP3 inflammasome has attracted considerable attention because of its involvement in the genesis of several human diseases and the availability of inhibitors of IL-1β that have been recently very successful in clinical trials with patients suffering from gout and type 2 diabetes [17]. It had been shown that in mice NLRP3 inflammasome activation promoted macrophage activation in adipose tissue and participated in the development of a chronic proinflammatory state which induces insulin resistance in obesity [18]. However, the role of the NLRP3 inflammasome in atherosclerosis is yet to be elucidated. Previous studies have reported that cholesterol crystals and oxidized low-density lipoprotein can activate the NLRP3 inflammasome in human macrophages and the THP-1 cell line [19], and might be involved in the early formation of atherosclerosis [20]. A recent study also reported that activation of NLRP3 inflammasome cholesterol clefts can participate in the early formation of atherosclerosis and silencing NLRP3 expression can reduce the degree of atherosclerosis in Apo-E-deficient mice [21], indicating that activation of the NLRP3 inflammasome is required for atherosclerosis formation. However, another report showed that the absence of key components of the NLRP3 inflammasome (NLRP3, ASC or caspase-1) did not influence atherosclerosis progression, infiltration of plaques by macrophages, or plaque stability in an Apo-E-deficient mouse model [22]. Therefore the role of NLRP3 in atherosclerosis is still controversial at present.
In the present study, we found that NLRP3 and downstream cytokines were correlated with the severity of CAD. In addition, NLRP3 level was also correlated with Gensini score, indicating that NLRP3 might be relevant not only for the severity of CAD, but also for the severity of coronary atherosclerosis. Observations on patients with AMI showed that the NLRP3 and downstream cytokines had a dynamic variation. The NLRP3 mRNA level peaked at the first time point, and as the condition became more stable, it gradually decreased. But the downstream cytokines including caspase-1, IL-1β and IL-18 had a peak at the second time-point (48–72 h after symptom onset), and they started to drop after about 1 week. Four to 6 weeks later, they decreased further. One question that emerged from our observations was why the mRNA level of NLRP3 did not have a peak like the downstream cytokines at the second time point (48–72 h after symptom onset) in AMI. The most reasonable explanation of the observed discrepancy between NLRP3 and downstream cytokines may be as follows. First, it is noteworthy that many other factors could influence the downstream cytokines, so there could be a synergistic effect of NLRP3 signaling and other factors mediated signaling. Secondly, NLRP3 needs to be transcribed and translated into protein, then assembled to be the inflammasome which has the biological effects. The peak of downstream cytokines at the second time point meant increasing the assembly of the inflammasome; however, the mRNA level of NLRP3 had not had a reaction in the acute phase yet, so the increase of mRNA of NLRP3 may lag far behind the change of the downstream cytokines. Thirdly, a negative feedback loop might exist, which means the increased expression of downstream cytokines might inhibit the transcription and translation of NLRP3. And lastly, we cannot rule out the possibility that NLRP3 expression was stimulated by myocardial ischemia and reperfusion (I/R) which had contributed to the sequential changes of NLRP3 mRNA level in AMI patients. In fact, recent reports showed that the NLRP3 inflammasome was involved in ischemic preconditioning (IPC) and acute I/R injury of the heart [14, 23].
This study was just an observation study regarding the NLRP3 inflammasome in patients with CAD. The mechanism underlying the phenomena was still speculative. It remains unclear whether the NLRP3 inflammasome participates directly in immune dysfunction leading to chronic inflammation or NLRP3 plays a role in sensing atherosclerosis-related ‘danger signals’. This question is difficult to answer. We suspect that in the early stage of CAD, substances such as cholesterol clefts may directly activate the NLRP3 inflammasome to undergo a chronic inflammatory response and participate in the early stage of atherosclerosis. With the progression of the disease, atherosclerosis can modify NLRP3 as well as other signaling pathways and will eventually cause the vascular lumen to become narrow or even blocked, making cardiomyocytes exposed to ischemic and anoxic conditions, initiating the acute inflammatory response, increasing membrane permeability and inducing ion fluxes in cardiomyocytes, resulting in ion transport especially with the efflux of potassium [24]. Ion fluxes and potassium efflux in particular are the most extensively documented signals reported to induce activation of the NLRP3 inflammasome [25, 26]. In addition, when cardiomyocytes become ischemic and hypoxic or even necrotic in acute ischemic events, a lot of toxic substances including reactive oxygen species (ROS) are generated during prolonged ischemia and subsequent reperfusion [27, 28], which can further regulate the assembly and activation of the NLRP3 inflammasome [29–32]. The activated NLRP3 inflammasome further promotes the secretion of IL-1β and IL-18, and hence increases the systemic inflammation, which mediates further damage and promotes adverse cardiac remodeling. Therefore, the NLRP3 inflammasome may not only participate in the chronic inflammation for early formation of atherosclerosis, but also act as a downstream effector to be further activated in the acute phase of myocardial infarction.
To the best of our knowledge, this study is the first to report an increase of the NLRP3 inflammasome in patients with CAD and also confirms the role of the NLRP3 inflammasome in atherosclerosis. This study will provide a new theoretical basis for the innate immune system participating in atherosclerosis development and highlights the potential of the NLRP3 inflammasome as a target for prevention and treatment of CAD.
References
- 1.Libby P, Ridker PM. Inflammation and atherosclerosis. Circulation. 2002;105:1135–43. doi: 10.1161/hc0902.104353. [DOI] [PubMed] [Google Scholar]
- 2.Hansson GK, Libby P. The immune response in atherosclerosis: a double-edged sword. Nat Rev Immunol. 2006;6:508–19. doi: 10.1038/nri1882. [DOI] [PubMed] [Google Scholar]
- 3.Lundberg AM, Hansson GK. Innate immune signals in atherosclerosis. Clin Immunol. 2010;134:5–24. doi: 10.1016/j.clim.2009.07.016. [DOI] [PubMed] [Google Scholar]
- 4.Hartvigsen K, Chou MY. The role of innate immunity in atherogenesis. J Lipid Res. 2009;(50 Suppl):S388–93. doi: 10.1194/jlr.R800100-JLR200. [DOI] [PMC free article] [PubMed] [Google Scholar]
- 5.Akira S, Uematsu S. Pathogen recognition and innate immunity. Cell. 2006;124:783–801. doi: 10.1016/j.cell.2006.02.015. [DOI] [PubMed] [Google Scholar]
- 6.Cassel SL, Joly S. The NLRP3 inflammasome: a sensor of immune danger signals. Semin Immunol. 2009;21:194–8. doi: 10.1016/j.smim.2009.05.002. [DOI] [PMC free article] [PubMed] [Google Scholar]
- 7.Tangi TN, Elmabsout AA. Role of NLRP3 and CARD8 in the regulation of TNF-alpha induced IL-1beta release in vascular smooth muscle cells. Int J Mol Med. 2012;30:697–702. doi: 10.3892/ijmm.2012.1026. [DOI] [PubMed] [Google Scholar]
- 8.Rajamaki K, Lappalainen J. Cholesterol crystals activate the NLRP3 inflammasome in human macrophages: a novel link between cholesterol metabolism and inflammation. PLoS One. 2010;5:e11765. doi: 10.1371/journal.pone.0011765. [DOI] [PMC free article] [PubMed] [Google Scholar]
- 9.Gensini GG. A more meaningful scoring system for determining the severity of coronary heart disease. Am J Cardiol. 1983;51:606. doi: 10.1016/s0002-9149(83)80105-2. [DOI] [PubMed] [Google Scholar]
- 10.Davies JQ, Gordon S. Isolation and culture of human macrophages. Methods Mol Biol. 2005;290:105–16. doi: 10.1385/1-59259-838-2:105. [DOI] [PubMed] [Google Scholar]
- 11.Masters SL, Simon A. Horror autoinflammaticus: the molecular pathophysiology of autoinflammatory disease. Annu Rev Immunol. 2009;27:621–68. doi: 10.1146/annurev.immunol.25.022106.141627. [DOI] [PMC free article] [PubMed] [Google Scholar]
- 12.Ait-Oufella H, Taleb S. Recent advances on the role of cytokines in atherosclerosis. Arterioscler Thromb Vasc Biol. 2011;31:969–79. doi: 10.1161/ATVBAHA.110.207415. [DOI] [PubMed] [Google Scholar]
- 13.Ragino YI, Chernyavski AM. Activity of the inflammatory process in different types of unstable atherosclerotic plaques. Bull Exp Biol Med. 2012;153:186–9. doi: 10.1007/s10517-012-1672-1. [DOI] [PubMed] [Google Scholar]
- 14.Yu M, Wen N. Effect of repeated ischaemic preconditioning on TLR4 and proinflammatory cytokines TNF-alpha and IL-1beta in myocardial ischaemia-reperfusion injury in a rat model. Arch Med Sci. 2010;6:843–7. doi: 10.5114/aoms.2010.19289. [DOI] [PMC free article] [PubMed] [Google Scholar]
- 15.Jawień J, Olszanecki R. Apolipoprotein E knockout mice: an experimental model to study inflammatory mechanisms of atherosclerosis and to screen a putative anti-atherogenic properties of drugs. Centr Eur J Immunol. 2012;37:36–44. [Google Scholar]
- 16.Göçmen AY, Gűműslű S. Paraoxonase-1 activity and the levels of lipids and lipid peroxidation markers in arterial versus venous blood samples in coronary angiography patients. Postep Kardiol Inter. 2012;9:199–204. [Google Scholar]
- 17.Dinarello CA. Anti-inflammatory agents: present and future. Cell. 2010;140:935–50. doi: 10.1016/j.cell.2010.02.043. [DOI] [PMC free article] [PubMed] [Google Scholar]
- 18.Bolormaa V, Yun HY. The NALP3/NLRP3 inflammasome instigates obesity-induced autoinflammation and insulin resistance. Nat Med. 2011;17:179–88. doi: 10.1038/nm.2279. [DOI] [PMC free article] [PubMed] [Google Scholar]
- 19.Jiang YG, Wang M. Oxidized low-density lipoprotein induces secretion of interleukin-1beta by macrophages via reactive oxygen species-dependent NLRP3 inflammasome activation. Biochem Biophys Res Commun. 2012;425:121–6. doi: 10.1016/j.bbrc.2012.07.011. [DOI] [PubMed] [Google Scholar]
- 20.Connat JL. Inflammasome and cardiovascular diseases. Ann Cardiol Angiol. 2011;60:48–54. doi: 10.1016/j.ancard.2010.07.011. [DOI] [PubMed] [Google Scholar]
- 21.Duewell P, Kono H. NLRP3 inflammasomes are required for atherogenesis and activated by cholesterol crystals. Nature. 2010;464:1357–61. doi: 10.1038/nature08938. [DOI] [PMC free article] [PubMed] [Google Scholar]
- 22.Menu P, Pellegrin M, Aubert JF, et al. Atherosclerosis in ApoE-deficient mice progresses independently of the NLRP3 inflammasome. Cell Death and Disease. 2011;2:e137. doi: 10.1038/cddis.2011.18. [DOI] [PMC free article] [PubMed] [Google Scholar]
- 23.Zuurbier CJ, Jong WM. Deletion of the innate immune NLRP3 receptor abolishes cardiac ischemic preconditioning and is associated with decreased IL-6/STAT3 signaling. PLoS One. 2012;7:e40643. doi: 10.1371/journal.pone.0040643. [DOI] [PMC free article] [PubMed] [Google Scholar]
- 24.Pogorelov AG, Pogorelova VN. Electron probe microanalysis of potassium, sodium, and chlorine levels in the cardiomyocyte cytoplasm during acute ischemia. Biofizika. 2010;55:875–9. [PubMed] [Google Scholar]
- 25.Schorn C, Frey B. Sodium overload and water influx activate the NALP3 inflammasome. J Biol Chem. 2011;286:35–41. doi: 10.1074/jbc.M110.139048. [DOI] [PMC free article] [PubMed] [Google Scholar]
- 26.Petrili V, Papin S. Activation of the NALP3 inflammasome is triggered by low intracellular potassium concentration. Cell Death Differ. 2007;14:1583–9. doi: 10.1038/sj.cdd.4402195. [DOI] [PubMed] [Google Scholar]
- 27.Vanden Hoek TL, Becker LB. Reactive oxygen species released from mitochondria during brief hypoxia induce preconditioning incardiomyocytes. J Biol Chem. 1998;273:18092–8. doi: 10.1074/jbc.273.29.18092. [DOI] [PubMed] [Google Scholar]
- 28.Sun HY, Wang NP. Hypoxic postconditioning reduces cardiomyocyte loss by inhibiting ROS generation and intracellular Ca2+ overload. Am J Physiol Heart Circ Physiol. 2005;288:H1900–8. doi: 10.1152/ajpheart.01244.2003. [DOI] [PubMed] [Google Scholar]
- 29.Rubartelli A. Redox control of NLRP3 inflammasome activation in health and disease. J Leukoc Biol. 2012;92:951–8. doi: 10.1189/jlb.0512265. [DOI] [PubMed] [Google Scholar]
- 30.Zhou R, Yazdi AS. A role for mitochondria in NLRP3 inflammasome activation. Nature. 2011;469:221–5. doi: 10.1038/nature09663. [DOI] [PubMed] [Google Scholar]
- 31.Segovia J, Sabbah A. TLR2/MyD88/NF-kappaB pathway, reactive oxygen species, potassium efflux activates NLRP3/ASC inflammasome during respiratory syncytial virus infection. PLoS One. 2012;7:e29695. doi: 10.1371/journal.pone.0029695. [DOI] [PMC free article] [PubMed] [Google Scholar]
- 32.Jin C, Frayssinet P. NLRP3 inflammasome plays a critical role in the pathogenesis of hydroxyapatite-associated arthropathy. Proc Natl Acad Sci U S A. 2011;108:14867–72. doi: 10.1073/pnas.1111101108. [DOI] [PMC free article] [PubMed] [Google Scholar]


