Abstract
MEME-ChIP is a web-based tool for analyzing motifs in large DNA or RNA data sets. It can analyze peak regions identified by ChIP-seq, cross-linking sites identified by cLIP-seq and related assays, as well as sets of genomic regions selected using other criteria. MEME-ChIP performs de novo motif discovery, motif enrichment analysis, motif location analysis and motif clustering, providing a comprehensive picture of the DNA or RNA motifs that are enriched in the input sequences. MEME-ChIP performs two complementary types of de novo motif discovery: weight matrix–based discovery for high accuracy; and word-based discovery for high sensitivity. Motif enrichment analysis using DNA or RNA motifs from human, mouse, worm, fly and other model organisms provides even greater sensitivity. MEME-ChIP’s interactive HTML output groups and aligns significant motifs to ease interpretation. this protocol takes less than 3 h, and it provides motif discovery approaches that are distinct and complementary to other online methods.
INTRODUCTION
MEME-ChIP1 is a web-based tool for motif-based sequence analysis of large-scale DNA or RNA data sets. It provides computationally efficient algorithms for discovering and analyzing the sequence motifs characteristic of transcription factor (TF) binding sites, RNA-binding protein (RBP) binding sites and promoter elements. Given a set of nucleotide sequences, MEME-ChIP executes two different motif discovery algorithms (multiple EM for motif elicitation (MEME)2 and discriminative regular expression motif elicitation (DREME)3) to discover novel sequence motifs. It then uses a motif enrichment analysis algorithm (central motif enrichment analysis or CentriMo4) to detect enrichment of previously characterized functional motifs for TF or RBP binding sites in the sequences. Finally, to ease interpretation of the results, MEME-ChIP applies a clustering algorithm to group the discovered and enriched motifs by similarity to each other. MEME-ChIP returns its results as an interactive HTML document that gives a complete overview of the motif content of the DNA or RNA input sequences. All results are presented in groups sorted according to statistical significance, and the HTML document provides clickable links to all details of the individual analyses.
The primary audience for this protocol is biologists who use the data generated by chromatin immunoprecipitation coupled with high-throughput DNA sequencing (ChIP-seq) or one of the many variants of the cross-linking immunoprecipitation coupled with high-throughput sequencing (CLIP-seq) protocol to explore the mechanisms and functions of protein binding to chromatin or RNA sequences, respectively. When applied to ChIP-seq or CLIP-seq data, this protocol can confirm the success (or failure) of the experiment, discover the DNA or RNA sequence patterns (motifs) describing the binding affinity of the protein, identify proteins with similar binding affinities to the immunoprecipitated factor, identify other proteins that may bind nearby or in competition with the immunoprecipitated factor, infer co-binding protein complexes and uncover preferred arrangements of the motifs. Biologists who study gene expression by using RNA-seq can also use the protocol to identify motifs enriched in the promoters (or near splice junctions, in 3′ UTRs, and so on) of sets of differentially expressed genes. We illustrate the protocol by analyzing and interpreting the results of MEME-ChIP applied to published ChIP-seq5 and CLIP-seq data6.
MEME-ChIP can be used to identify motifs associated with functional DNA or RNA elements in sequences obtained by numerous types of high-throughput sequencing assays. These assays, along with the types of biological insights that can be produced by using MEME-ChIP, are described in Box 1.
Box 1. Assays that produce DNA or RNA data amenable to MEME-ChIP analysis.
ChIP-seq, ChIP-exo and DamID-seq
ChIP-seq maps the binding sites of a protein of interest (e.g., TF) to the genome. ChIP-exo, a modification of the ChIP-seq protocol, improves the resolution of binding sites from hundreds of base pairs to a single base pair31. DNA adenine methyltransferase identification (DamID) is an alternative method that maps the binding sites of DNA- and chromatin-binding proteins32. Unlike ChIP, DamID does not require a specific antibody against the protein of interest. By using ChIP-based or DamID-based experiments, biologists can obtain a set of peak regions that represent the interaction loci between the studied TF and DNA. Motif analysis in the peak regions can confirm success (or failure) of the experiment if a motif for the assayed binding protein is known. MEME-ChIP provides over 30 motif databases containing most known DNA- or RNA-binding motifs. MEME-ChIP’s motif databases include DNA and RNA motifs assayed by using in vitro approaches (e.g., SELEX33, protein binding microarray18, competitive RNA binding21) and in vivo motifs (e.g. JASPAR17). If the binding motif of the assayed factor is unknown, then MEME-ChIP can discover it as well as those of other proteins that cooperate or compete with it. In addition, motif analysis of TSS regions near TF peaks or in TF peak regions that do not overlap TSSs can identify motifs and associated factors with proximal-promoter or distal regulatory functions, respectively.
CLIP-seq, HITS-CLIP, PAR-CLIP, iCLIP
CLIP-seq, also known as HITS-CLIP, screens for cross-linking sites between RBPs and RNA molecules via UV-cross-linking and immunoprecipitation34,35. CLIP-seq can be used to simultaneously identify miRNAs and their mRNA targets when immunoprecipitation of the Argonaute RBP is used36. Photoactivatable ribonucleoside-enhanced CLIP-seq (PAR-CLIP), a variant of CLIP-seq, incorporates photoactivatable nucleotide analogs such as 4-thiouridine or 6-thioguanosine into nascent RNA transcripts that can be efficiently cross-linked with UVA light of 365 nm. More importantly, the presence of these nucleotide analogs leads to a base transition at the cross-linking sites during reverse transcription, and this mutation can be used to pinpoint cross-linking sites. PAR-CLIP has been applied to identify cross-linking sites of RBPs and ribonucleoprotein complexes37. Another alternative CLIP-based method is individual-nucleotide-resolution CLIP (iCLIP), which determines the exact location of cross-linking sites by leveraging the observation that reverse transcriptase frequently stops at cross-linking sites38. Bioinformatics analysis of CLIP-seq, HITS-CLIP or PAR-CLIP data can identify cross-linking sites of the RBP at near single-nucleotide resolution39. Motif-based analysis of the sequence regions surrounding cross-linking sites can characterize the sequence specificity and length of the binding motif of the RBP. Further motif analysis of the set of mRNAs targeted by the RBP (e.g., analysis of their 3’ UTRs) can reveal other elements involved in the regulation of translation.
DNase-seq, FAIRE-seq and Sono-seq
DNase I digestion followed by sequencing (DNase-seq) identifies potential regulatory regions by mapping open chromatin regions that are hypersensitive to cleavage by DNase I (ref. 40). Similarly, formaldehyde-assisted isolation of regulatory elements followed by sequencing (FAIRE-seq) assays for chromatin accessibility based on the fact that formaldehyde cross-linking is more efficient in nucleosome-bound DNA than it is in nucleosome-depleted regions of the genome41. Sonication followed by sequencing (Sono-seq) relies on the increased sonication efficiency of open cross-linked chromatin to identify regions of increased accessibility genome wide42. Thus, all three of these methods assay for chromatin accessibility. A subsequent motif analysis in the identified open chromatin regions can identify regulatory elements and complexes that are enriched in the given cell type and condition.
RNA-seq
RNA sequencing (RNA-seq) quantifies the transcriptome43. When two transcriptomes are compared, groups of differentially expressed genes are often regulated via the same TFs. Motif-based analysis of regions around the TSSs of these genes can reveal the identities of these regulatory proteins as well as their activities and mechanisms.
4C, 5C, ChIA-PET and Hi-C
Chromosome conformation capture (3C) assays and related methods, including chromosome conformation capture-on-chip (4C), chromosome conformation capture carbon copy (5C), chromatin interaction analysis by paired-end tag sequencing (ChIA-PET) and Hi-C, investigate the chromatin conformation among multiple target loci or even in the entire genome. These methods can also be used to discover interactions between promoters and novel distal regulatory enhancers44. Motif analysis in the identified enhancer regions can help to discover the identities of the proteins that are involved in such long-range regulations.
Development
The first goal in developing MEME-ChIP was to facilitate the use of the motif-based sequence analysis tools of the MEME Suite (Boxes 2 and 3) with the large data sets now produced by protocols based on high-throughput sequencing. These MEME Suite tools have been developed and improved over the past 20 years and are extremely widely used, with over 7,000 Google Scholar citations as of this writing.
Box 2. Software components of MEME-ChIP.
The core of MEME-ChIP consists of algorithms for de novo motif discovery, motif enrichment and motif comparison. MEME-ChIP uses the central 100 bp of each sequence as input to its motif discovery algorithms (MEME and DREME) and the full-length sequences as input to its motif enrichment algorithm (CentriMo). MEME-ChIP compares motifs by using the Tomtom algorithm.
MEME2 discovers motifs in DNA, RNA and protein sequences, although in this protocol we only analyze DNA and RNA sequences. MEME represents motifs as PWMs, which describe the probability of each possible letter at each position in the pattern. MEME uses statistical modeling techniques to automatically choose the best width, number of occurrences and description for each motif. MEME is able to find relatively long motifs and hence is good for finding the motif of the immunoprecipitated protein and motifs corresponding to multi-protein complexes. If there are more than 600 sequences in its input, MEME-ChIP runs MEME on a randomly-chosen subset of 600 of them. Future versions of MEME-ChIP will provide an option (under ‘MEME options’) for using the first 600 sequences to MEME rather than a random subset, which will be useful if the sequences in the input FASTA are sorted in order of decreasing confidence.
DREME3 discovers short (up to 8 bp) motifs in DNA, RNA and protein sequences. DREME is computationally efficient and thus suitable for finding relatively short monomeric motifs and finding multiple motifs in short sequences, which may correspond to co-binding factors. DREME achieves its high speed by restricting its search to regular expressions based on the IUPAC alphabet representing bases and ambiguous characters, and by using a heuristic estimate of generalized motif statistical significance. DREME is therefore more sensitive than MEME, at the expense of failing to find longer motifs. MEME-ChIP runs DREME on all sequences in its input.
CentriMo4 evaluates whether a given set of motifs are positionally enriched within a set of sequences. CentriMo provides a visualization of the positional distribution of a motif and calculates the statistical significance of the motif’s positional enrichment. MEME-ChIP uses CentriMo to analyze all de novo discovered motifs as well as all known motifs in the database of motifs chosen by the user. With ChIP-seq and CLIP-seq, CentriMo helps to confirm the primary motif of the immunoprecipitated protein and to infer secondary motifs of possible cooperating factors.
Tomtom45 performs pair-wise comparisons between motifs. MEME-ChIP uses Tomtom to compare all de novo−discovered motifs with the known motifs in a user-selected compendium to help identify the proteins involved in the binding. MEME-ChIP also uses Tomtom to group all discovered and enriched motifs according to their similarity to each other.
Box 3. Motif statistical significance assessments.
MEME-ChIP combines several motif discovery and analysis tools as listed in Box 2. Here we explain how the statistical significance of each motif is calculated by each of these tools.
MEME reports the estimated statistical significance of a motif as an E-value. It also reports the log likelihood ratio, information content and relative entropy of each discovered motif.
The E-value is an estimate of the expected number of motifs with the given log likelihood ratio (or higher) and with the same width and site count that one would find in a similarly sized set of random sequences. (In random sequences, each position is independent with letters chosen according to the background letter frequencies.)
The log likelihood ratio is the logarithm of the ratio of probability of the occurrences of the motif given the motif model (likelihood given the motif) versus their probability given the background model (likelihood given the null model). (Normally, the background model is a zero-order Markov model that uses the background letter frequencies, but higher-order Markov models may be specified via the ‘-bfile’ option to MEME.)
The information content of the motif in bits is equal to the sum of the uncorrected information content in the columns of the logo. This is equal relative entropy of the motif relative to a uniform background frequency model.
The relative entropy of the motif is computed in bits and is relative to the background letter frequencies given in the command line summary. It is equal to the log-likelihood ratio (llr) divided by the number of contributing sites of the motif times 1/ln(2), re = llr/(sites × ln(2)).
DREME reports the estimated statistical significance of discovered motifs by using P values, E-values and ‘unerased’ E-value of the Fisher’s exact test.
The P value is computed by a Fisher’s exact test for enrichment of the motif in the positive sequences. Note that the counts used in the Fisher’s exact test are made after erasing sites that match previously found motifs.
The E-value is the motif P value times the number of candidate motifs tested. Note that the P value was calculated with counts made after erasing sites that match previously found motifs.
The unerased E-value is the E-value of the motif calculated without erasing the sites of previously found motifs.
CentriMo reports the estimated statistical significance of discovered motifs by using P values and E-values derived from a one-tailed binomial test or the Fisher’s exact test.
P value: The probability that any tested region would be as enriched for best matches to this motif as the reported region is. By default, the P value is calculated by using the one-tailed binomial test on the number of sequences with a match to the motif (Total Matches’) that have their best match in the reported region (‘Region Matches’), corrected for the number of regions and score thresholds tested (‘Multiple Tests’). The test assumes that the probability of the best match in a sequence falling in the region is the region width divided by the number of places a motif can align in the sequence (sequence length - motif width + 1).
E-value: The expected number of motifs that would have at least one region as enriched for best matches to the motif as the reported region. The E-value is the P value multiplied by the number of motifs in the input database(s).
Tomtom reports the significance of a motif match by using the following scores.
P value: The probability that the match occurred by chance according to the null model.
E-value: The expected number of false positives in the matches up to this point.
q value: The minimum false discovery rate required to include the match.
The second goal was to improve the utility of the tools by combining their results in a synergistic way. To this end, MEME-ChIP uses two de novo motif discovery algorithms with complementary strengths and weaknesses: MEME2 is highly specific but slower, whereas DREME3 is less specific but faster. The algorithms are coupled with a motif enrichment algorithm, CentriMo4, which is highly sensitive but operates only on previously identified motifs. MEME-ChIP synthesizes the results of these three algorithms by clustering the discovered and enriched motifs according to their similarity.
The final goal in developing MEME-ChIP was to enable motif-based analysis of large data sets via a free (for academic use) web portal. This goal was accomplished through the development of a MEME-ChIP web interface that executes a command-line application running on a MEME Suite server (http://meme.nbcr.net or http://meme.ebi.edu.au). Providing a web interface greatly reduces the need for computer and systems management expertise on the part of the user.
Comparison with other methods
A number of software tools for the motif-based analysis of large DNA and RNA sequence data sets are available for use via web servers, and we survey the features of eight of the most comprehensive tools in Table 1. We focus only on analysis tools that can be run directly via a web interface and that do not require any software installation by the user because this substantially reduces the amount of computer expertise required of the user. The available tools have many overlapping features, as well as complementary strengths and weaknesses, and it is advisable to perform parallel analyses by using two or more of the tools listed in Table 1.
TABLE 1.
Features of web-based tools for motif-based analysis of ChIP-seq and CLIP-seq data.
| Capability | MeMe-chIp1 | Peak motifs11 |
ChIpMunk7 | Complete Motifs8 |
CisFinder29 | W-chIpMotifs9 | PscanchIp10 | XXmotif30 |
|---|---|---|---|---|---|---|---|---|
| Input size limit | 50 Mb | None | 200 Kb | 500 Kb | 50 Mb | 600 Kb | None | 25 Mb |
| Any genome | √ | √ | √ | √ | √ | √ | ||
| ChIP-seq analysis | √ | √ | √ | √ | √ | √ | √ | √ |
| CLIP-seq analysis | √ | √ | √ | |||||
| PWM-based motif discovery | √ | √ | √ | √ | √ | √ | ||
| Word-based motif discovery | √ | √ | √ | √ | ||||
| Differential motif discovery | √ | √ | √ | √ | ||||
| Motif enrichment analysis (new motifs) |
√ | √ | ||||||
| Motif enrichment analysis (known motifs) |
√ | √ | √ | |||||
| Motif comparison | √ | √ | √ | √ | ||||
| Motif grouping/clustering | √ | √ | √ | √ | ||||
| Motif positional distribution in sequences |
√ | √ | √ | √ | √ | |||
| Integrated output | √ | √ | √ | √ | √ | √ | ||
| Sequence composition analysis | √ | |||||||
| Export sites to genome browser |
√ | √ | ||||||
| Sequence retrieval | √ | √ | √ | |||||
| Stand-alone version available | √ | √ | √ | √ |
The table summarizes the features and limitations of some currently available web-based tools for analyzing large DNA or RNA data sets. Features and restrictions are different for stand-alone versions of the tools (when available). The URLs of the listed web tools are as listed below:
peak-motifs: http://rsat.ulb.ac.be/peak-motifs_form.cgi
ChIPMunk: http://autosome.ru/ChIPMunk
completeMotifs: http://cmotifs.tchlab.org
CisFinder: http://lgsun.grc.nia.nih.gov/CisFinder
W-ChIPMotifs: http://motif.bmi.ohio-state.edu/ChIPMotifs
PscanChIP: http://www.beaconlab.it/pscan_chip_dev
XXmotif: http://xxmotif.genzentrum.lmu.de
Three of the analysis tools in Table 1 (ChIPMunk7, complete-Motifs8 and W-ChIPMotifs9) limit the size of the input sequences to less than 25 Mb, which restricts their use somewhat due to the large size of many ChIP-seq data sets. The web-based versions of those three tools currently cannot accept the ChIP-seq study case presented in this protocol due to this restriction. Two of the tools (W-ChIPMotifs and PscanChIP10) currently limit their analyses to sequences from the mouse or human genomes, greatly limiting their applicability. Finally, five of the web-based tools listed in the table have restricted utility for analyzing CLIP-seq (and related) data sets because they don’t provide an option for single-stranded (RNA) motif analysis and don’t provide known RNA motifs for comparison with discovered motifs or motif enrichment analysis. MEME-ChIP has none of the above limitations.
The web-based tools listed in Table 1 offer a spectrum of motif-based analyses including several types of de novo motif discovery and motif enrichment analysis. Motif discovery and motif enrichment analysis are highly complementary approaches, and MEME-ChIP is unique in performing both in a single analysis run. Several of the tools listed in Table 1 (including MEME-ChIP) integrate position weight matrix (PWM)-based and word-based motif discovery approaches, which also have complementary strengths and weaknesses. The peak-motifs software11 uses up to four different word-based de novo motif discovery approaches. The peak-motifs tool can also discover motifs with differential enrichment in two sets of sequences, something not currently supported by MEME-ChIP.
Many of the tools shown in Table 1 compare discovered motifs with each other to identify redundant motifs, or compare discovered motifs with known motifs to provide additional information about the discovered motifs. Some of the tools also group the discovered motifs in order to simplify human interpretation of the analysis results. Grouping motifs by similarity is especially useful with tools that use more than one motif discovery algorithm, which tends to produce many similar, overlapping motifs. Among the tools listed in the table, MEME-ChIP is unique in grouping by similarity all new and known motifs that it identifies in its integrated report.
Many of the available web-based tools (including MEME-ChIP) produce an output report that integrates the various analyses they have performed. This is an important usability feature and can greatly aid the user in navigating and interpreting motif-based analyses. The peak-motifs analysis tool is unique in including an analysis of the base and dinucleotide content of the input sequences. Its integrated output report also can create BED files that can be displayed in genome browsers. The peak-motifs tool is also the only tool that can perform genomic sequence retrieval from an input BED file for almost any organism; PscanChIP is currently limited to retrieving sequences for the mouse and human genomes; and completeMotifs provides the mouse, human and rat genomes.
Limitations
Required expertise
To get the full benefit of MEME-ChIP, some experience in interpreting its output is required. The purpose of this protocol is to provide this expertise via a guided tour of the interpretation of ChIP-seq and CLIP-seq analyses. We strongly recommend that readers actually perform the two study cases we provide (see below) and read the ANTICIPATED RESULTS section while viewing the MEME-ChIP output. Alternatively, you can view the actual MEME-ChIP outputs for the two study cases at http://ebi.edu.au/ftp/software/MEME/MEME-ChIP_Study_Cases.
Optimizing parameters
MEME-ChIP provides some control over the parameters used in motif discovery (MEME and DREME options) and in motif enrichment analysis (CentriMo options). Although we have found the default parameters to generally be satisfactory, it is sometimes worthwhile to vary these parameters and rerun the MEME-ChIP analysis. Although your biological knowledge can guide this search (e.g., motif width limits can be set to the expected size of the DNA- or RNA-binding motif), some trial and error may be necessary to achieve optimum results.
Equal-length sequences
Many ChIP-seq peak callers report ‘peak regions’ of variable length that can be directly utilized by some other motif-based analysis tools (e.g., peak-motifs, see ‘Comparison with other methods’ section above). MEME-ChIP is designed to work with equal-length DNA or RNA sequences, and we strongly recommend using it in this way. We have not seen any evidence that this approach ever produces inferior analysis results.
Limitations on sequence length and number
The MEME-ChIP web server supports analysis of data sets of up to 50 Mb, but it performs some of its analyses on subsets of these data. Most notably, it performs motif discovery (using MEME and DREME) on the central 100 bp of sequences, and MEME uses only 600 sequences. Using the central 100 bp works very well with ChIP-seq and CLIP-seq data, but a different length may be preferable for other applications. The sampling of 600 sequences for MEME is necessary to limit CPU usage per MEME-ChIP job on the (free) web server. If you wish to change either of these aspects of MEME-ChIP, you can do so if you install and run MEME-ChIP on your own computer (Box 4).
Box 4. Running MEME-ChIP on your own computer.
MEME-ChIP (as well as other tools in the MEME Suite) can be executed from the command line on your own computer. Doing so allows you to run larger jobs, have finer control over the MEME-ChIP parameters and include MEME-ChIP in an automated pipeline (e.g., when rerunning MEME-ChIP with a range of parameters). In addition, installing the MEME Suite will provide you with many additional programs for manipulating FASTA input files and motif files in different formats (see online documentation at http://meme.nbcr.net/meme/doc/overview.html or http://meme.ebi.edu.au/meme/doc/overview.html for more information).
Materials
Using MEME-ChIP on your own computer requires the following preparation in addition to that described in the MATERIALS section:
You must have a computer running Linux, Mac OS X or Windows with Cygwin installed.
Download and install the MEME Suite software (http://meme.nbcr.net/meme/meme-download.html).
Download all the MEME databases of known DNA and RNA binding from http://ebi.edu.au/ftp/software/MEME/Databases/motifs/.
(Optional) Download and install BEDTools utilities from http://code.google.com/p/bedtools. This is needed for preparing input sequences on your own computer.
(Optional) Download the sequence of the studied organism from the UCSC Genome Browser http://hgdownload.soe.ucsc.edu/downloads.html. This will allow you to create FASTA files of sequences directly on your own computer with BED files of ChIP-seq- or CLIP-seq (or other)-identified genomic regions.
Running MEME-ChIP
MEME-ChIP is straightforward to use. In the terminal, type (where ‘$’ is the command prompt):
$ meme-chip
to see a listing of all the options to the MEME-ChIP program and a description of the command syntax. The only required input is a sequence file in FASTA format. You may also provide MEME-ChIP with one or more files of known motifs (see Materials, above). The output of MEME-ChIP will be in a folder named ‘memechip_out’. You can view the output summary by opening the file ‘memechip_out/index.html’ with a web browser. Complete documentation on the command-line version of MEME-ChIP is available at http://meme.nbcr.net/meme/doc/meme-chip.html.
Preparing FASTA sequences
You may also wish to prepare sequence files on your own computer by using BEDTools. For example, the following procedure will produce the FASTA input file for Study Case 1.
Download the GATA1 narrowPeak file. The file is called ‘wgEncodeSydhTfbsPbdeGata1UcdPk.narrowPeak.gz’. Follow steps 1–10 given in Box 5.
- Create a BED3 file of 500bp regions centered on ChIP-seq peak summits.
$ zcat wgEncodeSydhTfbsPbdeGata1UcdPk.narrowPeak.gz | awk ‘BEGIN{ OFS="\t";} { midPos=$2+$10; print $1, midPos-250, midPos+250; }’ > GATA1-peak-summit-500bp.bed - Obtain the hg19 genome reference sequences.
$ wget "http://hgdownload.cse.ucsc.edu/goldenPath/hg19/bigZips/chromFaMasked.tar.gz"

$ tar -xzvf chromFaMasked.tar.gz

$ gunzip -c chr*.fa.gz > hg19.fa
- Extract DNA sequences of peak summit regions. Type:
$ fastaFromBed -f hg19.fa -bed GATA1-peak-summit-500bp.bed -fo GATA1-peak-summit-500bp.fa
Converting RNA sequences to DNA
You can easily convert a FASTA file containing RNA sequences to one containing DNA sequences (as required by MEME-ChIP). If your RNA file is named ‘sequences_rna.fa’, the following command will create a file containing DNA sequences named ‘sequences_dna.fa’ by converting all occurrences of U to T (upper and lower case).
$ sed ‘/^>/! y/uU/tT/’ < sequences_rna.fa > sequences_dna.fa
Input peak shape
The MEME-ChIP pipeline treats all peak sequences equally, without considering the peak size and shape. Other motif discovery programs such as ChIPMunk and TherMos12 take peak shape information into account.
Experimental design
It is straightforward to run a complete and comprehensive motif analysis using MEME-ChIP. The workflow consists of three stages: preparing sequences; running MEME-ChIP; and interpreting results. In the PROCEDURE section, we illustrate how to perform these stages via the internet.
Preparing sequences
The only required data you need to provide MEME-ChIP is a set of DNA or RNA sequences in FASTA format. This set could be the peak sequences obtained from ChIP-seq or cross-linking site sequences from CLIP-seq. It could also be the sequences of other regions of biological interest such as transcription start sites (TSSs), splice junctions, translation start sites or translation end sites. MEME-ChIP then explores the given sequences for shared motifs.
For ChIP-seq experiments, well-established protocols exist for identifying the peaks of protein binding13–15. In Box 5, we detail how to convert a file containing the genomic locations of ChIP-seq peak summits into DNA sequences in FASTA format. For CLIP-seq experiments, we provide an overview of some of the existing protocols for identifying cross-linking sites in Box 6. The genomic locations of the (RNAs containing the) cross-linking sites can then be used to obtain DNA sequences in FASTA format (Box 7) for analysis by MEME-ChIP. We also provide the sequences needed for the two study cases at http://ebi.edu.au/ftp/software/MEME/MEME-ChIP_Study_Cases.
Box 5. Preparing input sequences: Converting ENCODE ChIP-seq narrowPeak format to FASTA.
In this example, we illustrate how we prepare the input sequences for Study Case 1. The procedure involves obtaining from the UCSC Genome Browser website an ENCODE narrowPeak file, which is a flavor of the BED format, and uploading the file to Galaxy. The narrowPeak file is then converted to FASTA by using a Galaxy workflow that we have prepared and published. You can use this Galaxy workflow with any ChIP-seq peak (or related) file in ENCODE narrowPeak format. You can also edit the workflow to allow it to handle formats other than narrowPeak. This workflow produces 500-bp regions, and you can edit it to produce FASTA files with regions of a different size. (Note that we did not use the newer peak file produced by using ‘Uniform Peaks of Transcription Factor ChIP-seq from ENCODE/Analysis’ (‘wgEncodeAwgTfbsSydhPbdeGata1UcdUniPk.narrowPeak’) because MEME-ChIP revealed an artifact (Fig. 15) in the peak summits in that file.)
Download the genomic coordinates of GATA1 ChIP-seq peaks in PBDE cells
Navigate to the UCSC ENCODE website http://genome.ucsc.edu/cgi-bin/hgFileSearch?db=hg19.
Leave ‘Track Name:’ and ‘Description’ blank.
Select ‘Group:’ to be ‘Regulation’.
Select ‘Data Format:’ to be ‘Peaks Narrow (narrowPeak)’.
Set ‘Antibody or target protein’ to ‘GATA1’ and click ‘+’.
Set ‘Lab producing data’ to ‘Farnham - USC and click ‘+’.
Set ‘Cell, tissue or DNA samples’ to ‘PBDE’ and click ‘+’.
Set ‘ENCODE Data Freeze’ to ‘ENCODE Jan 2011 Freeze’.
Click ‘Search’.
Download the file ‘wgEncodeSydhTfbsPbdeGata1UcdPk.narrowPeak.gz’.
Upload the narrowPeak file to Galaxy
-
11
Open https://usegalaxy.org.
-
12
Click ‘Get Data’ → ‘Upload File’.
-
13
Select ‘File Format’ as ‘Auto-detect’.
-
14
Click ‘Choose File’ to browse and select the ENCODE narrowPeak file downloaded in step 10 of this box.
-
15
Select ‘Convert spaces to tabs:’ as ‘Yes’.
-
16
Select ‘Genome:’ to be ‘Human Feb 2009 (GRCh37/hg19) (hg19)’.
-
17
Click ‘Execute’ to upload the file.
Import the Galaxy workflow
-
18
From the top panel, click ‘Shared Data’ → ‘Published workflows’.
-
19
Select ‘Create MEME-ChIP input FASTA file (500bp summit regions) from ENCODE narrowPeak file’.
-
20
Click ‘Import workflow’ (the green ‘+’ sign at top right) → ‘Start using this workflow’.
Run the imported Galaxy workflow
-
21
Click ‘Imported: Create MEME-ChIP input FASTA file (500bp summit regions) from ENCODE narrowPeak file’ workflow → ‘Run’.
-
22
In ‘Step 1: Input dataset’, select ‘ENCODE narrowPeak file (10 columns)’ to be the narrowPeak file uploaded in step 17 of this box.
-
23
Click ‘Run workflow’.
Download and save the FASTA file
-
24;
Download and rename the FASTA file as ‘Study_case_1.fa’.
Box 6. Identifying cross-linking sites in CLIP-related experiments.
Previous studies of high-throughput RNA-protein interactions with CLIP-seq and its related assays have applied a range of different approaches to identify cross-linking sites at different resolutions. Here we summarize these site identification methods by assay type.
CLIP-seq and HITS-CLIP
Given the high throughput and high fidelity of the CLIP assay, one of the first HITS-CLIP papers simply defines all sites that contain overlapping tags (‘clusters’) as cross-linking sites34. This type of simple approach doesn’t consider relative transcript abundance and possible noise interactions. In addition, it does not control for the FDR.
Kishore et al.46 improved the site-identification method by incorporating mRNA expression data. First, expression of individual transcripts is calculated from mRNA sequencing, and transcripts with reliable expression are selected by fitting a two-component Gaussian mixture to the data. Then the authors use a sliding window of 40 nt to count CLIP reads to identify binding peaks. Again a Gaussian mixture model is used to remove very low-coverage peaks. Finally, binding regions located in expressed transcripts are selected, and the ratio between CLIP reads coverage and transcript expression is reported.
More sophisticated methods control the FDR by conducting a simulation of the CLIP-seq experiment by using transcript abundance information and assuming no site-specific cross-linking preference. For example, Chi et al.36 simulate random CLIP data in silico based on transcript abundance and length, and then calculate FDR for each read count threshold.
Recently, Zhang and Darnell39 developed an improved strategy based on the observation that reverse transcriptase frequently skips the cross-linked amino-acid-RNA adduct, which results in a nucleotide deletion or mutation. In their approach, the number of overlapping unique tags k as well as the number of unique tags with particular types of mutations m at the nucleotide is first calculated. Substitutions overlapping with known or predicted SNPs or RNA-editing sites are excluded. Then FDR is estimated for each (k, m) cutoff on the basis of permutations of the data. Permuted data is generated that preserves the nonuniform distribution of CLIP tags in the genome, and also the nonuniform distribution of sequencing errors with respect to the distance to the 5’ ends of reads. This analysis, which is specific to the cross-linking mutation sites, enabled the identification of cross-linking sites at single-nucleotide resolution.
par-CLIP
Site-identification methods for PAR-CLIP data often make use of the T-to-C mutation introduced by the PAR-CLIP technology.
For example, Hafner et al.37 use a simple threshold of the read counts and the percentage of T-to-C mutations at each read cluster to call cross-linking sites.
Corcoran et al.47 developed the PARalyzer tool (PAR-CLIP data analyzer), a kernel-based method for predicting cross-linking sites. For each CLIP read cluster, PARalyzer generates two smoothed kernel-density estimates, one for T-to-C transitions, and one for nontransition events. Clusters satisfying the minimum read depth and with higher T-to-C conversion likelihood than nonconversion, are considered interaction sites. The PARalyzer package is available at http://www.genome.duke.edu/labs/OhlerLab/research/PARalyzer/.
Freeberg et al.6 define a read cluster as a continuous stretch of genomic locations covered by at least one mapped read harboring one or more T-to-C conversion events. They then define the boundaries of individual cross-linking sites by fitting a Gaussian kernel function (bandwidth 21 bases) to the read coverage of each cluster. FDR is determined empirically by using all mRNA-seq reads containing one or more T-to-C mismatches.
iCLIP
The iCLIP protocol takes advantage of the propensity of reverse transcriptase to stop at cross-linked nucleotides. The protocol is adapted to collect truncated cDNAs, which enables the direct identification of the cross-linking position38. More specifically, the first nucleotide in the genome upstream of a mapped iCLIP sequence is defined as the ‘cross-link nucleotide,’ and the number of corresponding sequences assigned at this position is reported.
Please note that site-identification methods used in PAR-CLIP and iCLIP data intrinsically consider information specific to the particular UV cross-linking and immunoprecipitation assay. These methods achieve resolution as fine as 1 bp but cannot be applied to a general CLIP assay.
Box 7. Preparing input sequences: converting custom PAR-CLIP format to FASTA.
In this example, we illustrate how we prepared the input sequences for Study Case 2. The procedure involves extracting sequence regions from a published Excel file and creating a BED file. The BED file is then uploaded to Galaxy, and the sequences are extracted and downloaded in FASTA format. Parts of this procedure (command lines) require a computer running UNIX, Linux or OS X. You can adapt this example to prepare FASTA files suitable for MEME-ChIP from any Excel file containing sequence regions.
obtain an excel file of puf3p cross-linking sites
Download ‘Additional file 7 (gb-2013-14-2-r13-s7.gz)’ from Freeberg et al.6.
Uncompress the file.
convert the Excel file to text format
-
3
Open the file using Excel.
-
4
Save the first nine columns without the header line as a tab-delimited text file ‘Puf3p-crosslinking-sites.txt’.
convert the text file to BED6 format with correct (yeast) chromosome names
-
5
$ set chrRoma="I II III IV V VI VII VIII IX X XI XII XIII XIV XV XVI"
-
6Make the BED6 coordinate file.
$ awk -v cr="$chrRoma" ‘BEGIN{ split(cr, chrRoma); OFS="\t";} $1!~"#"
    {chr=$2; strand=$3 ;start=$4; end=$5; name=$8; score=$9; print chrRoma[chr], start, end,
    name, score, strand; }’ Puf3p-crosslinking-sites.txt > Puf3p-crosslinking-sites.bed
▲ CRITICAL STEP BED6 format is required for strand-specific genomic intervals.
-
7Make a BED6 file of 100-bp-long regions centered on the original regions.
$ awk ‘BEGIN{ OFS="\t";} { midPos=($2+$3)/2; print $1, midPos-50, midPos+50, $4,
$5, $6; }’ Puf3p-crosslinking-sites.bed > Puf3p-crosslinking-summit-100bp.bed
upload the BED file to Galaxy
-
8
Navigate to Galaxy https://usegalaxy.org.
-
9
Upload ‘Puf3p-crosslinking-summit-100bp.bed’ following steps 11–17 in Box 5, but select ‘Genome:’ to be ‘S. cerevisiae Apr. 2011 (sacCer3)’.
use the BED file to fetch FASTA sequences
-
10
Click ‘Fetch Sequences’ → ‘Extract Genomic DNA’.
-
11
In ‘Fetch sequences for intervals in:’, select the file you just uploaded.
-
12
Select ‘Interpret features when possible:’ to be ‘No’.
-
13
Select ‘Source for Genomic Data’ as ‘Locally cached’.
-
14
Select ‘Output data type’ to be ‘FASTA’.
-
15
Click ‘Execute’.
Download and save the FASTA file
-
16
Download and rename the FASTA file as ‘Study_case_2.fa’.
Whether you are using this protocol for analyzing ChIP-seq, CLIP-seq or other types of DNA or RNA sequence data, here are some key points to bear in mind when selecting the sequences to input to MEME-ChIP.
•Choosing sequences
You should choose your sequences so that the shared motifs tend to be near the center of the sequences. For ChIP-seq experiments, center your sequences on the summits of the peaks, if provided, or on the centers of the declared peaks if summits are not provided by the software used to call peaks. If the peak caller does not report peak summits, you can instead use the genomic regions centered around the center of each peak. For CLIP-seq experiments, use an actual cross-linking site as the center of each input sequence.
Sequence length
Sequence length should be chosen to include most of the expected motifs and sufficient flanking region for effective motif enrichment analysis. For ChIP-seq experiments, shared motifs tend to be within 50 bp of the summit of peaks reported by ChIP-seq peak callers such as MACS16, and the recommended sequence length for input to MEME-ChIP is 500 bp. Only the central 100 bp of the sequences are used for de novo motif discovery, and the flanking 400 bp provide a built-in negative control for motif enrichment analysis. For CLIP-seq experiments, the resolution is much higher, so the recommended sequence length is only 100 bp.
Equal-length sequences
For maximum statistical power in the motif enrichment analysis performed by MEME-ChIP, your sequences should all be of the same length. MEME-ChIP will still perform all analyses even if the sequences have differing lengths.
Obtaining sequences
Genomic sequences can be obtained via the web from Galaxy (https://usegalaxy.org) and from the University of California Santa Cruz (UCSC) Genome Bioinformatics site (http://genome.ucsc.edu/cgi-bin/hgTables).
Running MEME-ChIP
Running MEME-ChIP requires accessing the MEME-ChIP input form over the web, uploading the FASTA file of sequences, clicking a button if single-stranded analysis (for RNA) is desired, choosing a database of known motifs from a menu and clicking the ‘submit’ button. Additional options are available via the input form for tailoring the analysis performed by MEME-ChIP, and these are described in the PROCEDURE section below.
Interpreting results
Interpreting your MEME-ChIP results requires viewing them in a web browser and clicking to navigate to detailed information on the motifs found. Full interpretation requires understanding and taking into consideration the biology and laboratory techniques behind the data. For example, in ChIP-seq experiments you need to consider that many TFs are members of families with highly similar binding motifs. This means that it is not possible to know a priori which TF from such a family binds the motif sites reported by MEME-ChIP. You should also keep in mind the provenance of the known motifs you use in your MEME-ChIP analysis. MEME-ChIP provides databases of DNA-binding motifs derived from in vitro data (e.g., systematic evolution of ligands by exponential enrichment (SELEX) experiments) as well as databases derived from in vivo data (e.g., ChIP experiments). The presence of an in vitro motif in your ChIP-seq peak regions can provide independent corroboration of the DNA-binding affinity of the TF you are studying. In the ANTICIPATED RESULTS section below, we discuss these and other biological considerations that should inform your interpretation of MEME-ChIP results.
Study cases
This protocol describes the use of MEME-ChIP to analyze sequences from ChIP-seq and PAR-CLIP data. The protocol focuses on using MEME-ChIP via the internet; to run MEME-ChIP directly on your own computer, please refer to Box 4.
To run the ChIP-seq and PAR-CLIP study cases, follow the specific instructions given in the PROCEDURE steps. For Study Case 1 (GATA1 ChIP-seq), you only need to access the MEME-ChIP input form via a web browser, upload a single file of sequences, input your email address and press ‘Submit’. The procedure is the same for Study Case 2 (Puf3p PAR-CLIP), with the addition of selecting a database of RNA-binding motifs from a drop-down menu and checking a box to let MEME-ChIP know that your data are single stranded.
You can download the FASTA files for each of the two study cases described in this protocol from http://ebi.edu.au/ftp/software/MEME/MEME-ChIP_Study_Cases. You can also view the MEME-ChIP results for each of the two study cases there.
Study Case 1: GATA1 ChIP-seq in human PDBE cells
In this study case, we demonstrate the motif-based analysis of ChIP-seq data by using GATA1 ChIP-seq in human peripheral blood-derived erythroblast (PBDE) cells produced by the Encyclopedia of DNA Elements (ENCODE) Consortium5. GATA1 is a transcriptional activator, which serves as a general switching factor for erythroid development. GATA1 is known to bind to DNA sites with the consensus sequence ‘[AT]GATA[AG]’ within regulatory regions of globin genes and other genes expressed in erythroid cells.
We use the 21,727 GATA1 ChIP-seq peaks predicted by the Farnham laboratory at the University of Southern California (USC). These peaks range from 213 bp to 9,888 bp in length, with a mean length of 967.6 bp. We replace each peak with the 500-bp genomic region around its center (Box 5) and submit the FASTA sequence file to MEME-ChIP as described below in Step 3 of the PROCEDURE. For motif enrichment analysis, we use a compendium consisting of the JASPAR CORE vertebrates motif database17 and the UniPROBE mouse motif database18.
Study Case 2: Puf3p PAR-CLIP in budding yeast
In this study case, we illustrate the motif analysis of PAR-CLIP cross-linking sites by using the published data for Puf3p binding in Saccharomyces cerevisiae6. Puf3p is a member of the Pumilio family of RBPs, which are evolutionarily highly conserved from yeast to humans. The proteins in this family have sequence-specific RNA-binding domains located in their C termini that frequently bind the 3′ UTR of target mRNAs. In budding yeast, Puf3p is localized to the cytosolic face of the mitochondrial outer membrane; binds nearly exclusively to mRNAs from nuclear genes that encode mitochondrial proteins19; controls translation by speeding up deadenylation; and regulates mRNA stability in response to environmental conditions20.
We use the 1,236 Puf3p cross-linking sites that Freeberg et al.6 identified by using conventional PAR-CLIP at a 5% false discovery rate (FDR). The lengths of the sites range from 17 bp to 63 bp, with a mean of 23.7 bp. Given the relatively high resolution of PAR-CLIP experiments, we replace each cross-linking site with the 100-bp (rather than 500-bp) genomic region surrounding its center to provide flanking regions for motif enrichment (Box 7) and submit the FASTA sequence file to MEME-ChIP as described below in the Step 3 of the PROCEDURE. For motif enrichment analysis, we use the RBP motif database, which contains RNA motifs from 205 distinct genes from 24 diverse eukaryotes21.
MATERLALS
EQUIPMENT
A computer connected to the Internet and a web browser.
Supporting websites to prepare input sequences for the protocol
UCSC genome browser22 (http://genome.ucsc.edu)
Galaxy23 (https://usegalaxy.org)
Required data
PROCEDURE
Preparing sequences ● TIMING <30 min
Running MEME-CHIP ● TIMING <2 h
-
2
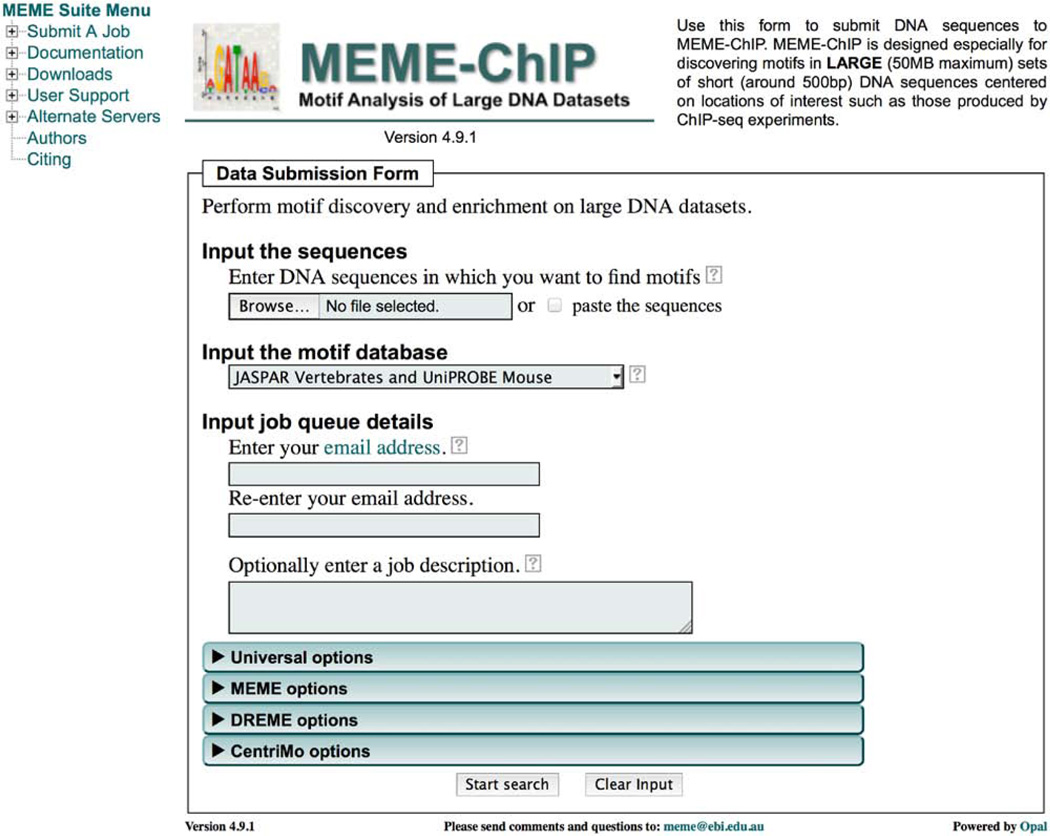
Open the MEME-ChIP submission form. Go to http://meme.nbcr.net or http://meme.ebi.edu.au and click the word ‘MEME-ChIP’ on the flowchart of the MEME Suite tools or on the MEME-ChIP icon located below the flowchart. This will open the MEME-ChIP submission form (Fig. 1).
-
3
Upload the sequence file. Click on ‘Browse’ under ‘Input the sequences’, and then specify the file name and click on ‘Open’. For the study cases, specify the name of the FASTA file that you downloaded above: ‘Study_case_1.fa’ or ‘Study_case_2.fa’.
▲ CRITICAL STEP MEME-ChIP requires the input sequences to be provided by using the DNA alphabet (e.g., ACGTN). If you are analyzing RNA sequences (e.g., from a CLIP-seq experiment), you need to first convert them to DNA sequences (replacing U by T) in the FASTA file before you upload it. See Box 4 for a simple command to carry out this conversion on a UNIX, Linux, or OS X computer.
-
4
Select the motif database. Under ‘Input the motif database’, choose a database containing known DNA- or RNA-binding motifs for MEME-ChIP to use in its motif enrichment analysis. For DNA sequences from vertebrates, the ‘JASPAR Vertebrates and UniPROBE Mouse motif’s database option is a good choice. The drop-down list also provides DNA-binding motif databases appropriate for Drosophila, worm, yeast and many other organisms, and RNA-binding motifs for diverse eukaryotes. To view detailed descriptions of all the available motif databases click on the help menu (‘?’) to the right of the drop-down menu and then click on ‘supported databases’. If you wish to use a custom database of motifs, choose ‘Upload Your Own Database’ in the drop-down menu and then select the file to upload in the ‘Input motifs to upload’ field that will then appear. The motifs must be in MEME motif format (http://meme.nbcr.net/meme/doc/meme-format.html) and RNA motifs must be encoded in the DNA alphabet (with U replaced by T). Scripts for converting numerous motif formats to MEME motif format are provided with the downloadable version of the MEME Suite (Box 4). For Study Case 2, choose ‘RNA-binding motifs (Ray2013)’.
-
5
Provide your email address. Under ‘Input job queue details’, enter your email address in the first box and then confirm it in the second. We use your email address to send you a confirmation email that contains a link to your MEME-ChIP results.
-
6
(Optional) Provide a description of your analysis. Under ‘Optionally enter a job description’, type a description that will help you keep track of your analysis. This description will be included in the confirmation email that you will receive and at the top of your MEME-ChIP results summary file. For the study cases, you can write ‘Study Case 1: GATA1 ChIP-seq’ or ‘Study Case 2: Puf3 PAR-CLIP’, or just leave this field blank.
-
7
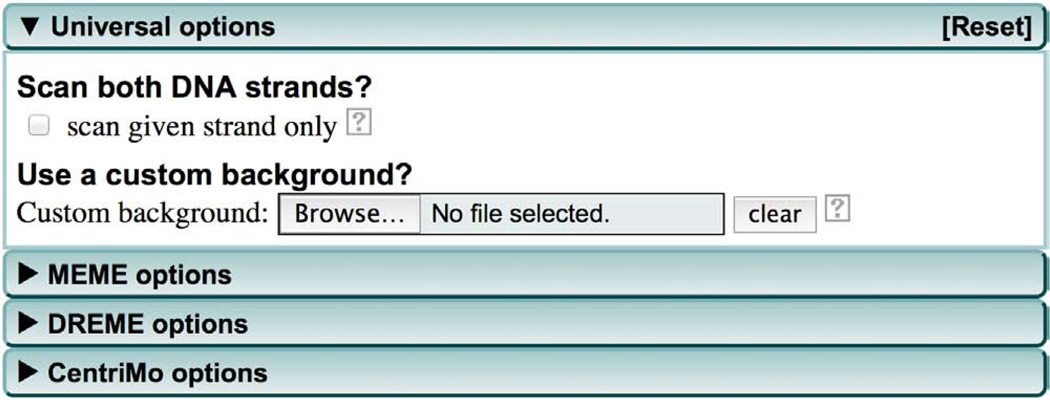
(Optional) Modify MEME-ChIP parameters. If you want to specify some general motif search parameters (shared by MEME, DREME and CentriMo), click the ‘Universal options’ tab to change the default parameters (Fig. 2) as discussed in Steps 8 and 9.
-
8
(Optional) Under ‘Scan both DNA strands?’ check ‘scan given strand only’ if your sequences have strand information (e.g., all sequences are from the coding strand of genes or are RNA sequences). This will cause MEME-ChIP to only consider the actual sequences, rather than the sequences and their reverse-complements (the default), when looking for motifs.
▲ CRITICAL STEP If your input sequences are RNA, as they are for Study Case 2, then you should check the ‘scan given strand only’ box. You should also answer ‘OK’ to the question you will be asked regarding using the ‘CentriMo’s localized search’ option unless you only want to look for motifs that are concentrated in the centers of your RNA sequences.
-
09
(Optional) The ‘Use a custom background?’ field allows you to upload a custom background model file. By default MEME-ChIP will build a first-order background Markov model from your input sequences. The use of a higher-order background model (second- or third-order) can improve the ability of MEME to discover motifs if your sequences contain short repeats that are not functional motifs. We recommend trying models up to order three that you can prepare from your input sequences using the ‘fasta-get-markov’ script provided if you download and install the MEME Suite on your own computer (Box 4). Click ‘Browse’ to upload custom background model file. Future releases of MEME-ChIP will include an option (under ‘Universal options’) for specifying that MEME-ChIP build a higher-order Markov model and use it with MEME.
-
10
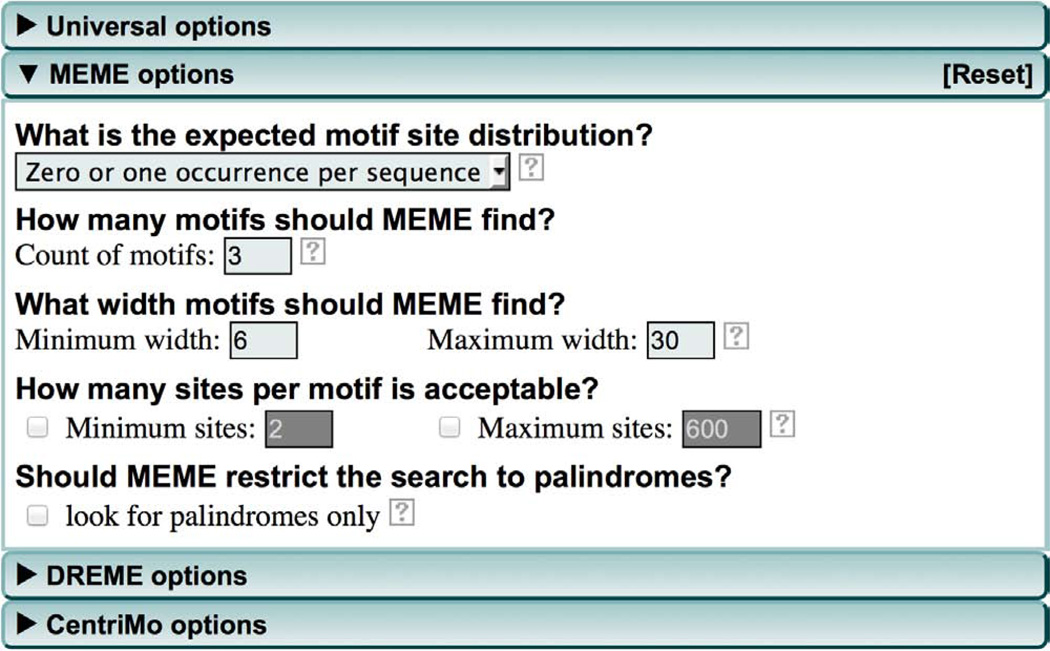
(Optional) Modify MEME parameters. Click the ‘MEME options’ tab to specify parameters for MEME (Fig. 3). By using these options you can modify the way the MEME de novo motif discovery algorithm analyzes your sequences. We have found that the defaults are usually satisfactory for ChIP-seq and CLIP-seq analyses; however, you may want to alter some parameters under certain circumstances as described in Steps 11–15.
-
11
(Optional) The default motif site distribution ‘Zero or one occurrence per sequence’ is generally optimal for large sequence data sets as many sequences will not contain any particular motif due to imperfect antibodies or imperfect peak calling. If you know that every sequence contains a motif, then you can specify ‘One occurrence per sequence’ from the drop-down menu under ‘What is the expected motif site distribution’. The ‘Any number of repetitions’ option can also be used and may detect motifs that occur multiple times (e.g., homotypic clusters) in relatively few of the input sequences.
-
12
(Optional) If, after running your analysis, you find that the last motif found in a MEME-ChIP run has a very low E-value (high statistical significance), repeat the analysis to increase the number of motifs for MEME to find by using the ‘Count of motifs’ field.
-
13
(Optional) To find motifs present in only a small subset of your input sequences, rerun MEME-ChIP multiple times by using a series of progressively shorter maximum motif widths with the ‘Maximum width’ field. This is particularly useful if you suspect the input data to be of low quality or if you are particularly interested in identifying novel cofactor TF-binding motifs.
-
14
(Optional) If you suspect that MEME may be reporting motifs that ‘merge’ more than one motif, use the ‘Maximum sites’ field to decrease the maximum number of sites allowed per motif.
-
15
(Optional) TF-binding motifs are often palindromic due to binding of dimers, and restricting the search to palindromes (check the ‘look for palindromes only’ box) can increase MEME’s sensitivity to such motifs. However, this will prevent MEME from producing ‘unbalanced’ palindromic motifs that are indicative of frequent binding by the monomeric form of the TF.
-
16
(Optional) Modify the DREME motif search. Click the ‘DREME options’ tab to specify parameters for DREME (Fig. 4). By using these options, you can specify how many motifs the DREME de novo motif discovery will report when it analyzes your sequences. By default, DREME stops reporting motifs when the statistical significance of the last motif is worse than an E-value of 0.05. We have found this threshold to be satisfactory for ChIP-seq and CLIP-seq analyses, but you can limit (or increase) the number of motifs DREME reports by changing the ‘E-value’ threshold. You can also limit the number of motifs reported by checking the ‘Count’ box and adjusting the ‘Count’ threshold. If the ‘Count’ box is ticked, DREME will stop reporting motifs as soon as the E-value threshold is reached or the specified number of motifs has been reported.
-
17
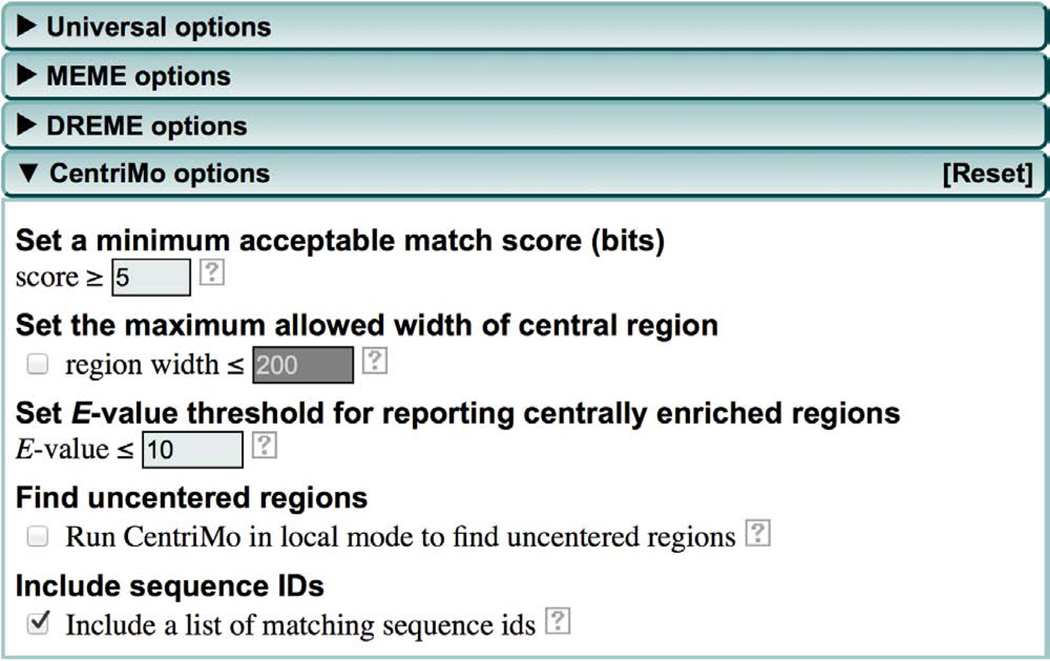
(Optional) Modify the CentriMo motif enrichment analysis. Click the ‘CentriMo options’ tab to specify parameters for CentriMo (Fig. 5). By using these parameters you can control how CentriMo searches for enrichment of the known motifs contained in the motif database you specified in Step 4 in your sequences. We have found the defaults to be generally satisfactory for ChIP-seq and CLIP-seq analyses, but you may want to alter them under certain circumstances, as described in Steps 18–22.
-
18
(Optional) By default, CentriMo ignores sequences that do not contain a match to a motif with a score of at least 5 bits. If you believe that only strong matches to a motif should be relevant, increase this threshold by using the ‘Score’ field.
-
19
(Optional) By default, CentriMo looks for motif enrichment in regions of up to 200 bp. To focus the analysis on motifs that show stronger positional enrichment only, reduce the value of the ‘region width’ field.
-
20
(Optional) CentriMo will report all motifs whose enrichment is significant at an E-value of 10 or better. Use the ‘E-value’ field to reduce (or increase) the number of motifs reported as significant by CentriMo. Note that this does not affect the choice of motifs reported in the MOTIFS section of the MEME-ChIP report, which will only contain motifs with E-values ≤ 0.05. To see the less-significant motifs, you must open the CentriMo output file as described below in ANTICIPATED RESULTS.
-
21
(Optional) By default, CentriMo only looks for enrichment in centered regions. This works well for ChIP-seq and other types of data where motif occurrences are generally equally likely on either side of the center of each input sequence. For other types of data sets (e.g., sequences centered on the TSSs of genes), enriched regions can occur anywhere along the sequences (e.g., TATA box upstream of TSS). In this case, check the box for finding ‘uncentered regions’. You should make sure that this box is checked for Study Case 2.
-
22
(Optional) CentriMo stores the FASTA sequence IDs in its output by default. This is very useful because CentriMo’s interactive output allows you to easily extract the IDs of sequences matching one or more enriched motif for further analysis. On the other hand, this feature can make the output of CentriMo quite large. If you don’t anticipate using CentriMo’s output in this way and want to minimize the size of your MEME-ChIP results files, uncheck the box ‘Include a list of matching sequence ids’.
-
23
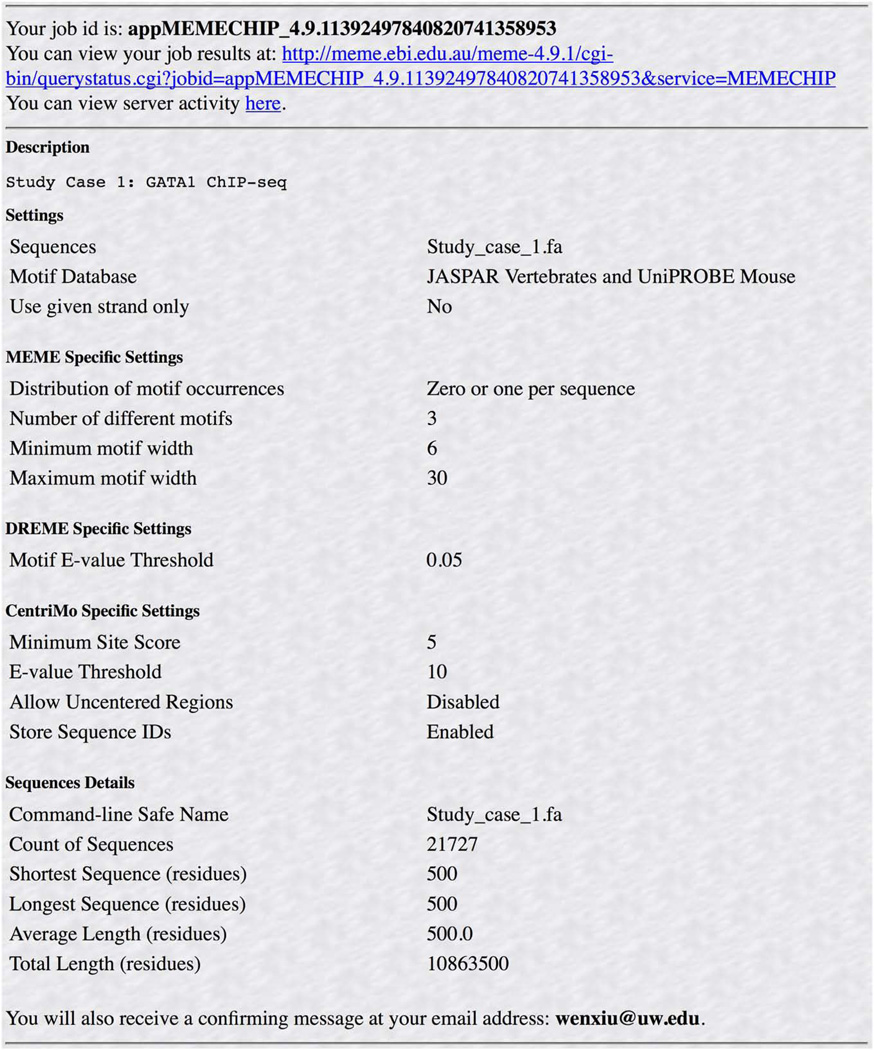
Submit the MEME-ChIP job. Click ‘Start search’ to submit your sequences for analysis by MEME-ChIP. You will then see a verification page (Fig. 6) detailing the parameters of your job and containing a link to the page where the results will appear. You will also receive an email confirmation of your job submission that will contain the same link to your results page for your convenience.
? TROUBLESHOOTING
Figure 1.
MEME-ChIP submission form.
Figure 2.
Universal options (expanded).
Figure 3.
MEME options (expanded).
Figure 4.
DREME options (expanded).
Figure 5.
CentriMo options (expanded).
Figure 6.
Job verification page.
Interpreting results ● TIMING <1 h
-
24
View your MEME-ChIP results. Click on the link at the top of the verification page (Fig. 6) or in the confirmation email to view the results of your MEME-ChIP analysis. This page will tell you whether your job is queued (waiting to be run) or executing. When your job is completed, this page will automatically be replaced with a page containing your results.
? TROUBLESHOOTING
-
25
Save your MEME-ChIP results. The MEME-ChIP web service will store your results for 3 d. After that time, they may be deleted from the server to make space for other jobs. If you wish to save your results, click on the link at the top of your MEME-ChIP results page where it says ‘The full MEME-ChIP analysis can be downloaded as a gzipped .tar file from here.’ Unarchive the compressed folder and then, using a web browser, open the file within it named ‘index.html’ to view your saved results on your local computer.
? TROUBLESHOOTING
Troubleshooting advice can be found in table 2.
TABLE 2.
Troubleshooting table.
| Step | Problem | Possible reason | Solution |
|---|---|---|---|
| 23 | Error report: ‘The sequences submitted for the input dataset appear to be in a format that MEME-ChIP does not recognize. Please check to be sure that your data is formatted properly.’ |
Make sure that you did not submit a Word document or a BED file or other invalid file format |
Re-format your sequence file to ensure that it is in FASTA sequence format |
| Confirmation email is not received | You might have entered your email address incorrectly or your email program may be filtering the MEME-ChIP email as spam |
Check your folders designated as junk e-mail or spam. Try to configure your mail program not to filter out emails from http://meme.nbcr.net or http://meme.ebi.edu.au |
|
| 24 | The job stopped with a time-out error | Very large MEME-ChIP jobs may run out of time on the web server |
Resubmit the job on an alternative server. Currently the hardware on the server at http://meme.ebi.edu.au is twice as fast as that at http://meme.nbcr.net Alternatively, run the job on your own computer after installing MEME Suite (Box 4) |
| 24 | In the ‘PROGRAMS’ section of the results page, getsize and MEME finished with warnings like: ‘Duplicate sequence name. XX’. In this case, you may notice that the sequence counts in the ‘INPUT FILES’ section is unusually small |
The sequences in the FASTA file have duplicate FASTA IDs |
Please make sure every sequence has a unique FASTA ID. (The FASTA ID is everything between the ‘>’ and the first white space on the FASTA header line.) The second (or later) duplicate sequence will be ignored by MEME-ChIP during motif discovery |
| In the ‘PROGRAMS’ section of the results page, CentriMo finished with a warning like ‘Skipping sequence XX as its length (XX) does not match the expected length (XX)’ |
The sequences in the FASTA file do not have the same length |
Please make sure every sequence has the same length. Otherwise, CentriMo will skip them |
|
| When analyzing CLIP-seq data, the de novo motifs identified are weakly palindromic, and only half of each palindromic motif matches with a known RBP motif in the database |
The program searched for motifs in both strands of the RNA sequences |
Make sure you check the ‘scan given strand only’ box in Step 8 |
|
| MEME or DREME identified a motif similar to the known canonical motif of the binding factor, but Tomtom annotates it as some other similar or known motif |
The canonical motif might not be included in the selected motif database |
Please make sure that the appropriate motif database is selected in Step 4 Alternatively, make a customized motif data- base that includes the known canonical motif matrix and select that database in Step 4 |
|
| MEME-ChIP finished normally but the known primary known binding motif is not present in the results |
The ChIP-seq or the CLIP-seq experiment failed; the peak calling program or the cross-linking site identification method did not perform as expected |
There are many reasons that a ChIP-seq or CLIP-seq experiment could go wrong. To help identify the problem, check a few positive control (known TF- or RBP-binding) regions. In addition, check to ensure that the correct genome assembly was used to retrieve the sequences |
● TIMING
In total, this protocol generally takes <3 h, including 1 h of hands-on time and 2 h of computation time.
Step 1, preparing the sequences: <30 min
Steps 2–23, running MEME-ChIP: <1 min to fill out the submission form plus up to about 2 h of running time on the web server. Note that the running time of MEME-ChIP largely depends on the number and size of sequences being analyzed.
For example, Study Case 1 analyzes 21,727 sequences of length 500 bp, and the running time is ~1.5 h on the MEME Suite web server. Study Case 2, which analyzes 1,236 sequences of length 100 bp, runs in under 15 min on the web server.
Steps 24 and 25, viewing and analyzing the results: <1 h
For large data sets (>1,000 sequences), the computation time of MEME-ChIP is dominated by DREME, whose running time increases approximately linearly with the number of sequences. DREME runs for 61 min on the 21,727 sequences in Study Case 1, and doubling the number of sequences will approximately double its running time. Because MEME is intrinsically much slower and scales up cubically with the number of sequences, MEME-ChIP provides MEME with a random selection of only 600 of the input sequences. As a result, the contribution of MEME to the running time of MEME-ChIP does not increase once the data set contains 600 sequences. For Study Case 1, the running time of MEME is only 16 min. The actual running times for each of the programs executed by MEME-ChIP are listed in the PROGRAMS section of the MEME-ChIP report.
ANTICIPATED RESUITS
MEME-ChIP produces a report containing a wealth of information regarding sequence motifs present in the input sequences. Below we illustrate how you can use and understand this report by discussing the results of the two study cases.
study case 1: GATA1 ChIP-seq data in human PBDE cells
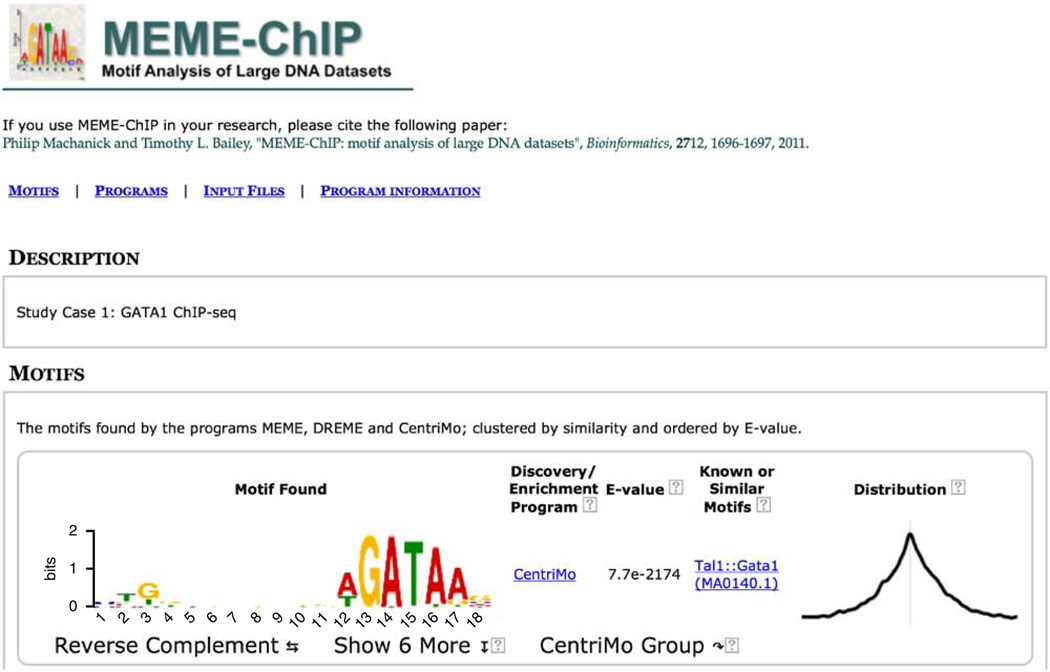
To view the report, click on the link in the email you were sent by MEME-ChIP. At the top are links to the four sections of the report followed by instructions on how to save the report on your computer (Fig. 7). This is followed by the descriptive text that you entered (if any) when you submitted the job.
Figure 7.
MEME-ChIP report (top).
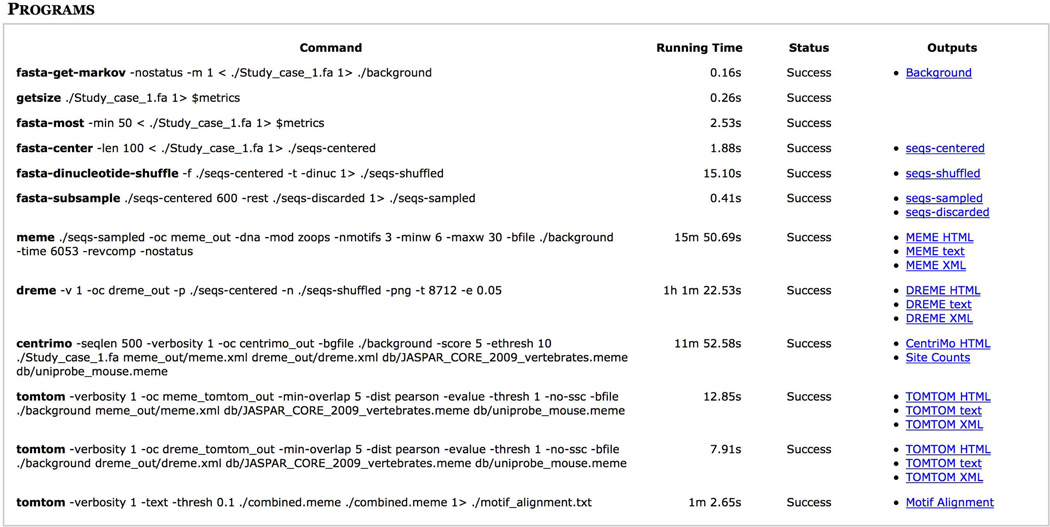
If you click on the ‘PROGRAMS’ link at the top of the report, you will see confirmation that all of the programs executed successfully (Fig. 8). This section also provides convenient links to the outputs of each of the programs run by MEME-ChIP. If any program failed, as indicated in the ‘Status’ column in Figure 8, click on its output file to view information useful for troubleshooting the problem. Extensive documentation of the MEME-ChIP output is available by clicking on the ‘?’ links found throughout the output pages.
Figure 8.
MEME-ChIP report (PROGRAMS).
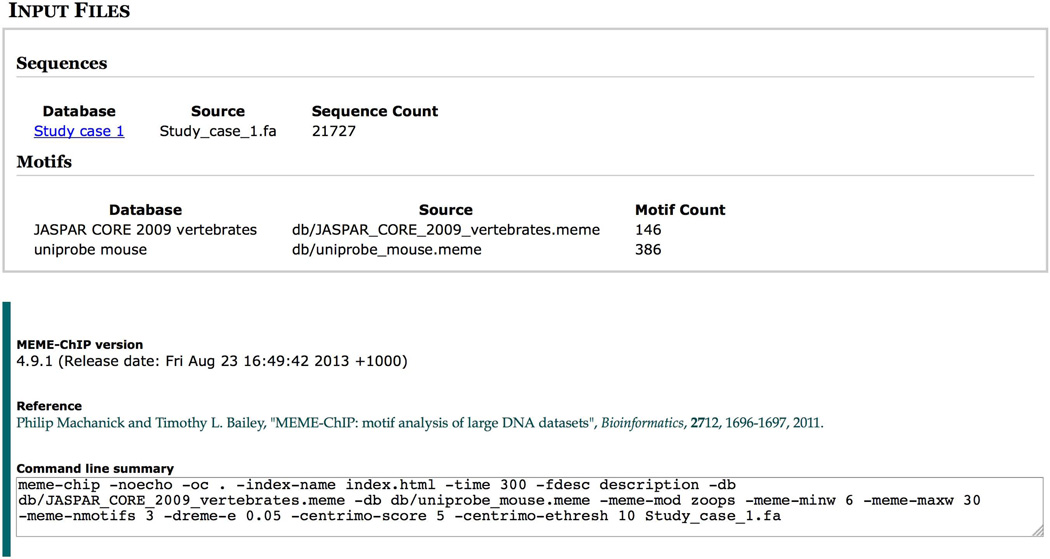
Clicking on the ‘INPUT FILES’ link at the top of the report takes you to the bottom of the report, which describes the inputs you provided to MEME-ChIP (Fig. 9). Immediately below this is the version and release date information for MEME-ChIP as well as the actual command line that was run. The command line can be useful for troubleshooting any problems in conjunction with the online documentation for MEME-ChIP available at http://meme.ebi.edu.au/meme/doc/meme-chip.html and http://meme.nbcr.net/meme/doc/meme-chip.html, which explains the meaning of each of the command-line options.
Figure 9.
MEME-ChIP report (INPUT FILES and command line).
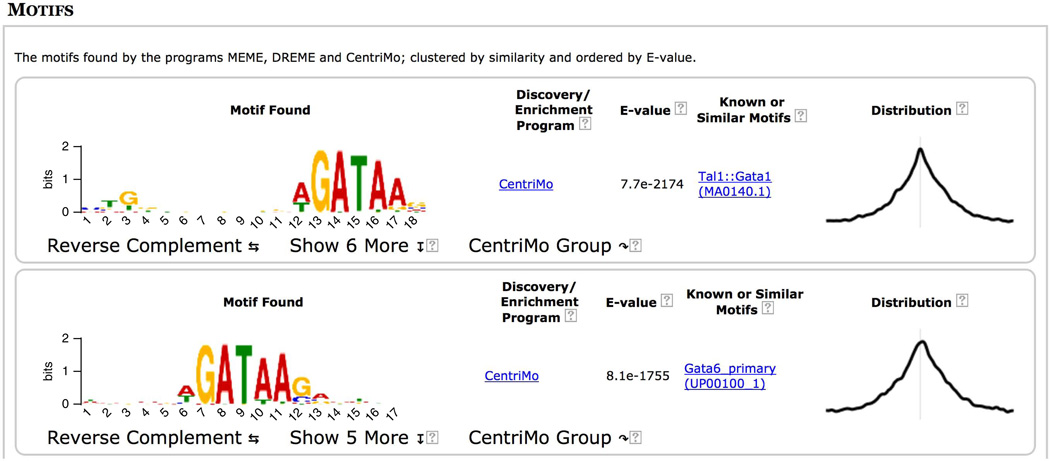
Clicking on the ‘MOTIFS’ link at the top of the report takes you to the results of the MEME-ChIP motif analysis of the 21,727 500-bp ChIP-seq peak regions for GATA1 contained in the file ‘Study_case_1.fa’ that you input. The motifs are listed in order of statistical significance, and Figure 10 shows the two most significant motifs. For each motif, MEME-ChIP displays its logo, the program that reported it, its statistical significance (as estimated by that program), links to similar known motifs and the positional distribution of the motif in the sequences. You can view the reverse-complement of any motif logo by clicking on the ‘Reverse Complement’. Clicking on ‘CentriMo’ will automatically select similar motifs and display them via the CentriMo output. Clicking on ‘MEME’ or ‘DREME’ in the ‘Discovery/Enrichment Program’ column will take you to the output of those programs where much more detailed information is available about the selected motif.
Figure 10.
MEME-ChIP report (MOTIFS).
If the motif was detected by CentriMo, the ‘Known or Similar Motifs’ column contains a link to the motif database entry for that known motif. This is the case with the most significant motif found in the GATA1 ChIP-seq peaks (‘Tal1::Gata1’), which is believed to be bound by GATA1 in complex with Tal1 (refs. 24,25). The extremely centered and symmetrical motif distribution plot (rightmost column in Fig. 10) for this known motif for the ChIP-ed TF indicates that the ChIP-seq protocol and peak-calling pipeline were highly successful in this experiment.
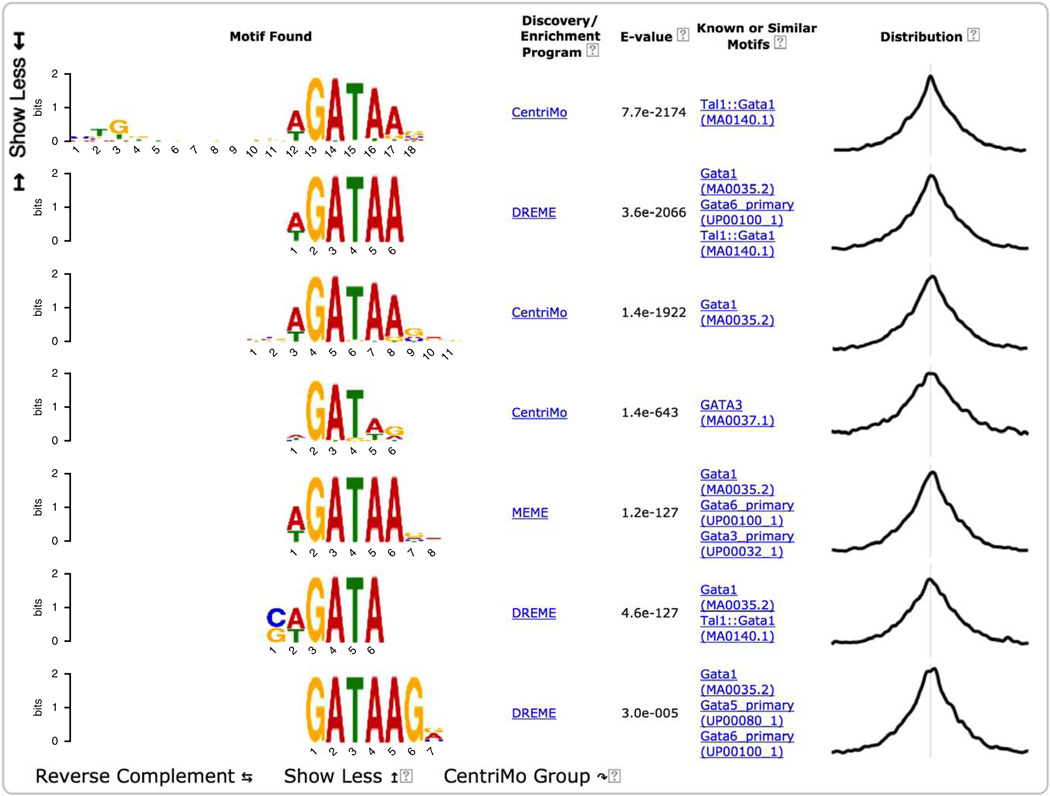
For convenience, MEME-ChIP groups motifs that are very similar to each other and displays only the most significant one. Clicking on the ‘Show 6 more’ link under the top-scoring motif displays all seven motifs in the group aligned with each other (Fig. 11). Inspection of this group of motifs provides several insights. (In future releases of MEME-ChIP, the report will also provide a button if you want to ‘undo’ the clustering, expanding all groups and sorting all motifs by significance.)
Figure 11.
MEME-ChIP report (top motif group expanded).
First, the top two motifs found by motif enrichment analysis (CentriMo) in the expansion of the top-ranking motif cluster (Fig. 11) are known motifs for the ChIP-ed TF (GATA1) rather than for another member of the GATA family of TFs (e.g., GATA3).
Second, MEME and DREME both find de novo motifs that are highly similar to the Gata1 motif in the JASPAR database. As MEME and DREME do not use the known motifs in their searches, this confirms that the binding affinity of GATA1 in PDBE cells is essentially the same as that previously believed.
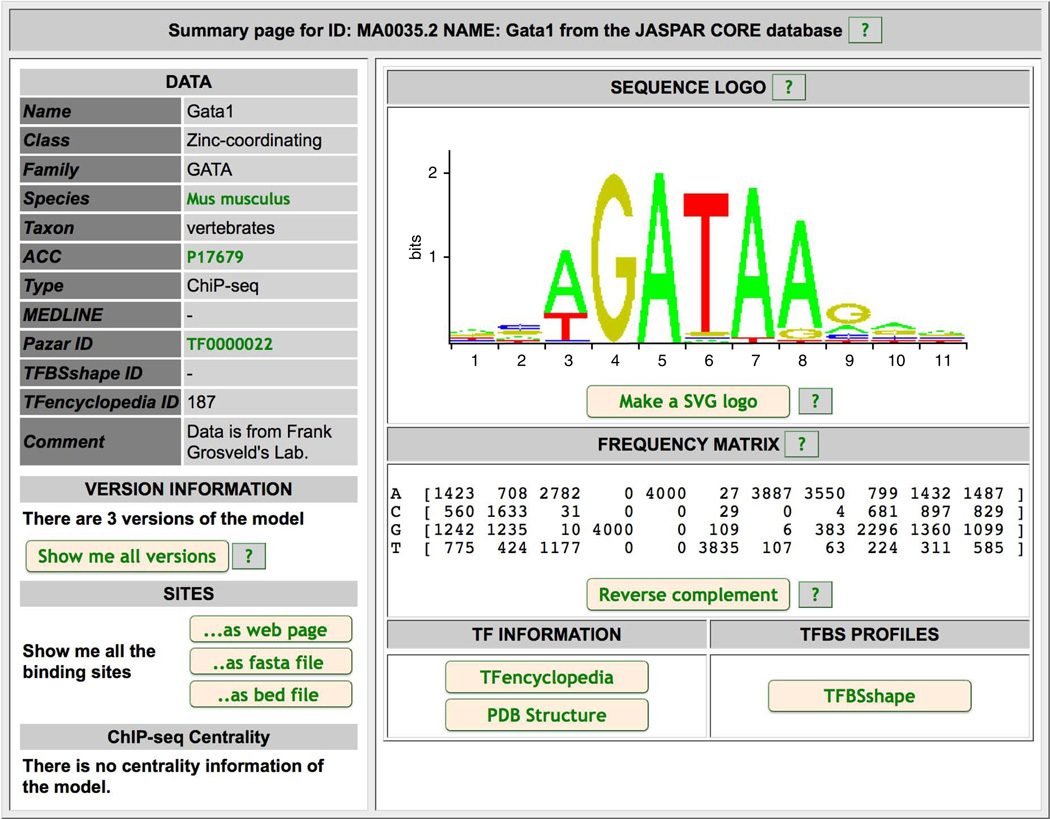
Third, clicking on the ‘Gata1 (MA0035.2)’ link to the left of the third motif in Figure 11 displays detailed information about the JASPAR Gata1 motif (Fig. 12), which states that the JASPAR Gata1 is derived from data in mouse. Because this study case uses human PBDE cell ChIP-seq, this observation implies that the DNA-binding specificity of GATA1 has not evolved substantially between humans and mice.
Figure 12.
JASPAR Gata1 motif.
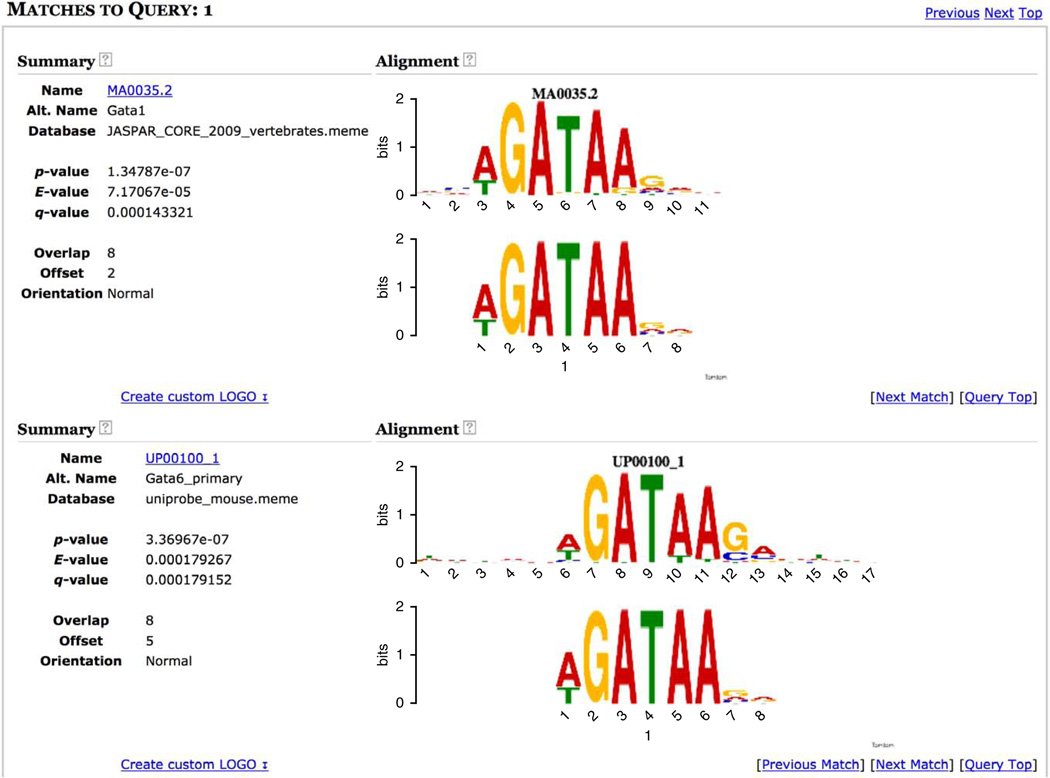
Further evidence that GATA1’s binding specificity in mice and humans is highly similar is provided by clicking on the ‘Gata1 (MA0035.2)’ link next to the MEME motif (Fig. 11 column ‘Known or Similar motifs’). For motif discovery programs (MEME and DREME), the link in this column takes you to the Tomtom analysis of the de novo motif (Fig. 13). Tomtom compares the MEME motif to all the motifs in the motif databases you selected for the MEME-ChIP job and shows the MEME motif aligned below each of the similar known motifs. In this case, the Tomtom motif similarity analysis ranks the MEME motif most similar to the JASPAR in vivo motif for Gata1 (E-value <0.0001), but also highly similar to the in vitro motif for the mouse Gata6 protein (E-value <0.0002). The fact that the MEME motif is very similar to the in vitro motif for a GATA-family motif (Gata6) provides strong independent evidence that the motif analysis of this Gata1 ChIP-seq experiment has accurately captured the DNA-binding affinity of GATA1 in vivo.
Figure 13.
Tomtom analysis of MEME Gata1 motif (two most similar known motifs).
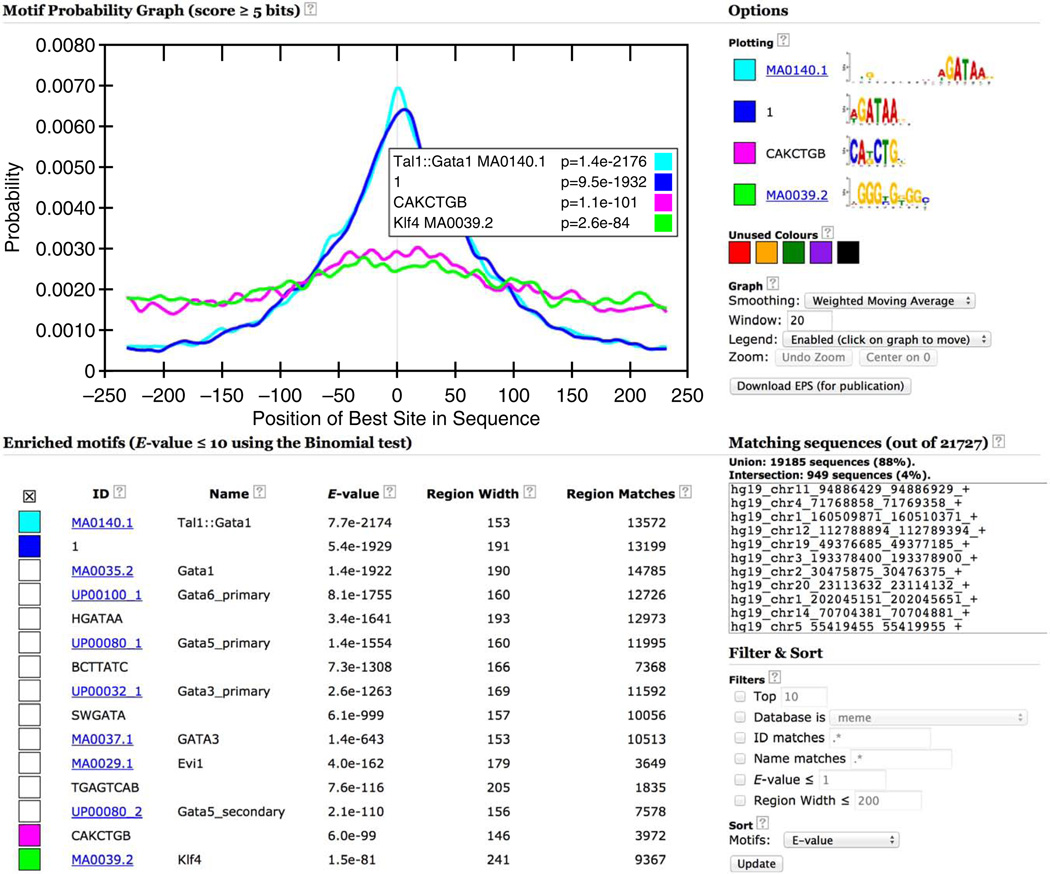
Returning to the MEME-ChIP output page (Fig. 11), you can close the expanded first motif by clicking ‘Show Less’ at the bottom or side. Clicking on the plot in the ‘Distribution’ column takes you to the CentriMo analysis of the GATA1 ChIP-seq peaks. All of the motifs— both known and de novo—are analyzed by CentriMo (Fig. 14).
Figure 14.
CentriMo analysis of GATA1 ChIP-seq peaks (top 15 most centrally enriched motifs).
Central motif enrichment analysis is extremely useful for confirming the success of a ChIP-seq experiment when a DNA-binding motif for the ChIP-ed factor is available. Because TFs usually have many paralogs with highly similar binding motifs and as DNA-binding affinity generally evolves very slowly, the motif databases provided by MEME-ChIP will usually contain a motif sufficiently similar to that of the ChIP-ed factor for confirmation of the experiment. A failed ChIP experiment is indicated when all known motifs from the same TF family as the ChIP-ed TF are not significantly enriched (e.g., they all have E-values greater than 0.05 in the ‘E-value’ column in Fig. 14).
The most centrally enriched motif in the ChIP-seq peak regions for Study Case 1 is the JASPAR ‘Tal1::Gata1’ motif (Fig. 14), confirming the success of the ChIP experiment. The second most centrally enriched motif is MEME’s top motif (‘ID’ ‘1’), which provides further evidence that the de novo MEME motif accurately represents GATA1’s in vivo DNA-binding affinity. The CentriMo plot shows the distribution of the most significant match (above 5 bits) in each input sequence, and the logos of the selected motifs are shown at the top right (Fig. 14).
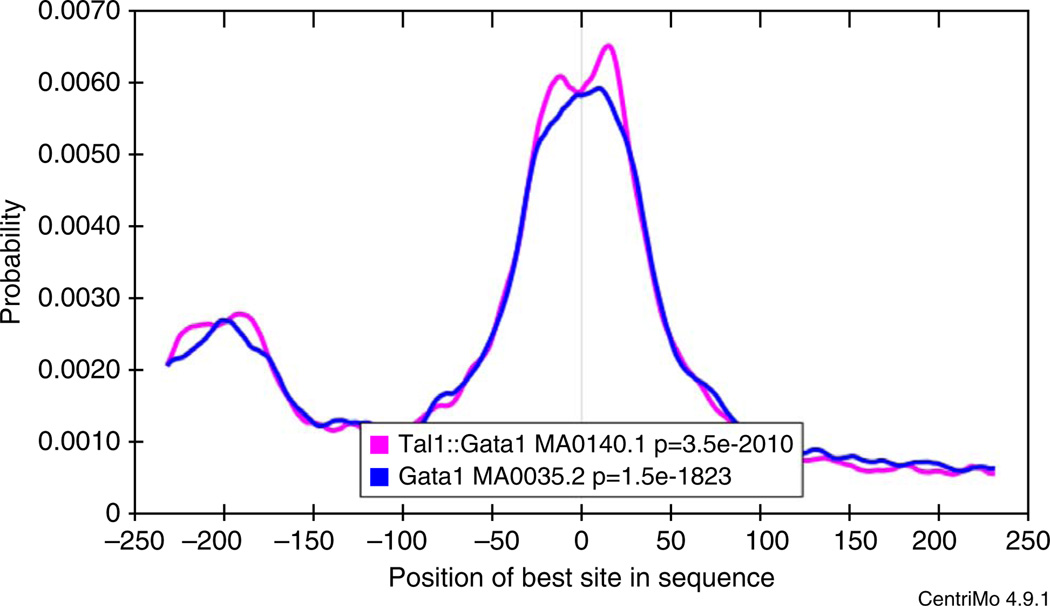
Motif enrichment analysis can also detect undesirable computational artifacts in the ChIP-seq peaks. For example, ChIP-seq peak-calling algorithms can sometimes introduce bias into the positions of the peaks that can affect subsequent analysis of the locations of TF binding. As an illustration of this, the ENCODE website provides two ChIP-seq peak files for the data used in Study Case 1. These two files were created from the same ChIP-seq reads processed by different peak-calling pipelines. If we use the peaks in the second ENCODE file (‘wgEncodeAwgTfbsSydhPbdeG ata1UcdUniPk.narrowPeak’) in this protocol, an anomaly is clearly revealed in the form of a bimodal positional distribution of the Gata1 motif in the peak regions (Fig. 15). The second mode in the distribution of the motif at approximately −200 bp relative to the center of the ChIP-seq peaks can only be explained by the peak-calling software systematically under-reporting peaks when GATA1 binds to multiple, closely spaced sites. (Compare with Fig. 14, in which the motif distribution of Gata1 is unimodal and symmetrical.) Because there is no strand information in ChIP-seq data, the ChIP-seq peak regions input to MEME-ChIP are from the reference strand of the genome, which has no biological interpretation. As there is no corresponding peak at +200 bp in Figure 15, when GATA1 binds in homotypic clusters of sites the peak-calling pipeline systematically under-reports peaks farther left on the reference strand of the genome.
Figure 15.
CentriMo analysis reveals peak-calling artifacts.
The motif enrichment analysis performed by CentriMo is highly sensitive for identifying the motifs of other TFs that co-occur with that of the ChIP-ed TF. In Figure 14, the top 11 motifs are similar to the motif for Gata1 (the ChIP-ed TF) as can be seen by their consensus sequence (e.g., HGATAA in the ‘ID’ column) or their name (e.g., ‘Gata6_primary’ in the ‘Name’ column). The first potential cofactor motif is ranked 12 by CentriMo and has the consensus TGAGTCAB. This motif, discovered by the DREME de novo motif search, is known as the TPA response element and is known to be bound by AP-1, a collective group of heterodimeric proteins composed of members of the Jun and Fos families26. AP-1 is known to regulate processes such as proliferation, differentiation and apoptosis. At positions 14 and 15 is an E-box motif with consensus CAKCTGB found by DREME and a known motif for Klf4 from the JASPAR database. These motifs are highly similar to those of KLF1 and TAL1, two important co-regulators with GATA1 of erythropoiesis27.
The CentriMo output is highly interactive. You can select the motifs to be displayed by clicking the boxes at the left (Fig. 14). CentriMo also provides the IDs of the input sequences that contain all of the motifs currently selected in a box labeled ‘Matching sequences’ (middle right of Fig. 14). You can move the graph legend by clicking on the graph where you want it to be centered. If the legend obscures the curves, you can select ‘Disabled’ from the menu labeled ‘Legend:’ shown at the right of the graph. You can select multiple motifs (e.g., just cofactor motifs) and then select and copy the sequence IDs for use in further analyses such as GO enrichment and pathway analysis, which is outside the scope of this protocol. You can also filter or sort on the different columns in the CentriMo output by using the check boxes on the right. This allows you to eliminate motifs from the output (by filtering) or to focus on motifs with different enrichment characteristics. Numerous other columns can be displayed in the CentriMo analysis by checking boxes on the right in a region below that visible in Figure 14.
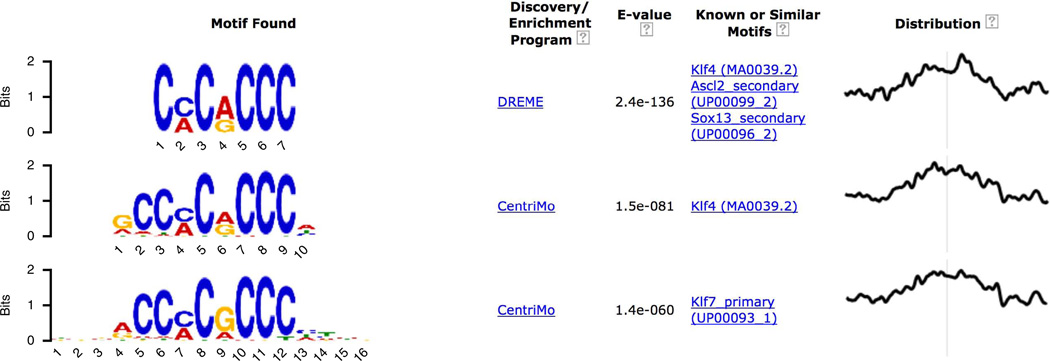
On returning to the top of the MEME-ChIP output page (Fig. 7) and scrolling down, we see that the fourth motif was found by DREME and is similar to the motif for Klf4. Clicking on the ‘Show 8 more’ link under the Klf-like motif found by DREME reveals the strong agreement between the de novo motif found by DREME and the known in vivo and in vitro motifs for Klf4 and Klf7, respectively (Fig. 16). This strongly supports the role of the erythroid KLF (Klf1) in co-regulating GATA1 regulatory targets in PBDE cells.
Figure 16.
MEME-ChIP report (fourth motif group expanded).
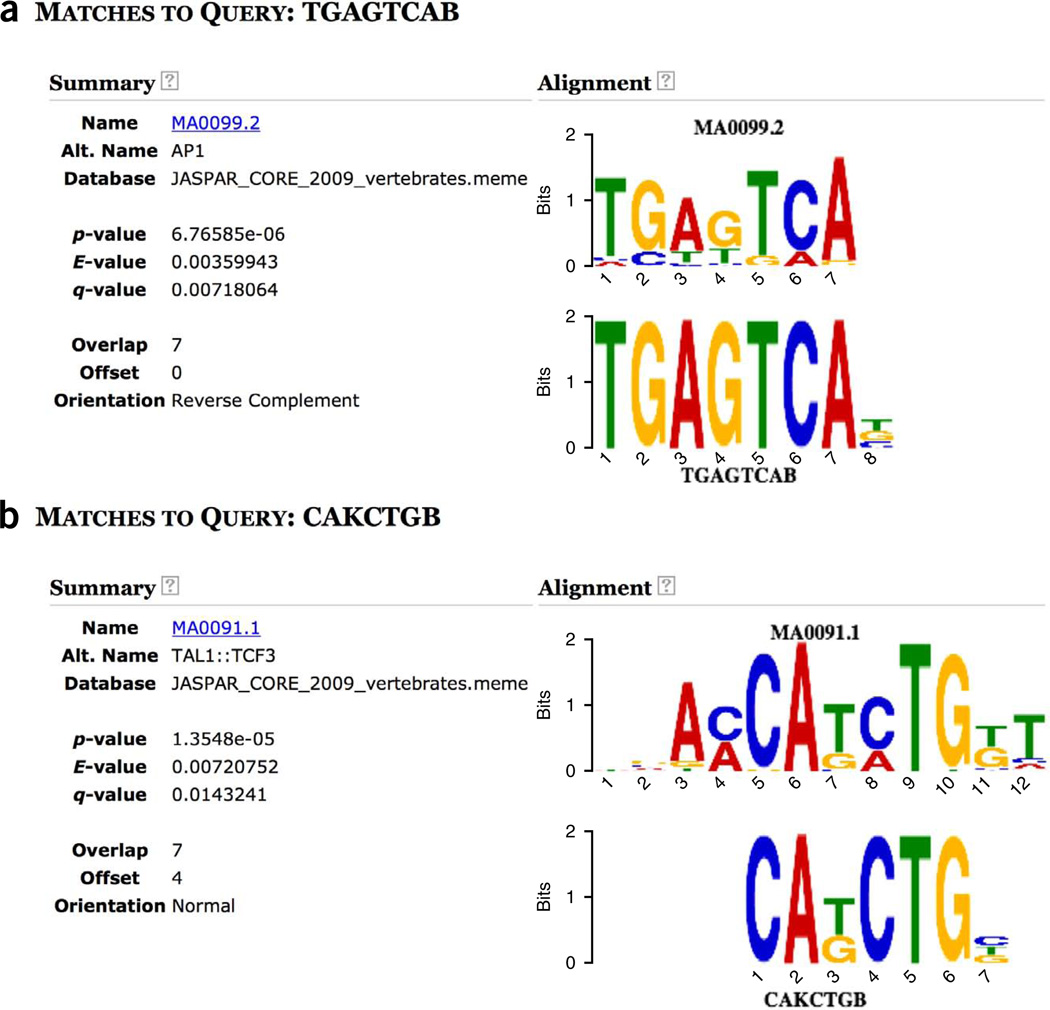
If you click on ‘PROGRAMS’ at the top of the MEME-ChIP output (Fig. 7), at the bottom of the PROGRAMS box you will see links named ‘Tomtom.HTML’. Clicking the second such link will allow you to see a comparison of all the motifs discovered by DREME compared with each of the known motifs in the motif database you selected. For example, in the CentriMo analysis we noted that the DREME motif named ‘TGAGTCAB’ was highly enriched in the GATA1 ChIP-seq peak regions. Clicking on this motif in the Tomtom output reveals its similarity to the known JASPAR motif for AP1 (Fig. 17a), which we noted above. If you click on the ‘CAKCTGB’ motif at the top of the Tomtom output, you will see the strong similarity of this DREME motif to the known motif for known JASPAR motif for TAL1 (Fig. 17b). You can of course explore the similarity to known motifs of the motifs discovered by MEME by clicking on the first ‘Tomtom.HTML’ in the ‘PROGRAMS’ section of the MEME-ChIP output.
Figure 17.
Tomtom analysis of DREME motifs. (a,b) Shown are the known motifs most similar to ‘TGAGTCAB’ (a) and ‘CAKCTGB’ (b), respectively.
study case 2: puf3p PAR-CLIP data in budding yeast
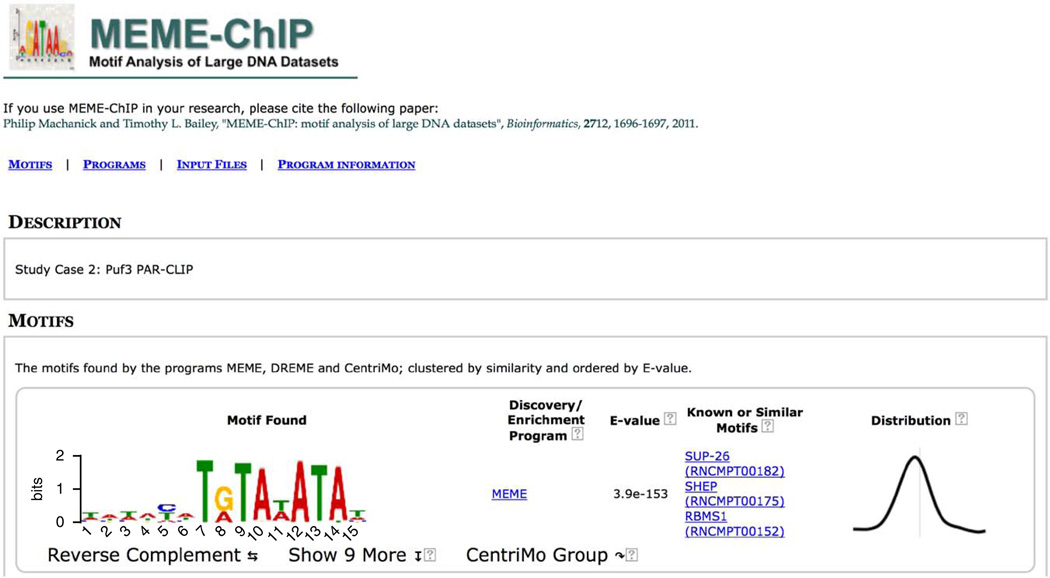
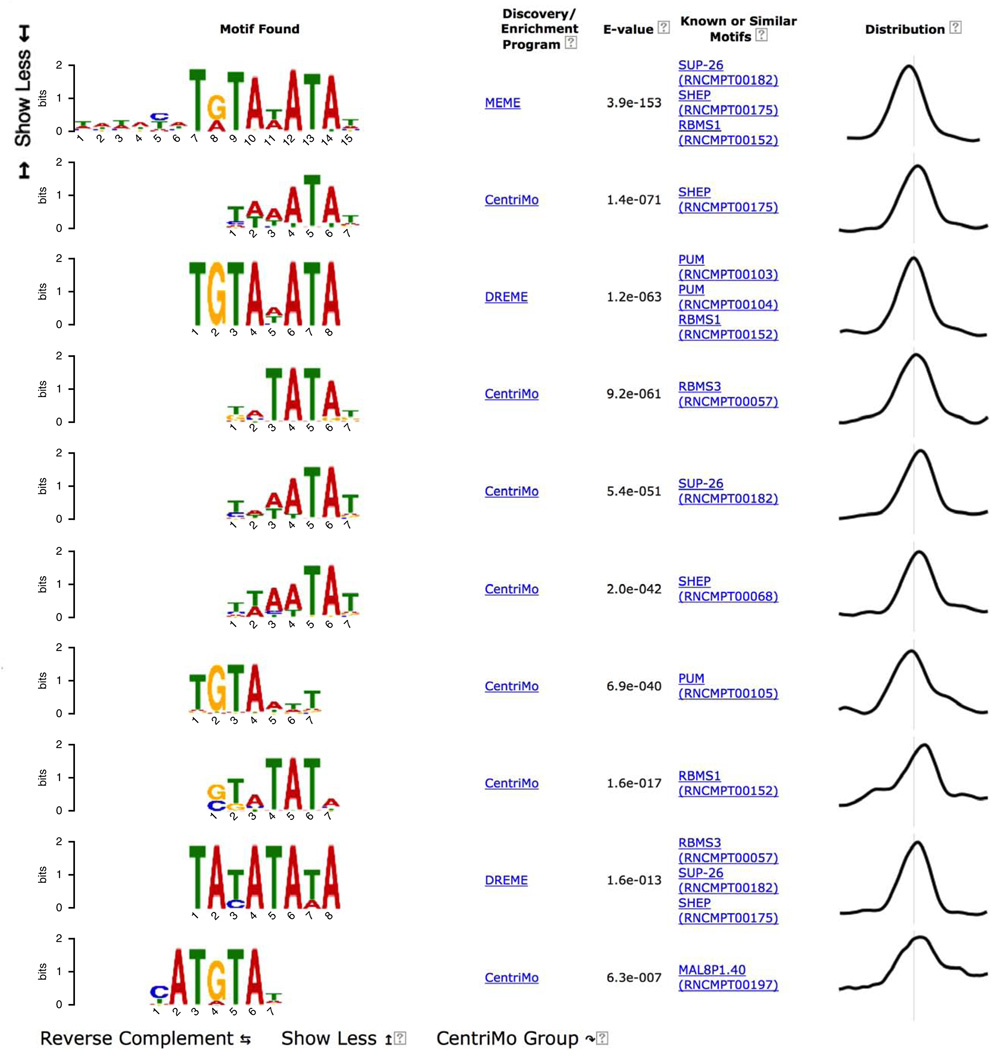
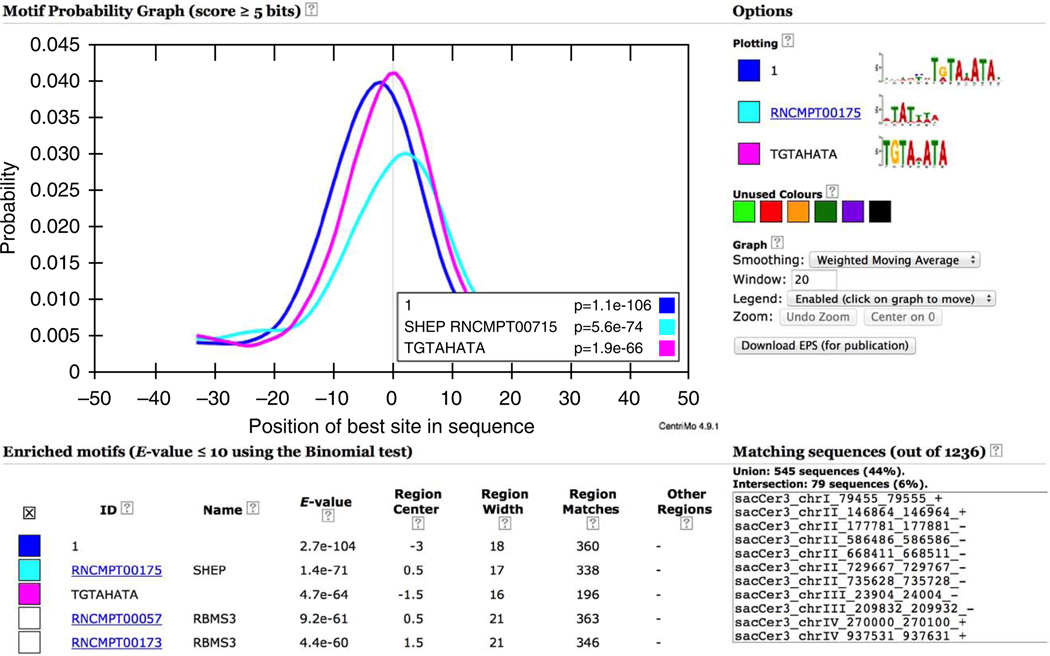
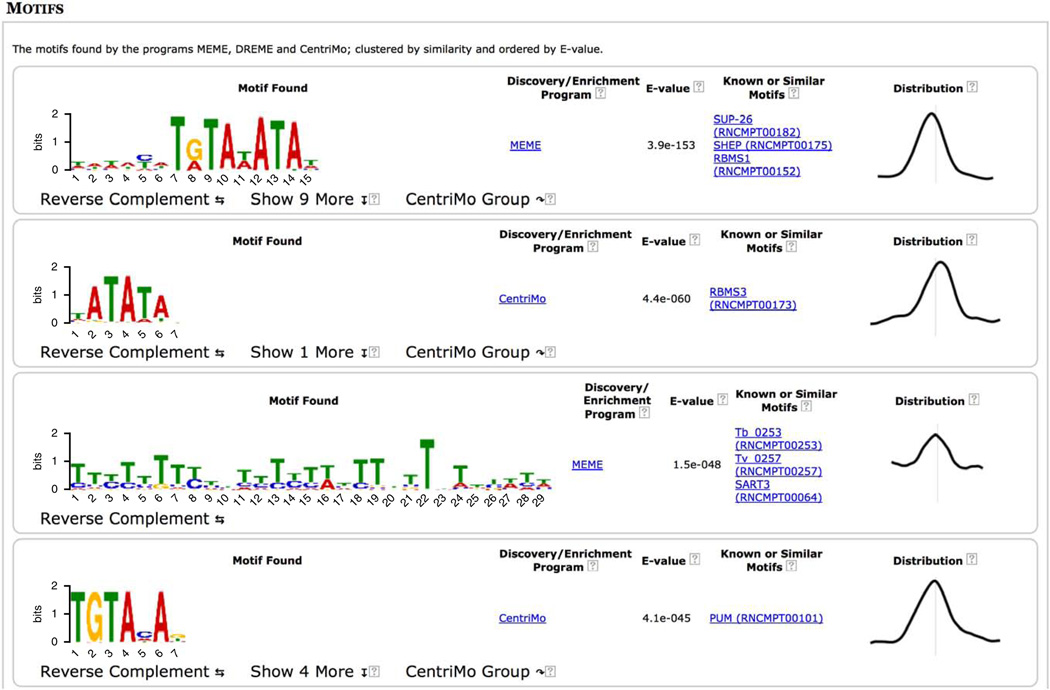
As with Study Case 1, you can view the MEME-ChIP report by clicking the link in the email you were sent upon submitting your job. The format and layout of the MEME-ChIP report is the same for DNA and RNA analyses (such as in this study case), so please refer to the previous section for explanations of each of the sections of the report and suggestions on how to navigate them. Note that we replace U with T when describing RNA-binding motifs and in motif logos in the steps that follow.
The most statistically significant motif found in the 1,236 RNA-Puf3p cross-linking regions is a MEME motif (Fig. 18) that generally matches previously reported RNA-binding consensus motifs for Puf3p, CHTGTAWATA19 and CHTGTAWATA WAWA28. The MEME motif extends the 5′ end of these motifs with a weak consensus of TATA to tataCHTGTA WATA, which perhaps coincidentally makes the motif nearly palindromic. Such palindromicity in an individual Puf3p-binding site would increase the tendency of the RNA to form a local secondary structure, which is known to reduce the ability of RBPs to bind6.
Figure 18.
Puf3p MEME-ChIP report (top).
Expanding the first motif’s group by clicking on ‘Show 9 More’ reveals that although both MEME and DREME discover motifs similar to the known Puf3p motif (Fig. 19 first and third motifs, respectively), the database of known RNA-binding motifs that we selected for this study case does not contain a motif for Puf3p. The closest match among the known motifs is the second motif (‘SHEP RNCMPT00175’21), which is lacking much of the 5′ region of the known Puf3p RNA-binding motif.
Figure 19.
Puf3p MEME-ChIP report (top motif group expanded).
Clicking on the first plot in the ‘Distribution’ column (Fig. 19) shows that the above-mentioned MEME, DREME and SHEP motifs are also the most significant in terms of local motif enrichment analysis according to CentriMo (Fig. 20). In this study case, we allowed CentriMo to find the region of the sequences with the highest motif enrichment among all possible regions, not just centered ones. The fact that the most significant region of enrichment of the MEME Puf3p motif is centered in the cross-linking regions is strong evidence that the PAR-CLIP experiment was successful.
Figure 20.
CentriMo analysis of Puf3p PAR-CLIP cross-linking regions (top three most locally enriched motifs).
Returning to the main MEME-ChIP output, the top four motifs (Fig. 21) include a very long MEME motif consisting mainly of pyrimidines, and a motif from Puf3p’s protein family (Pumilio-family, ‘PUM RNCMPT00101’). The biological interpretation of the MEME pyrimidine-rich motif (the third motif in Fig. 21) is not clear, although the CentriMo output shows it to match almost 20% of the 100-bp cross-linking regions at a score of at least 5 bits. This compares with almost 45% for the MEME Puf3p-like motif (data not shown). As for the known Pumilio-family motif, it differs substantially from the reported Puf3p consensus, which is consistent with it being less significantly enriched in the cross-linking regions.
Figure 21.
Puf3p MEME-ChIP report (top four motifs).
ACKNOWLEDGMENTS
This work was supported by the US National Institutes of Health awards R01 RR021692, R01 GM103544 and R01 GM098039.
Footnotes
AUTHOR CONTRIBUTIONS W.M. and W.S.N. wrote the initial draft. T.L.B. conceived the study cases, wrote the anticipated results section and wrote the second draft. W.M. and T.L.B. verified the study cases. W.S.N., W.M. and T.L.B. edited the final manuscript.
COMPETING FINANCIAI INTERESTS The authors declare no competing financial interests.
Reprints and permissions information is available online at http://www.nature.com/reprints/index.html.
References
- 1.Machanick P, Bailey TL. MEME-ChIP: motif analysis of large DNA datasets. Bioinformatics. 2011;27:1696–1697. doi: 10.1093/bioinformatics/btr189. [DOI] [PMC free article] [PubMed] [Google Scholar]
- 2.Bailey TL, Elkan CP. Fitting a mixture model by expectation-maximization to discover motifs in biopolymers. In: Altman R, Brutlag D, Karp P, Lathrop R, Searls D, editors. Proceedings of the Second International Conference on Intelligent Systems for Molecular Biology. AAAI Press; 1994. pp. 28–36. [PubMed] [Google Scholar]
- 3.Bailey TL. DREME: Motif discovery in transcription factor ChIP-seq data. Bioinformatics. 2011;27:1653–1659. doi: 10.1093/bioinformatics/btr261. [DOI] [PMC free article] [PubMed] [Google Scholar]
- 4.Bailey T, Machanick P. Inferring direct DNA binding from ChIP-seq. Nucleic Acids Res. 2012;40:e128. doi: 10.1093/nar/gks433. [DOI] [PMC free article] [PubMed] [Google Scholar]
- 5.ENCODE Project Consortium. An integrated encyclopedia of DNA elements in the human genome. Nature. 2012;489:57–74. doi: 10.1038/nature11247. [DOI] [PMC free article] [PubMed] [Google Scholar]
- 6.Freeberg MA, et al. Pervasive and dynamic protein binding sites of the mRNA transcriptome in Saccharomyces cerevisiae. Genome Biol. 2013;14:R13. doi: 10.1186/gb-2013-14-2-r13. [DOI] [PMC free article] [PubMed] [Google Scholar]
- 7.Kulakovskiy IV, Boeva VA, Favorov AV, Makeev VJ. Deep and wide digging for binding motifs in ChIP-seq data. Bioinformatics. 2010;26:2622–2623. doi: 10.1093/bioinformatics/btq488. [DOI] [PubMed] [Google Scholar]
- 8.Kuttippurathu L, et al. CompleteMOTIFs: DNA motif discovery platform for transcription factor binding experiments. Bioinformatics. 2011;27:715–717. doi: 10.1093/bioinformatics/btq707. [DOI] [PMC free article] [PubMed] [Google Scholar]
- 9.Jin VX, Apostolos J, Nagisetty NS, Farnham PJ. W-ChIPMotifs: a web application tool for de novo motif discovery from ChIP-based high-throughput data. Bioinformatics. 2009;25:3191–3193. doi: 10.1093/bioinformatics/btp570. [DOI] [PMC free article] [PubMed] [Google Scholar]
- 10.Zambelli F, Pesole G, Pavesi G. PscanChIP: finding over-represented transcription factor-binding site motifs and their correlations in sequences from ChIP-seq experiments. Nucleic Acids Res. 2013;41:W535–W543. doi: 10.1093/nar/gkt448. [DOI] [PMC free article] [PubMed] [Google Scholar]
- 11.Thomas-Chollier M, et al. A complete workflow for the analysis of full-size ChIP-seq (and similar) data sets using peak-motifs. Nat. Protoc. 2012;7:1551–1568. doi: 10.1038/nprot.2012.088. [DOI] [PubMed] [Google Scholar]
- 12.Sun W, et al. TherMos: estimating protein-DNA binding energies from in vivo binding profiles. Nucleic Acids Res. 2013;41:5555–5568. doi: 10.1093/nar/gkt250. [DOI] [PMC free article] [PubMed] [Google Scholar]
- 13.Bailey TL, et al. Practical guidelines for the comprehensive analysis of ChIP-seq data. PLoS Comput. Biol. 2013;9:e1003326. doi: 10.1371/journal.pcbi.1003326. [DOI] [PMC free article] [PubMed] [Google Scholar]
- 14.Stephen G, et al. ChIP-seq guidelines and practices of the ENCODE and modENCODE consortia. Genome Res. 2012;22:1813–1831. doi: 10.1101/gr.136184.111. [DOI] [PMC free article] [PubMed] [Google Scholar]
- 15.Park PJ. ChIP-seq: advantages and challenges of a maturing technology. Nat. Rev. Genet. 2009;10:669–680. doi: 10.1038/nrg2641. [DOI] [PMC free article] [PubMed] [Google Scholar]
- 16.Zhang Y, et al. Model-based analysis of ChIP-seq (MACS) Genome Biol. 2008;9:R137. doi: 10.1186/gb-2008-9-9-r137. [DOI] [PMC free article] [PubMed] [Google Scholar]
- 17.Sandelin A, Alkema W, Engstrom P, Wasserman W, Lenhard B. JASPAR: an open-access database for eukaryotic transcription factor binding profiles. Nucliec Acids Res. 2004;32:D91–D94. doi: 10.1093/nar/gkh012. [DOI] [PMC free article] [PubMed] [Google Scholar]
- 18.Newburger DE, Bulyk ML. UniPROBE: an online database of protein binding microarray data on protein-DNA interactions. Nucleic Acids Res. 2009;37(suppl. 1):D77–D82. doi: 10.1093/nar/gkn660. [DOI] [PMC free article] [PubMed] [Google Scholar]
- 19.Gerber AP, Herschlag D, Brown PO. Extensive association of functionally and cytotopically related mRNAs with Puf family RNA-binding proteins in yeast. PLoS Biol. 2004;2:e79. doi: 10.1371/journal.pbio.0020079. [DOI] [PMC free article] [PubMed] [Google Scholar]
- 20.Saint-Georges Y, et al. Yeast mitochondrial biogenesis: a role for the PUF RNA-binding protein Puf3p in mRNA localization. PLoS ONE. 2008;3:e2293. doi: 10.1371/journal.pone.0002293. [DOI] [PMC free article] [PubMed] [Google Scholar]
- 21.Ray D, et al. A compendium of RNA-binding motifs for decoding gene regulation. Nature. 2013;499:172–177. doi: 10.1038/nature12311. [DOI] [PMC free article] [PubMed] [Google Scholar]
- 22.Kent WJ, et al. The Human Genome Browser at UCSC. Genome Res. 2002;12:996–1006. doi: 10.1101/gr.229102. [DOI] [PMC free article] [PubMed] [Google Scholar]
- 23.Goecks J, Nekrutenko A, Taylor J. Galaxy: a comprehensive approach for supporting accessible, reproducible, and transparent computational research in the life sciences. Genome Biol. 2010;11:R86. doi: 10.1186/gb-2010-11-8-r86. [DOI] [PMC free article] [PubMed] [Google Scholar]
- 24.Wadman IA, et al. The LIM-only protein Lmo2 is a bridging molecule assembling an erythroid, DNA-binding complex which includes the TAL1, E47, GATA-1 and Ldb1/NLI proteins. EMBO J. 1997;16:3145–3157. doi: 10.1093/emboj/16.11.3145. [DOI] [PMC free article] [PubMed] [Google Scholar]
- 25.Whitington T, Frith MC, Johnson J, Bailey TL. Inferring transcription factor complexes from ChIP-seq data. Nucleic Acids Res. 2011;39:e98. doi: 10.1093/nar/gkr341. [DOI] [PMC free article] [PubMed] [Google Scholar]
- 26.Hess J, Angel P, Schorpp-Kistner M. AP-1 subunits: quarrel and harmony among siblings. J. Cell Sci. 2004;117:5965–5973. doi: 10.1242/jcs.01589. [DOI] [PubMed] [Google Scholar]
- 27.Tallack MR, et al. A global role for KLF1 in erythropoiesis revealed by ChIP-seq in primary erythroid cells. Genome Res. 2010;20:1052–1063. doi: 10.1101/gr.106575.110. [DOI] [PMC free article] [PubMed] [Google Scholar]
- 28.Hogan DJ, Riordan DP, Gerber AP, Herschlag D, Brown PO. Diverse RNA-binding proteins interact with functionally related sets of RNAs, suggesting an extensive regulatory system. PLoS Biol. 2008;6:e255. doi: 10.1371/journal.pbio.0060255. [DOI] [PMC free article] [PubMed] [Google Scholar]
- 29.Sharov AA, Ko MSH. Exhaustive search for over-represented DNA sequence motifs with CisFinder. DNA Res. 2009;16:261–273. doi: 10.1093/dnares/dsp014. [DOI] [PMC free article] [PubMed] [Google Scholar]
- 30.Luehr S, Hartmann H, Söding J. The XXmotif web server for eXhaustive, weight matriX-based motif discovery in nucleotide sequences. Nucleic Acids Res. 2012;40:W104–W109. doi: 10.1093/nar/gks602. (Web server issue) [DOI] [PMC free article] [PubMed] [Google Scholar]
- 31.Sung Rhee H, Franklin Pugh B. Comprehensive genome-wide protein-DNA interactions detected at single-nucleotide resolution. Cell. 2011;147:1408–1419. doi: 10.1016/j.cell.2011.11.013. [DOI] [PMC free article] [PubMed] [Google Scholar]
- 32.van Steensel B, Henikoff S. Identification of in vivo DNA targets of chromatin proteins using tethered dam methyltransferase. Nat. Biotechnol. 2000;18:424–428. doi: 10.1038/74487. [DOI] [PubMed] [Google Scholar]
- 33.Jolma A, et al. DNA-binding specificities of human transcription factors. Cell. 2013;152:327–339. doi: 10.1016/j.cell.2012.12.009. [DOI] [PubMed] [Google Scholar]
- 34.Licatalosi DD, et al. HITS-CLIP yields genome-wide insights into brain alternative RNA processing. Nature. 2008;456:464–469. doi: 10.1038/nature07488. [DOI] [PMC free article] [PubMed] [Google Scholar]
- 35.Sanford JR, et al. Splicing factor SFRS1 recognizes a functionally diverse landscape of RNA transcripts. Genome Res. 2009;19:381–394. doi: 10.1101/gr.082503.108. [DOI] [PMC free article] [PubMed] [Google Scholar]
- 36.Chi SW, Zang JB, Mele A, Darnell RB. Argonaute HITS-CLIP decodes microRNA-mRNA interaction maps. Nature. 2009;460:479–486. doi: 10.1038/nature08170. [DOI] [PMC free article] [PubMed] [Google Scholar]
- 37.Hafner M, et al. Transcriptome-wide identification of RNA-binding protein and microRNA target sites by PAR-CLIP. Cell. 2010;141:129–141. doi: 10.1016/j.cell.2010.03.009. [DOI] [PMC free article] [PubMed] [Google Scholar]
- 38.König J, et al. iCLIP reveals the function of hnRNP particles in splicing at individual nucleotide resolution. Nat. Struct. Mol. Biol. 2010;17:909–915. doi: 10.1038/nsmb.1838. [DOI] [PMC free article] [PubMed] [Google Scholar]
- 39.Zhang C, Darnell RB. Mapping in vivo protein-RNA interactions at single-nucleotide resolution from HITS-CLIP data. Nat. Biotechnol. 2011;29:607–614. doi: 10.1038/nbt.1873. [DOI] [PMC free article] [PubMed] [Google Scholar]
- 40.Crawford GE, et al. Genome-wide mapping of DNase hypersensitive sites using massively parallel signature sequencing (MPSS) Genome Res. 2006;16:123–131. doi: 10.1101/gr.4074106. [DOI] [PMC free article] [PubMed] [Google Scholar]
- 41.Giresi PG, Kim J, McDaniell RM, Iyer VR, Lieb JD. FAIRE (formaldehyde-assisted isolation of regulatory elements) isolates active regulatory elements from human chromatin. Genome Res. 2007;17:877–885. doi: 10.1101/gr.5533506. [DOI] [PMC free article] [PubMed] [Google Scholar]
- 42.Auerbach RK, et al. Mapping accessible chromatin regions using Sono-seq. Proc. Natl. Acad. Sci. USA. 2009;106:14926–14931. doi: 10.1073/pnas.0905443106. [DOI] [PMC free article] [PubMed] [Google Scholar]
- 43.Mortazavi A, Williams BA, McCue K, Schaeffer L, Wold B. Mapping and quantifying mammalian transcriptomes by RNA-seq. Nat. Methods. 2008;5:621–628. doi: 10.1038/nmeth.1226. [DOI] [PubMed] [Google Scholar]
- 44.Jin F, et al. A high-resolution map of the three-dimensional chromatin interactome in human cells. Nature. 2013;503:290–294. doi: 10.1038/nature12644. [DOI] [PMC free article] [PubMed] [Google Scholar]
- 45.Gupta S, Stamatoyannopoulos JA, Bailey TL, Noble WS. Quantifying similarity between motifs. Genome Biol. 2007;8:R24. doi: 10.1186/gb-2007-8-2-r24. [DOI] [PMC free article] [PubMed] [Google Scholar]
- 46.Kishore S, et al. A quantitative analysis of CLIP methods for identifying binding sites of RNA-binding proteins. Nat. Methods. 2011;8:559–564. doi: 10.1038/nmeth.1608. [DOI] [PubMed] [Google Scholar]
- 47.Corcoran DL, et al. PARalyzer: definition of RNA binding sites from PAR-CLIP short-read sequence data. Genome Biol. 2011;12:R79. doi: 10.1186/gb-2011-12-8-r79. [DOI] [PMC free article] [PubMed] [Google Scholar]


