

Abstract
Magnetic Resonance Elastography (MRE) of the liver is a novel noninvasive clinical diagnostic tool to stage fibrosis based on measured stiffness. The purpose of this study is to design, evaluate and validate a rapid MRE acquisition technique for noninvasively quantitating liver stiffness which reduces by half the scan time, thereby decreasing image registration errors between four MRE phase offsets. In vivo liver MRE was performed on 16 healthy volunteers and 14 patients with biopsy-proven liver fibrosis using the standard clinical Gradient Recalled Echo (GRE) MRE sequence (MREs) and a developed rapid GRE MRE sequence (MREr) to obtain the mean stiffness in an axial slice. The mean stiffness values obtained from the entire group using MREs and MREr were 2.72±0.85kPa and 2.7±0.85kPa, respectively, representing an insignificant difference. A linear correlation of R2=0.99 was determined between stiffness values obtained using MREs and MREr. Therefore, we can conclude that MREr can replace MREs, which reduces the scan time to half of that of the current standard acquisition (MREs), which will facilitate MRE imaging in patients with inability to hold their breath for long periods.
Keywords: MR Elastography, MRE, Liver MRE, Liver Fibrosis
Introduction
Hepatic disease is a major cause of mortality worldwide. Chronic liver diseases such as Hepatitis B (CHB), Hepatitis C (CHC), alcoholic liver disease (ALD) and nonalcoholic fatty liver disease (NAFLD) can lead to hepatocellular carcinoma (HCC) or liver fibrosis1.
Liver fibrosisis characterized by progressive deposition of excess collagen, proteoglycans, and other macromolecules in the extracellular matrix in response to repetitive liver injury from various chronic liver diseases2; it results in increasing stiffness of the hepatic tissues. Potential complications of cirrhosis include liver failure, portal hypertension, varices, HCC, and hepatic encephalopathy.
Originally considered to be irreversible, liver fibrosis is now regarded as a dynamic process with potential for regression3. Early detection of liver fibrosis may be helpful in the management of chronic liver diseases4–7. Although fibrosis is reversible if detected early, progressive fibrosis initiates the onset of hepatic cirrhosis which is irreversible and lethal in nature.
Currently, liver biopsy is the gold standard for detecting liverfibrosis8,9. However, liver biopsy is an invasive, expensive procedure associated with a high risk of complications10–13. It is also affected by substantial sampling error, thereby overestimating or underestimating the degree of fibrosis.
Magnetic Resonance Elastography (MRE) is a novel noninvasive technique to estimate stiffness of soft tissues8,9,14–23. MRE involves a three stage process. First, noninvasive vibrations are applied to the area of interest via a driver which transmits waves. Second, a phase-contrast magnetic resonance imaging (MRI) sequence synchronized to the externally-applied vibrations measures the wave displacement field. Finally, the wave images are then mathematically converted to spatial stiffness maps known as inversion, to assess the tissue stiffness.
Currently, MRE is a clinical tool to stage liver fibrosis8,9,24. Because, MRE is typically a breathhold technique and current clinical standard MRE sequence requires ~22 sec breathhold to obtain wave images/stiffness map for a single slice, it often becomes difficult for the patient with liver disease comply with needed suspended breathing. The purpose of our study is to design, evaluate, and validate a developed rapid MRE acquisition technique that can markedly reduce the breathhold time in noninvasively quantitating liver stiffness by MRE compared to the clinical standard MRE sequence.
Materials and Methods
The study protocol was approved by the institutional review board. Written informed consent was obtained and documented for all patients and volunteers. A total of 30 subjects (10 men, 20 women; age range, 20 – 66 years), including16 normal healthy individuals, and 14patients with biopsy-proven liver fibrosis, were included in the study.
Image Acquisition
All imaging was performed on 1.5T (Avanto, Siemens, Erlangen, Germany; n=6) or 3T (TimTrio, Siemens, Erlangen, Germany; n=24) MR imaging (MRI) scanners. For each examination, the subject was positioned supine.
For MRE in this study, mechanical waves were introduced into the subject’s liver by a commercial pneumatic driver system (Resoundant, Mayo Clinic Foundation, Rochester, MN) (Figure 1). The passive driver was placed anterior on the patient’s body close to the liver region (centered at the level of the xiphoid process) and secured with an elastic belt. The passive driver was connected via a polyvinylchloride tube to the active driver which was placed outside the scan room to induce 60 Hz vibrations in to the liver.
Figure 1. Experimental setup.
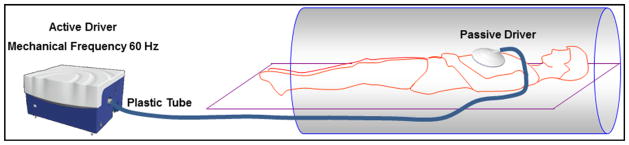
A passive driver is placed on the abdomen, on the ROI. Waves are noninvasively transmitted to the passive driver and into the subject. These waves are imaged by the MRI scanner and are used to calculate stiffness.
A standard gradient recalled echo (GRE) MRE sequence (MREs)9 and a developed rapid GRE MRE sequence (MREr) were used to acquire an axial slice covering a major portion of the liver. For MREs, bipolar motion encoding gradients (MEGs) shown in Figure 2a were used to obtain phase contrast MRI images. Bipolar gradients enhance phase contrast by discarding unwanted contributions to the phase caused by system imperfections. Since the magnitude of both the polarities of the bipolar gradients was constant, the phase difference image between the opposite polarities remained zero for static spins and encodes moving spins only. The polarities were swapped every other TR in synchronization with the external vibrations (Figure 2a). Four sets of wave images spaced equally over a period of the wave motion were obtained by changing the temporal relationship between the motion encoding gradients (MEGs) and the external vibrations. Figure 2a shows the pulse sequence diagram for MREs acquisition. For synchronization in continuous vibration mode TR should be equal to integer multiples of cycles of external vibrations (CEV). Currently, MREs uses an integer multiple of 3 (TR = 3 CEV). This resulted in a long breathhold of 22 seconds during end-expiration for a CEV of 60 Hz, for one slice. To reduce the breathhold time significantly, the TR was reduced to a multiple of 1.5 times the CEV (TR=1.5 CEV). To ensure synchronization of MEGs to the external vibrations and generate required phase contrast MRI images, the polarity of the MEGs was not alternated for every other TR (Figure 2b). The resulting MREr technique reduced the breathhold time to 11 seconds. The pulse sequence diagram for MREr is shown in Figure 2b.
Figure 2. Pulse sequence diagram.

a) shows the GRE based MREs pulse sequence. The polarities of the MEGs are swapped every other TR and the TR equals to 3 cycles of external motion (CEV). b) Shows the GRE based MREr pulse sequence. In MREr the polarities of the MEGs stay same for all the TR cycles. Every TR is synchronized with 1.5 CEV. For simplicity flow compensating gradients and killer gradients are not shown.
For both the MREs and MREr sequences, imaging parameters were set identically to the following: TE=21.4ms; TR=50ms(MREs), 25ms(MREr); FOV=40cm; α (Ernst Angle) =22° (MREs), 16° (MREr); slice thickness=5mm; matrix=128×64; Generalized Autocalibrating Partially Parallel Acquisitions (GRAPPA) acceleration factor of 2; vibration frequency= 60Hz; 4 MRE time offsets; and MEG of 16.67ms duration (60Hz) was applied to measure the through-plane tissue motion. The axial through-plane wave images for each volunteer were processed automatically on-line using a standard inversion algorithm to generate the stiffness maps8,9,25. Stiffness maps were displayed with a 95% confidence map to measure the mean stiffness of the liver. Similarly, phase difference signal to noise ratio (PDSNR)26 was also calculated.
Statistical Analysis
The mean stiffness values obtained using MREs and MREr were compared using a paired student’s t-test to test for significant differences (P<0.05) between the two acquisitions. A Least squares linear regression was performed between stiffness values obtained using MREs and MREr to determine the linear correlation. Furthermore, Bland-Altman analysis27 was performed to determine the agreement in mean stiffness values obtained using MREs and MREr.
Results
No difference in mean stiffness values was found between MREs and MREr. Figure 3 shows images from a normal volunteer, with Figures 3a and 3d showing axial magnitude images of the liver from MREs and MREr, respectively and Figures 3b (MREs) and 3e (MREr) are snap shots of through wave propagation in the liver. The stiffness maps are shown in figures 3c (MREs) and 3f (MREr) and indicate mean stiffness values of 1.77±0.39 kPa and 1.79±0.39 kPa, respectively.
Figure 3. MRE Normal HealthySubject.

Left Column: Images obtained using standard clinical GRE MRE sequence (MREs). Right Column: Images obtained using rapid GRE MRE sequence (MREr). a), d) Axial magnitude image of the liver showing the ROI (white dotted line). b), e) Snap shot of wave propagation in the liver. c, f) Stiffness map obtained using standard inversion from the scanner. The hatched region demonstrates the area with low phase difference SNR. The mean stiffness value obtained from the ROI is 1.77±0.39 kPa (MREs) and 1.79±0.39 kPa (MREr).
Mean Stiffness values obtained in a fibrosis patient using MREs and MREr showed no difference. Figure 4 shows images from a biopsy-proven stage 1 liver fibrosis patient. Figures 4c and 4f show stiffness maps indicating mean stiffness values of 3.38±0.92 kPa, 3.38±0.83 kPa obtained using MREs and MREr, respectively. The stiffness values obtained using both the techniques confirmed the stage 1 fibrosis results.
Figure 4. MRE Liver Fibrosis Patient.

Left Column: Images obtained using standard clinical GRE MRE sequence (MREs). Right Column: Images obtained using rapid GRE MRE sequence (MREr). a), d) Axial magnitude image of the liver showing the ROI (white dotted line). b), e) Snap shot of wave propagation in the liver. c, f) Stiffness map obtained using standard inversion from the scanner. The hatched region demonstrates the area with low phase difference SNR. The mean stiffness value obtained from the ROI is 3.38±0.92 kPa (MREs) and 3.38±0.83 kPa (MREr).
Table 1 shows the individual mean stiffness values and PDSNR(with ±1 standard deviation (SD)) obtained from both techniques for all subjects. The mean stiffness values obtained from the entire group of subjects using MREs and MREr was 2.72±0.85kPa and 2.7±0.85kPa, respectively. The PDSNR measurements from entire group using both techniques were greater than 3, which is the required threshold to generate robust stiffness maps; no significant difference (P=0.07) was found between stiffness values.
Table 1. Mean Stiffness and PDSNR Values.
Shows mean stiffness values and PDSNR from entire group of subjects obtained using MREs and MREr techniques.
| Subject | Stiffness Values (kPa) | PDSNR Values | ||
|---|---|---|---|---|
|
| ||||
| MREs | MREr | MREs | MREr | |
|
| ||||
| Mean±SD | Mean±SD | Mean±SD | Mean±SD | |
| 1 | 2.51±0.52 | 2.50±0.50 | 68.66±46.86 | 25.22±21.92 |
| 2 | 1.82±0.48 | 1.86±0.41 | 12.33±4.09 | 5.10±1.98 |
| 3 | 4.33±1.27 | 4.30±1.18 | 36.59±25.32 | 9.70±4.20 |
| 4 | 2.82±0.74 | 2.80±0.54 | 42.23±33.95 | 12.08±10.78 |
| 5 | 3.11±0.61 | 3.02±0.58 | 41.06±18.12 | 14.74±10.26 |
| 6 | 2.07±0.43 | 2.05±0.41 | 31.27±15.56 | 8.77±4.37 |
| 7 | 2.30±0.89 | 2.30±0.56 | 39.34±26.36 | 13.59±14.68 |
| 8 | 2.92±0.73 | 2.90±1.21 | 43.21±21.76 | 8.59±6.69 |
| 9 | 5.06±1.88 | 5.00±2.23 | 27.63±13.95 | 6.06±3.96 |
| 10 | 2.58±0.71 | 2.52±0.76 | 22.22±13.45 | 10.14±7.24 |
| 11 | 2.60±0.70 | 2.50±0.61 | 51.18±35.31 | 17.77±11.88 |
| 12 | 2.85±1.57 | 2.90±1.01 | 50.76±23.47 | 12.73±7.41 |
| 13 | 2.09±0.75 | 2.17±0.61 | 65.99±43.63 | 18.28±12.97 |
| 14 | 5.24±1.79 | 5.23±1.56 | 50.46±33.47 | 16.1±10.61 |
| 15 | 3.96±1.27 | 3.76±1.18 | 36.63±22.08 | 17.24±10.45 |
| 16 | 2.36±0.59 | 2.42±0.64 | 51.04±28.42 | 16.41±7.08 |
| 17 | 2.54±0.91 | 2.59±0.93 | 26.69±15.69 | 12.50±6.45 |
| 18 | 2.26±0.69 | 2.11±0.60 | 7.98±4.48 | 3.73±1.52 |
| 19 | 1.69±0.28 | 1.62±0.31 | 77.70±28.61 | 11.21±5.67 |
| 20 | 3.25±2.29 | 3.34±3.04 | 80.60±63.31 | 16.8±7.06 |
| 21 | 2.14±0.51 | 2.22±0.52 | 73.82±24.82 | 15.77±5.14 |
| 22 | 2.08±0.50 | 2.02±0.66 | 18.64±10.23 | 3.10±1.61 |
| 23 | 2.08±0.38 | 2.17±0.45 | 30.61±20.12 | 20.76±20.1 |
| 24 | 2.16±0.58 | 2.09±0.66 | 42.82±45.1 | 8.81±7.95 |
| 25 | 1.77±0.39 | 1.79±0.39 | 37.23±23.53 | 11.39±7.24 |
| 26 | 2.38±0.64 | 2.23±0.78 | 32.48±17.19 | 9.00±6.33 |
| 27 | 1.72±0.64 | 1.68±0.68 | 5.06±3.13 | 6.59±3.99 |
| 28 | 2.63±1.12 | 2.56±0.91 | 15.38±9.68 | 6.02±5.84 |
| 29 | 3.03±0.84 | 2.95±0.86 | 6.12±4.51 | 3.63±2.11 |
| 30 | 3.38±0.92 | 3.38±0.83 | 49.86±41.11 | 20.33±18.78 |
|
| ||||
| Average | 2.72±0.85 | 2.70±0.85 | 39.18±23.91 | 12.04±8.21 |
A strong linear correlation was found between stiffness values obtained using MREs and MREr. Figure 5 shows the plot of stiffness values obtained using MREs and MREr with a linear correlation of R2=0.99.
Figure 5. MREs and MREr correlation.

Plot of stiffness values obtained using MREs and MREr showing a linear correlation of R2=0.99.
Bland-Altman analysis showed good agreement in stiffness values obtained using MREs and MREr. Figure 6 shows the plot of difference in stiffness values between the two techniques as a function of mean stiffness. The mean bias between the two techniques was found to be 0.03 kPa, and the limits of agreement (i.e. mean bias ± 2 standard deviation (SD)) was found to be 0.32 kPa and −0.27 kPa; all bias measurements were within the limits of agreement.
Figure 6. Bland-Altman Analysis.

Plot of difference in stiffness values obtained using MREs and MREr as function of mean stiffness values obtained using both the techniques with a mean bias of 0.03kPa.
Discussion
Liver biopsy has been considered the gold standard for assessment of liver fibrosis. However, its limitations are well recognized, and include discomfort, risk of complications, and costs. It is subject to sampling errors, owing presumably to heterogeneity in the distribution of pathologic lesions in the liver parenchyma28. A difference of at least one stage was found in 33% of patients in a study that examined paired liver biopsy samples from the left and right lobes simultaneously11. Therefore, several noninvasive imaging techniques have been developed to help diagnose and stage liver fibrosis. These include serum markers29, ultrasound-based transient Elastography (Fibroscan)30,31 and MRI-based functional imaging methods. Although serum markers are noninvasive, variable accuracies for the diagnosis of liver fibrosis has been reported29. Ultrasound-based transient elastography has demonstrated a strong correlation between liver stiffness and increasing degrees of fibrosis30,31, but it only provides global measure of stiffness. Several MRI-based techniques have been evaluated for assessing hepatic fibrosis, including diffusion weighted imaging (DWI)32, perfusion MRI, MR spectroscopy (MRS)33. However, MRE has shown greater sensitivity and specificity in staging liver fibrosis and also providing spatial stiffness map8,9,22–25.
We have developed a rapid MRE sequence that can reduce by half the scan time for evaluating liver stiffness reflecting degrees of fibrosis, in comparison to the clinical standard MRE sequence. When applied to our study population which included both normal healthy volunteers and patients with biopsy proven liver fibrosis, no significant difference was observed in mean stiffness values between MREs and MREr. The stiffness values obtained using both the techniques matched in normal healthy individuals as well as in patients with liver fibrosis. Therefore, MREr can replace the MREs sequence for routine clinical investigations.
MREr sequence requires only a 11sec breathhold to acquire single-slice wave images to generate a stiffness map. This sequence uses a GRAPPA acceleration factor of 2 and does not require additional reference scan. The reference scan lines are incorporated into the same sequence and the required data sets are obtained in a single breathhold. If needed, a separate reference scan can be acquired, and which would further reduce the scan time of MREr. This would also reduce the scan time of MREs. Similarly, other strategies such as higher GRAPPA acceleration factors and also reducing the number of reference lines can further reduce the scan time for both the techniques independently. However, further investigations are required to achieve higher acceleration factors and reducing the number of reference lines and still be able to achieve robust stiffness maps using both the techniques.
The magnitude images show decrease in MRI signal in MREr when compared to MREs sequence. The TR in MREs sequence is longer and had more relaxation time compared to the MREr sequence for the T1 to recover before the next radio frequency pulse. Therefore, MREs has little more signal to start with when compared to the MREr sequence. However, this difference in signal to noise ratio (SNR) did not affect the MRE-derived stiffness estimates. MRE-derived stiffness estimates depend on PDSNR and PDSNR>326 is considered to be the minimum required SNR to achieve robust stiffness estimates. Therefore, the PDSNR obtained from MREr sequence is always greater than 3 and hence, we did not observe significant difference in stiffness estimates obtained using MREs and MREr.
Our study has some limitations. First, there might be variability of strapping the passive driver to the subjects; differences in body habitus causes variability in contact area which will cause PDSNR differences between subjects. Second, the variation in amount of vibrational power applied in each patient will cause variation in signal sensitivity, which also alters the PDSNR. Third, the spatial stiffness maps generated by MREs and MREr are slightly different due to the inconsistencies in breathhold from one MRE acquisition to the other thereby causing slight off-shift in slice of interest. Additionally, the inconsistency in breathhold also causes variation in the contact area of the MRE driver with the abdomen leading to subtle variation in wave propagation generating slight variation in spatial stiffness maps. Despite these limitations, both the sequences generated insignificant robust average stiffness estimates.
Future work involves applying MREr clinically for staging the liver fibrosis and also for diagnosing other liver diseases but not limited to nonalcoholic fatty liver disease and nonalcoholic steatohepatitis. Furthermore, modifying current MREr technique with higher acceleration factors using parallel imaging strategies will further reduce the scan time thereby enabling more coverage of the liver in a breathhold.
Conclusion
In conclusion, stiffness values obtained using MREs and MREr demonstrated a very strong linear correlation with no significant difference between the two techniques. Furthermore, MREr acquisition technique reduces the scan time to half of that of the current standard acquisition, thereby reducing image registration errors between four MRE phase offset images. This will allow more efficient MRE imaging in patients with inability to hold their breath for long period.
Acknowledgments
Authors would like to acknowledge grant sponsors; American Heart Association: 13SDG14690027 and Center for Clinical & Translational Sciences: UL1TR000090.
References
- 1.Bataller R, Brenner DA. Liver fibrosis. J Clin Invest. 2005;115(2):209–18. doi: 10.1172/JCI24282. [DOI] [PMC free article] [PubMed] [Google Scholar]
- 2.Friedman SL. Hepatic fibrosis -- overview. Toxicology. 2008;254(3):120–9. doi: 10.1016/j.tox.2008.06.013. [DOI] [PubMed] [Google Scholar]
- 3.Wallace K, Burt AD, Wright MC. Liver fibrosis. Biochem J. 2008;411(1):1–18. doi: 10.1042/BJ20071570. [DOI] [PubMed] [Google Scholar]
- 4.Friedman SL, Bansal MB. Reversal of hepatic fibrosis -- fact or fantasy? Hepatology. 2006;43(2 Suppl 1):S82–8. doi: 10.1002/hep.20974. [DOI] [PubMed] [Google Scholar]
- 5.Farci P, Roskams T, Chessa L, Peddis G, Mazzoleni AP, Scioscia R, Serra G, Lai ME, Loy M, Caruso L, et al. Long-term benefit of interferon alpha therapy of chronic hepatitis D: regression of advanced hepatic fibrosis. Gastroenterology. 2004;126(7):1740–9. doi: 10.1053/j.gastro.2004.03.017. [DOI] [PubMed] [Google Scholar]
- 6.Dixon JB, Bhathal PS, Hughes NR, O’Brien PE. Nonalcoholic fatty liver disease: Improvement in liver histological analysis with weight loss. Hepatology. 2004;39(6):1647–54. doi: 10.1002/hep.20251. [DOI] [PubMed] [Google Scholar]
- 7.Fowell AJ, Iredale JP. Emerging therapies for liver fibrosis. Dig Dis. 2006;24(1–2):174–83. doi: 10.1159/000090320. [DOI] [PubMed] [Google Scholar]
- 8.Yin M, Talwalkar JA, Glaser KJ, Manduca A, Grimm RC, Rossman PJ, Fidler JL, Ehman RL. Assessment of hepatic fibrosis with magnetic resonance elastography. Clinical Gastroenterology and Hepatology. 2007;5:1207–1213. doi: 10.1016/j.cgh.2007.06.012. [DOI] [PMC free article] [PubMed] [Google Scholar]
- 9.Venkatesh SK, Yin M, Ehman RL. Magnetic resonance elastography of liver: technique, analysis, and clinical applications. J Magn Reson Imaging. 2013;37(3):544–55. doi: 10.1002/jmri.23731. [DOI] [PMC free article] [PubMed] [Google Scholar]
- 10.Maharaj B, Maharaj RJ, Leary WP, Cooppan RM, Naran AD, Pirie D, Pudifin DJ. Sampling variability and its influence on the diagnostic yield of percutaneous needle biopsy of the liver. Lancet. 1986;1(8480):523–5. doi: 10.1016/s0140-6736(86)90883-4. [DOI] [PubMed] [Google Scholar]
- 11.Regev A, Berho M, Jeffers LJ, Milikowski C, Molina EG, Pyrsopoulos NT, Feng ZZ, Reddy KR, Schiff ER. Sampling error and intraobserver variation in liver biopsy in patients with chronic HCV infection. Am J Gastroenterol. 2002;97(10):2614–8. doi: 10.1111/j.1572-0241.2002.06038.x. [DOI] [PubMed] [Google Scholar]
- 12.Bedossa P, Dargere D, Paradis V. Sampling variability of liver fibrosis in chronic hepatitis C. Hepatology. 2003;38(6):1449–57. doi: 10.1016/j.hep.2003.09.022. [DOI] [PubMed] [Google Scholar]
- 13.Piccinino F, Sagnelli E, Pasquale G, Giusti G. Complications following percutaneous liver biopsy. A multicentre retrospective study on 68, 276 biopsies. J Hepatol. 1986;2(2):165–73. doi: 10.1016/s0168-8278(86)80075-7. [DOI] [PubMed] [Google Scholar]
- 14.Kolipaka A, Aggarwal SR, McGee KP, Anavekar N, Manduca A, Ehman RL, Araoz PA. Magnetic resonance elastography as a method to estimate myocardial contractility. J Magn Reson Imaging. 2012;36(1):120–7. doi: 10.1002/jmri.23616. [DOI] [PMC free article] [PubMed] [Google Scholar]
- 15.Kolipaka A, Araoz PA, McGee KP, Manduca A, Ehman RL. Magnetic resonance elastography as a method for the assessment of effective myocardial stiffness throughout the cardiac cycle. Magn Reson Med. 2010;64:862–70. doi: 10.1002/mrm.22467. [DOI] [PMC free article] [PubMed] [Google Scholar]
- 16.Kolipaka A, Woodrum D, Araoz PA, Ehman RL. MR elastography of the in vivo abdominal aorta: a feasibility study for comparing aortic stiffness between hypertensives and normotensives. J Magn Reson Imaging. 2012;35(3):582–6. doi: 10.1002/jmri.22866. [DOI] [PMC free article] [PubMed] [Google Scholar]
- 17.Mariappan YK, Glaser KJ, Hubmayr RD, Manduca A, Ehman RL, McGee KP. MR elastography of human lung parenchyma: Technical development, theoretical modeling and in vivo validation. J Magn Reson Imaging. 2011;33(6):1351–61. doi: 10.1002/jmri.22550. [DOI] [PMC free article] [PubMed] [Google Scholar]
- 18.McGee KP, Mariappan YK, Hubmayr RD, Carter RE, Bao Z, Levin DL, Manduca A, Ehman RL. Magnetic resonance assessment of parenchymal elasticity in normal and edematous, ventilator injured lung. J Appl Physiol. 2012 doi: 10.1152/japplphysiol.01628.2011. [DOI] [PMC free article] [PubMed] [Google Scholar]
- 19.Muthupillai R, Lomas DJ, Rossman PJ, Greenleaf JF, Manduca A, Ehman RL. Magnetic resonance elastography by direct visualization of propagating acoustic strain waves. Science. 1995;269(5232):1854–7. doi: 10.1126/science.7569924. [DOI] [PubMed] [Google Scholar]
- 20.Sack I, Beierbach B, Hamhaber U, Klatt D, Braun J. Non-invasive measurement of brain viscoelasticity using magnetic resonance elastography. NMR Biomed. 2008;21(3):265–71. doi: 10.1002/nbm.1189. [DOI] [PubMed] [Google Scholar]
- 21.Sinkus R, Siegmann K, Xydeas T, Tanter M, Claussen C, Fink M. MR elastography of breast lesions: understanding the solid/liquid duality can improve the specificity of contrast-enhanced MR mammography. Magn Reson Med. 2007;58:1135–1144. doi: 10.1002/mrm.21404. [DOI] [PubMed] [Google Scholar]
- 22.Talwalkar JA. Elastography for detecting hepatic fibrosis: options and considerations. Gastroenterology. 2008;135(1):299–302. doi: 10.1053/j.gastro.2008.05.038. [DOI] [PMC free article] [PubMed] [Google Scholar]
- 23.Venkatesh SK, Yin M, Glockner JF, Takahashi N, Araoz PA, Talwalkar JA, Ehman RL. MR elastography of liver tumors: preliminary results. AJR Am J Roentgenol. 2008;190(6):1534–40. doi: 10.2214/AJR.07.3123. [DOI] [PMC free article] [PubMed] [Google Scholar]
- 24.Huwart L, Sempoux C, Vicaut E, Salameh N, Annet L, Danse E, Peeters F, ter Beek LC, Rahier J, Sinkus R, et al. Magnetic resonance elastography for the noninvasive staging of liver fibrosis. Gastroenterology. 2008;135(1):32–40. doi: 10.1053/j.gastro.2008.03.076. [DOI] [PubMed] [Google Scholar]
- 25.Manduca A, Oliphant TE, Dresner MA, Mahowald JL, Kruse SA, Amromin E, Felmlee JP, Greenleaf JF, Ehman RL. Magnetic resonance elastography: non-invasive mapping of tissue elasticity. Med Image Anal. 2001;5(4):237–54. doi: 10.1016/s1361-8415(00)00039-6. [DOI] [PubMed] [Google Scholar]
- 26.Yin M, Talwalkar JA, Glaser KJ, Venkatesh SK, Chen J, Manduca A, Ehman RL. Dynamic postprandial hepatic stiffness augmentation assessed with MR elastography in patients with chronic liver disease. AJR Am J Roentgenol. 2011;197(1):64–70. doi: 10.2214/AJR.10.5989. [DOI] [PMC free article] [PubMed] [Google Scholar]
- 27.Bland JM, Altman DG. Statistical methods for assessing agreement between two methods of clinical measurement. Lancet. 1986;1(8476):307–10. [PubMed] [Google Scholar]
- 28.Ratziu V, Charlotte F, Heurtier A, Gombert S, Giral P, Bruckert E, Grimaldi A, Capron F, Poynard T. Sampling variability of liver biopsy in nonalcoholic fatty liver disease. Gastroenterology. 2005;128(7):1898–906. doi: 10.1053/j.gastro.2005.03.084. [DOI] [PubMed] [Google Scholar]
- 29.Afdhal NH, Nunes D. Evaluation of liver fibrosis: a concise review. Am J Gastroenterol. 2004;99(6):1160–74. doi: 10.1111/j.1572-0241.2004.30110.x. [DOI] [PubMed] [Google Scholar]
- 30.Sandrin L, Fourquet B, Hasquenoph JM, Yon S, Fournier C, Mal F, Christidis C, Ziol M, Poulet B, Kazemi F, et al. Transient elastography: a new noninvasive method for assessment of hepatic fibrosis. Ultrasound Med Biol. 2003;29(12):1705–13. doi: 10.1016/j.ultrasmedbio.2003.07.001. [DOI] [PubMed] [Google Scholar]
- 31.Castera L, Vergniol J, Foucher J, Le Bail B, Chanteloup E, Haaser M, Darriet M, Couzigou P, De Ledinghen V. Prospective comparison of transient elastography, Fibrotest, APRI, and liver biopsy for the assessment of fibrosis in chronic hepatitis C. Gastroenterology. 2005;128(2):343–50. doi: 10.1053/j.gastro.2004.11.018. [DOI] [PubMed] [Google Scholar]
- 32.Girometti R, Furlan A, Bazzocchi M, Soldano F, Isola M, Toniutto P, Bitetto D, Zuiani C. Diffusion-weighted MRI in evaluating liver fibrosis: a feasibility study in cirrhotic patients. Radiol Med. 2007;112(3):394–408. doi: 10.1007/s11547-007-0149-1. [DOI] [PubMed] [Google Scholar]
- 33.Lim AK, Patel N, Hamilton G, Hajnal JV, Goldin RD, Taylor-Robinson SD. The relationship of in vivo 31P MR spectroscopy to histology in chronic hepatitis C. Hepatology. 2003;37(4):788–94. doi: 10.1053/jhep.2003.50149. [DOI] [PubMed] [Google Scholar]