Abstract
Objective:
The aim of this study was to provide quantitative measures of changes in cortical atrophy over a 2-year period associated with 3 subtypes of primary progressive aphasia (PPA) using whole-brain vertex-wise and region-of-interest (ROI) neuroimaging methods. The purpose was to quantitate disease progression, establish an empirical basis for clinical expectations, and provide outcome measures for therapeutic trials.
Methods:
Changes in cortical thickness and volume loss as well as neuropsychological performance were assessed at baseline and 2-year follow-up in 26 patients who fulfilled criteria for logopenic (8 patients), agrammatic (10 patients), and semantic (8 patients) PPA subtypes. Whole-brain vertex-wise and ROI imaging analysis were conducted using the FreeSurfer longitudinal pipeline.
Results:
Clinical deficits and cortical atrophy patterns showed distinct patterns of change among the subtypes over 2 years. Results confirmed that progression for each of the 3 subtypes showed left greater than right hemisphere asymmetry. An ROI analysis also revealed that progression was greater within, rather than outside, the language network.
Conclusions:
Preferential neurodegeneration of the left hemisphere language network is a common denominator for all 3 PPA subtypes, even as the disease progresses. Using a focal cortical language network ROI as an outcome measure of disease progression appears to be more sensitive than whole-brain or ventricular volume measures of change and may be helpful for designing future clinical trials in PPA.
Primary progressive aphasia (PPA) is a clinical dementia syndrome defined by deterioration of language functions over time and relative sparing of other cognitive domains.1 Three clinical variants are based on the nature of language impairment: agrammatic (PPA-G), semantic (PPA-S), and logopenic (PPA-L).2,3 Great strides have been made to understand the relationship among clinical phenotype, regions of peak atrophy, and underlying neuropathology; however, quantitative information about the clinico-anatomical course of the syndrome remains relatively sparse. Descriptive case reports1 and small group studies have established the focal nature of PPA over time, but few studies4,5 make comparisons among the 3 PPA subtypes and provide quantitative estimates that may be useful for designing therapeutic trials.
The current study provides quantitative metrics of cortical change associated with PPA subtypes over a 2-year interval using whole-brain vertex-wise and region-of-interest (ROI) measures to determine the distribution and asymmetry of atrophy for each. Of particular interest was determining whether progressive atrophy was greater within, vs outside of, the language network.
METHODS
Participants.
The core diagnosis of PPA was based on an initially isolated and progressive language impairment.1,6,7 Thirty-one patients had a root diagnosis of PPA and longitudinal data available at the time of analysis. Five were excluded from the analysis: 2 too severely impaired at their baseline visit to be subtyped (Western Aphasia Battery–Aphasia Quotient [WAB-AQ] <65), 2 with a mixed phenotype, and one who was unclassifiable. Thus, 26 patients with early to moderate PPA at their baseline visit (based on WAB-AQ and clinical assessment) and 35 cognitively healthy controls of similar age and education level were included in the study. All patients with PPA completed MRI at visit 1 (V1) and visit 2 (V2; 2 years later; range: 21–27 months).
Standard protocol approvals, registrations, and patient consents.
Participants were recruited from Northwestern University's PPA Research Program. Written informed consent was obtained from all participants. The Northwestern University Institutional Review Board approved this study.
Subtyping.
Subtyping was determined at the initial visit by quantitative performance on the measures described below according to previously reported guidelines3,8 and clinical judgment when data were not available. This study included 8 PPA-L, 10 PPA-G, and 8 PPA-S patients. One of the patients with PPA-S previously reported8 was in the “prodromal” stage at V1.
Neuropsychological measures.
Aphasia severity.
The WAB-AQ9 measured aphasia severity based on auditory comprehension, naming, repetition, and spontaneous speech.
Grammatical production.
A composite score for grammatical processing was created from 15 noncanonical sentence items from the Northwestern Anagram Test10 and 15 noncanonical sentence items from the Sentence Production Priming Test of the Northwestern Assessment of Verbs and Sentences, as described previously.8
Semantic processing.
A subset of moderately difficult items (items 157–192) from the fourth edition of the Peabody Picture Vocabulary Test11 was used as a measure of auditory lexical-semantic processing. These items were specifically chosen because of their proven value in subtyping PPA.3
Naming.
Naming ability was assessed with the Boston Naming Test.
Repetition.
The 6 most difficult items (items 10–15) from the WAB Repetition subtest were used to quantitate repetition, as previously described.8
Nonlanguage domains.
The presence of deficits in memory performance, comportment, and/or visuospatial abilities would preclude a PPA diagnosis at baseline. These features were judged on the basis of formal test scores and/or informant report by an expert behavioral neurologist (M.-M.M.) and deemed to be intact at V1. Motor-speech impairments were absent in the patients with PPA-S and PPA-L and present in 4 patients with PPA-G at V1.
MRI acquisition parameters.
T1-weighted, 3-dimensional, magnetization-prepared rapid-acquisition gradient echo sequences (repetition time = 2,300 milliseconds, echo time = 2.91 milliseconds, inversion time = 900 milliseconds, flip angle = 9°, field of view = 256 mm), recording 176 slices at a slice thickness of 1.0 mm, were acquired on a 3T Siemens TRIO (Siemens AG, Erlangen, Germany) using a 12-channel birdcage head coil. Imaging was performed at Northwestern University's Center for Translational Imaging.
Cortical thickness and volume measurements.
MRIs were processed using the cross-sectional12 and longitudinal13 pipelines from FreeSurfer (v5.1.0, http://surfer.nmr.mgh.harvard.edu/). Cortical thickness estimates were calculated by measuring surface distances between representations of the white-gray and pial-CSF boundaries. Topological surface errors were corrected by manual intervention according to established guidelines14 in an iterative fashion until completely resolved.
In addition to whole-brain vertex-wise cortical thickness analysis, 3 bilateral a priori ROIs were identified. First, an ROI of the entire neocortical surface (cortex) served as a global measure of atrophy for each hemisphere.15 Second, a language network ROI was defined for the perisylvian cortex, including the insula and surrounding temporal regions (perisylvian temporal cortex [PSTC]). This ROI was defined in magnetic resonance space under the guidance of an expert neuroanatomist (M.G.) using anatomical descriptions from Duvernoy16 and Naidich et al.17 Boundaries are as follows: starting at the anterior portion of inferior frontal sulcus, the boundary moves posteriorly to the precentral sulcus, then ventrally to upper limits of the insula and posteriorly to the descending limb of the postcentral sulcus, superiorly along the postcentral sulcus, and dorsally along the intraparietal sulcus to its descending termination point. The boundary then takes the shortest distance to the temporal/occipital notch, and proceeds anteriorly along the transverse collateral sulcus into the collateral sulcus, and then to the rhinal sulcus, continuing dorsally into the falciform fold of the insulo-temporal junction, anteriorly into the lateral orbital sulcus, and finally takes the shortest path back into the anterior portion of inferior frontal sulcus. Demarcation of this region showed good inter- and intrarater reliability in a test set of 10 subjects manually traced by E.R. and D.C.18 Dynamic programming19 delineated PSTC boundaries on a surface of the white-gray boundary, then propagated onto node-matched pial surface vertices. Finally, the PSTC ROI was generated across all study subjects as a cortical label using automated FreeSurfer algorithms. The third ROI consisted of cortical surface outside of the PSTC (remainder = cortex − PSTC) and served to determine whether changes in volume were occurring within or outside of the language network.
Estimates of cortical gray matter volume (mm3) were extracted bilaterally for each ROI using standard FreeSurfer algorithms in subject native space. Adjustments for intracranial volume were calculated for ROI at each time point using validated methods within the FreeSurfer toolkit.20 Because the data were longitudinal, each subject's estimated total intracranial volume (eTIV) was calculated based on the combined template from V1 and V2.13 Normalized volume for each ROI was calculated using the following formula20:
where ROInormalized is the adjusted volume, ROInative is the FreeSurfer calculated ROI volume in patient native space, and eTIVnative is for that patient and eTIVgroup is the average for the PPA group (1,514,132 mm3). The Atlas Scaling Factor (ASF) is the ratio of volume expansion or contraction each MR volume undergoes during spatial normalization to FreeSurfer's average template.
The percent change in volume from V1 to V2 was calculated as follows:
 |
Statistical analysis.
Vertex-wise cortical thickness between-group differences were calculated by conducting a general linear model across every vertex along the cortical surface, derived from structural magnetic resonance data processed with FreeSurfer. Within-group longitudinal vertex-wise analyses were conducted using paired t tests along the cortical surface. False discovery rates were set at 0.05 for these analyses.21
Paired t tests were used to compare ROI data from V1 to V2 within subtype with a Bonferroni-corrected significance criterion of p ≤ 0.017. One-way analyses of variance (ANOVAs) and post hoc t tests were used to compare subtypes. A significance criterion of p ≤ 0.05 was used for the main effect and p ≤ 0.017 was used for each of the 3 pairwise tests. Separate analyses were done for each ROI.
RESULTS
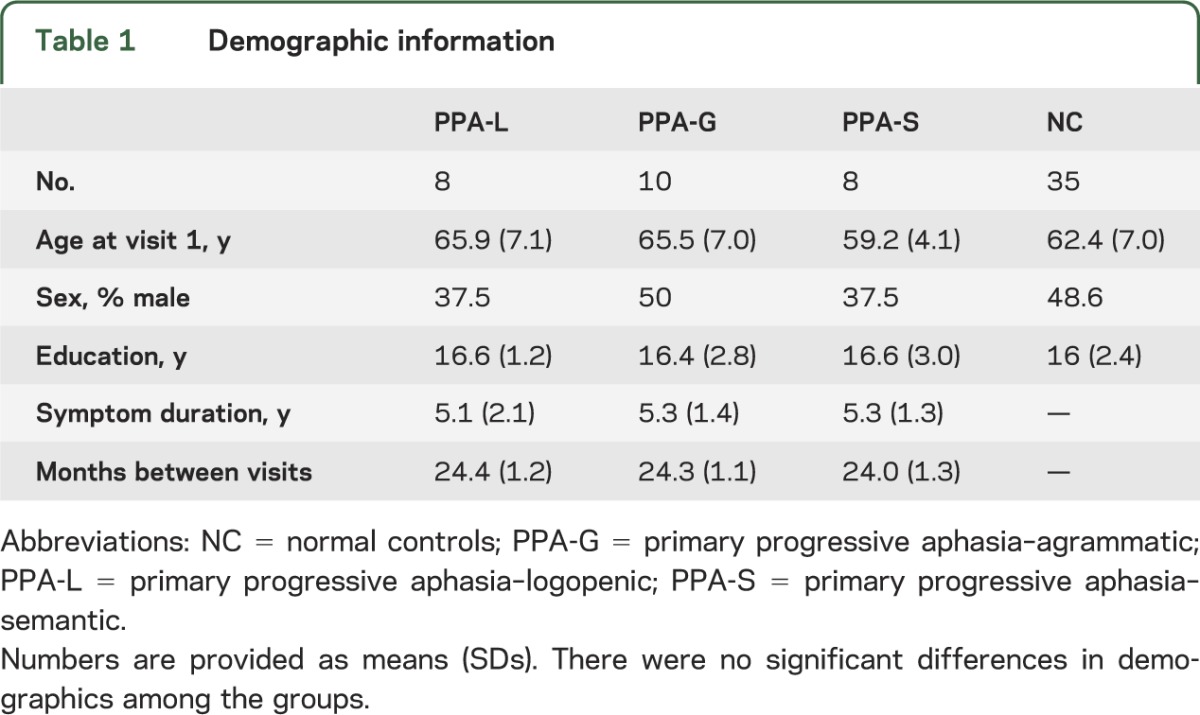
Twenty-six patients with PPA (8 PPA-L, 10 PPA-G, 8 PPA-S) and 35 controls were included in the analyses. There were no significant differences in demographics among the groups (table 1).
Table 1.
Demographic information
Vertex-wise patterns of cortical atrophy by PPA subtype.
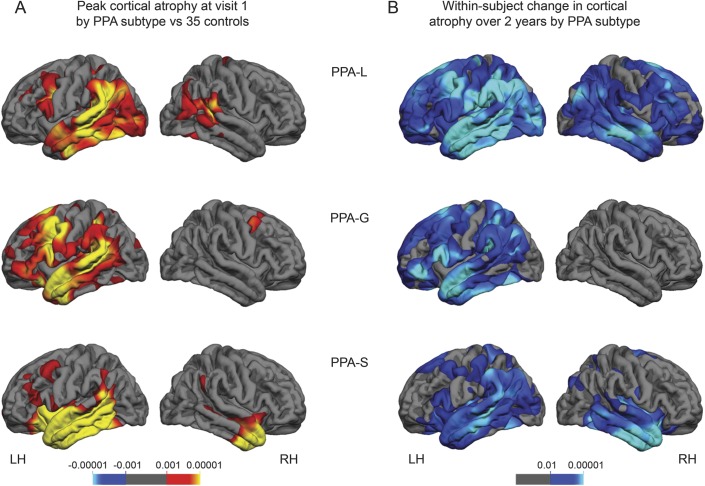
To identify regions of peak atrophy at V1 for each PPA subtype, vertex-wise thickness analyses across the entire cerebral cortex were used to compare each PPA subtype with the cognitively healthy controls. At V1, each PPA subtype showed asymmetrically greater atrophy in the left hemisphere (LH) (figure 1A, video on the Neurology® Web site at Neurology.org), consistent with previous reports.3 Compared with controls, peak atrophy in the PPA-L group included the temporoparietal junction, as well as the superior middle and inferior temporal gyri of the LH with relative sparing of the anterior aspects of the temporal pole. LH atrophy was also present in the posterior portion of the inferior frontal gyrus (IFG) and the caudal middle frontal gyrus. The peak atrophy for the right hemisphere (RH) of the PPA-L group was minimal and included the posterior superior temporal gyrus, supramarginal gyrus, and inferior parietal regions. The PPA-G group showed atrophy throughout the perisylvian cortex compared with controls, including peak atrophy in IFG, caudal middle frontal gyrus, and in the temporal lobe involving the entire superior and middle temporal gyrus and the anterior portion of the inferior temporal gyrus. The RH for the PPA-G group was relatively spared. Compared with controls, the PPA-S group showed atrophy largely confined to the temporal lobe including the superior, middle, and inferior temporal gyri and the fusiform gyrus. The peak atrophy in the RH was most severe in the most anterior third of the temporal lobe.
Figure 1. Atrophy patterns by PPA subtype.
False discovery rate was set at 0.05 for each comparison. (A) Significant cortical thinning patterns for each PPA subtype at baseline compared with controls (red/yellow shading). (B) Significant within-subject cortical thinning patterns over 2 years for each PPA subtype (blue/green shading). The p values are provided above each color bar. LH = left hemisphere; PPA = primary progressive aphasia; PPA-G = PPA-agrammatic; PPA-L = PPA-logopenic; PPA-S = PPA-semantic; RH = right hemisphere.
Within-group, vertex-wise paired t tests were used to identify atrophy progression patterns from V1 to V2 for each PPA subtype (figure 1B, video). The distribution of the change in atrophy was greater in the LH than the RH for each subtype over the course of 2 years; however, each subtype showed a distinct pattern of atrophy. The within-group change for the PPA-L group was widespread encompassing nearly the entire cerebral cortex. The LH temporal lobe and temporoparietal junction regions showed more severe change than the IFG. Atrophy in the RH was greatest in the homologs of the LH perisylvian regions but also extended beyond these cortical regions. Significant vertex-wise change in atrophy within the PPA-G group was restricted to the LH and included the perisylvian cortex, anterior temporal regions, as well as frontal and parietal atrophy. The peak within-group change in atrophy for the PPA-S group was the most circumscribed of the 3 subtypes and included peak bilateral temporal atrophy, although the LH atrophy extended more posteriorly than the RH atrophy and included the temporoparietal region.
Volume-based ROI analyses.
General ROI volume characteristics at each visit by subtype.
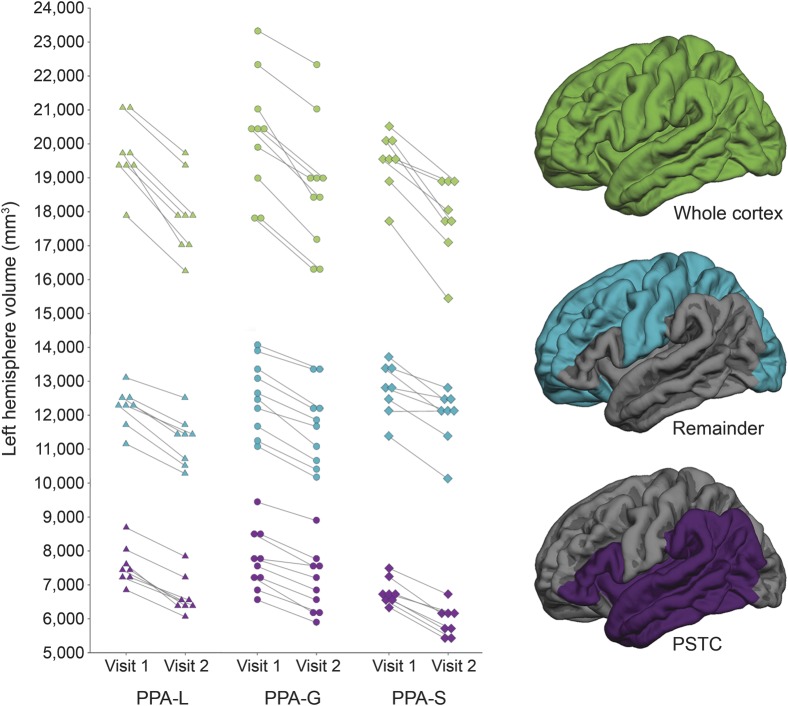
LH ROI volumes for each participant are provided in figure 2. On average, the LH PSTC volume was smallest in the PPA-S group and reached significance in post hoc comparisons with the PPA-L and PPA-G groups at both V1 and V2 (p ≤ 0.011, for each comparison; table e-1 on the Neurology® Web site at Neurology.org). There was no significant difference among the PPA subtypes' RH PSTC volume at baseline or follow-up. Likewise, there were no significant differences among the subtypes for the cortex ROI volumes at V1 or V2 in either hemisphere. There were no significant differences among the subtypes for the remainder ROI volumes at V1 in either hemisphere. At V2, the only significant difference was in the RH remainder ROI volume, which was larger in the PPA-S group than the PPA-L group (p = 0.013).
Figure 2. Individual left hemisphere ROI volumes by visit.
PPA-G = primary progressive aphasia–agrammatic; PPA-L = primary progressive aphasia–logopenic; PPA-S = primary progressive aphasia–semantic; PSTC = perisylvian temporal cortex; ROI = region of interest.
As expected, there was decline in volume for each ROI and for each subtype from V1 to V2 for both the LH and RH (p ≤ 0.0013, for each comparison; table e-1). LH volume of each ROI at each visit by participant is provided in figure 2.
Characterization of the progression of atrophy over time.
Percent change in ROI volume was examined for each hemisphere and subtype to determine whether progression was (1) asymmetric, (2) greater within or outside of the language network, and (3) had different rates among subtypes.
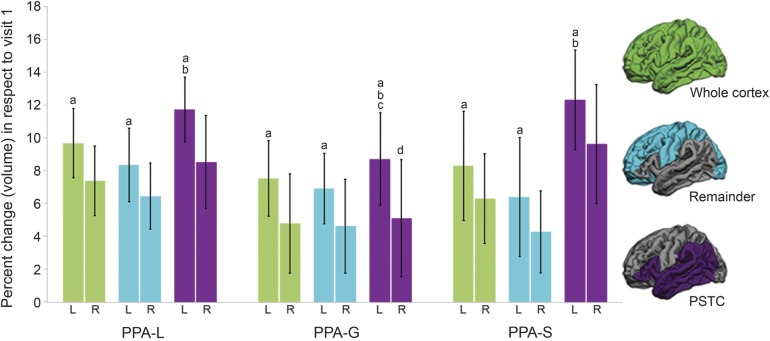
Paired t tests revealed that within each subtype and for each ROI, the percent change in volume was greater in the LH than the RH (p ≤ 0.009, for each comparison; figure 3), which is consistent with the vertex-wise cortical thinning patterns observed in figure 1.
Figure 3. Percent change of cortical volume loss over 2 years by hemisphere and PPA subtype.
a Within each subtype and for each ROI the rate of change was significantly greater in the left hemisphere than in the right hemisphere. b Percent change was significantly higher in the PSTC than the remainder ROI for the left hemisphere for each subtype. c The left hemisphere PSTC ROI of the PPA-G group showed a significantly smaller percent change in volume than PPA-L and PPA-S groups. d The right hemisphere PSTC ROI of the PPA-G group showed a significantly smaller percent change in volume than the PPA-S group. Bars represent SDs. L = left hemisphere; PPA = primary progressive aphasia; PPA-G = PPA-agrammatic; PPA-L = PPA-logopenic; PPA-S = PPA-semantic; PSTC = perisylvian temporal cortex; R = right hemisphere; ROI = region of interest.
To determine whether the greatest declines were occurring within or outside of the LH language network, percent change in volume of the LH PSTC and remainder regions was compared (figure 3). The percent change was greater in the LH PSTC than the remainder ROI for each subtype (p ≤ 0.013, for each comparison).
ANOVAs determined whether the percent change in volume of each ROI differed by subtype (figure 3). There was a main effect of the percent change in volume of the PSTC ROI for each hemisphere among the subtypes (p ≤ 0.021, for each comparison). Post hoc analyses showed that the PSTC ROI of the PPA-G group had a smaller percent change in volume than the LH of the PPA-L group (p = 0.014) and both the LH and RH of the PPA-S group (LH: p = 0.017; RH: p = 0.014). There was no significant main effect when the percent change in volume of either the cortex or remainder ROI was compared among the subtypes for both the LH and RH.
Sample size considerations.
Sample size calculations for small (25%) and medium (40%) effect sizes were based on the percent change in volume from the LH cortex and PSTC ROI for the PPA group and by subtype. Sample sizes were estimated both with and without a 35% inflation rate for attrition.5 When the cortex was the outcome measure, 25 subjects with PPA were required for a small effect size and 10 for a medium effect size. When considering a 35% attrition rate, the required sample sizes increased to 34 and 14, respectively. Fewer subjects were required when the PSTC was the outcome measure: small effect size, 21 subjects with PPA; medium effect size, 8. When considering a 35% attrition rate, the required sample sizes increased to 29 and 11, respectively. Sample sizes were also estimated by subtype for each ROI (cortex —PPA-L: 12 small, 5 medium; PPA-G: 24 small, 10 medium; PPA-S: 20 small, 16 medium; PSTC—PPA-L: 8 small, 3 medium; PPA-G: 27 small, 11 medium; PPA-S: 16 small, 6 medium).
Neuropsychological performance.
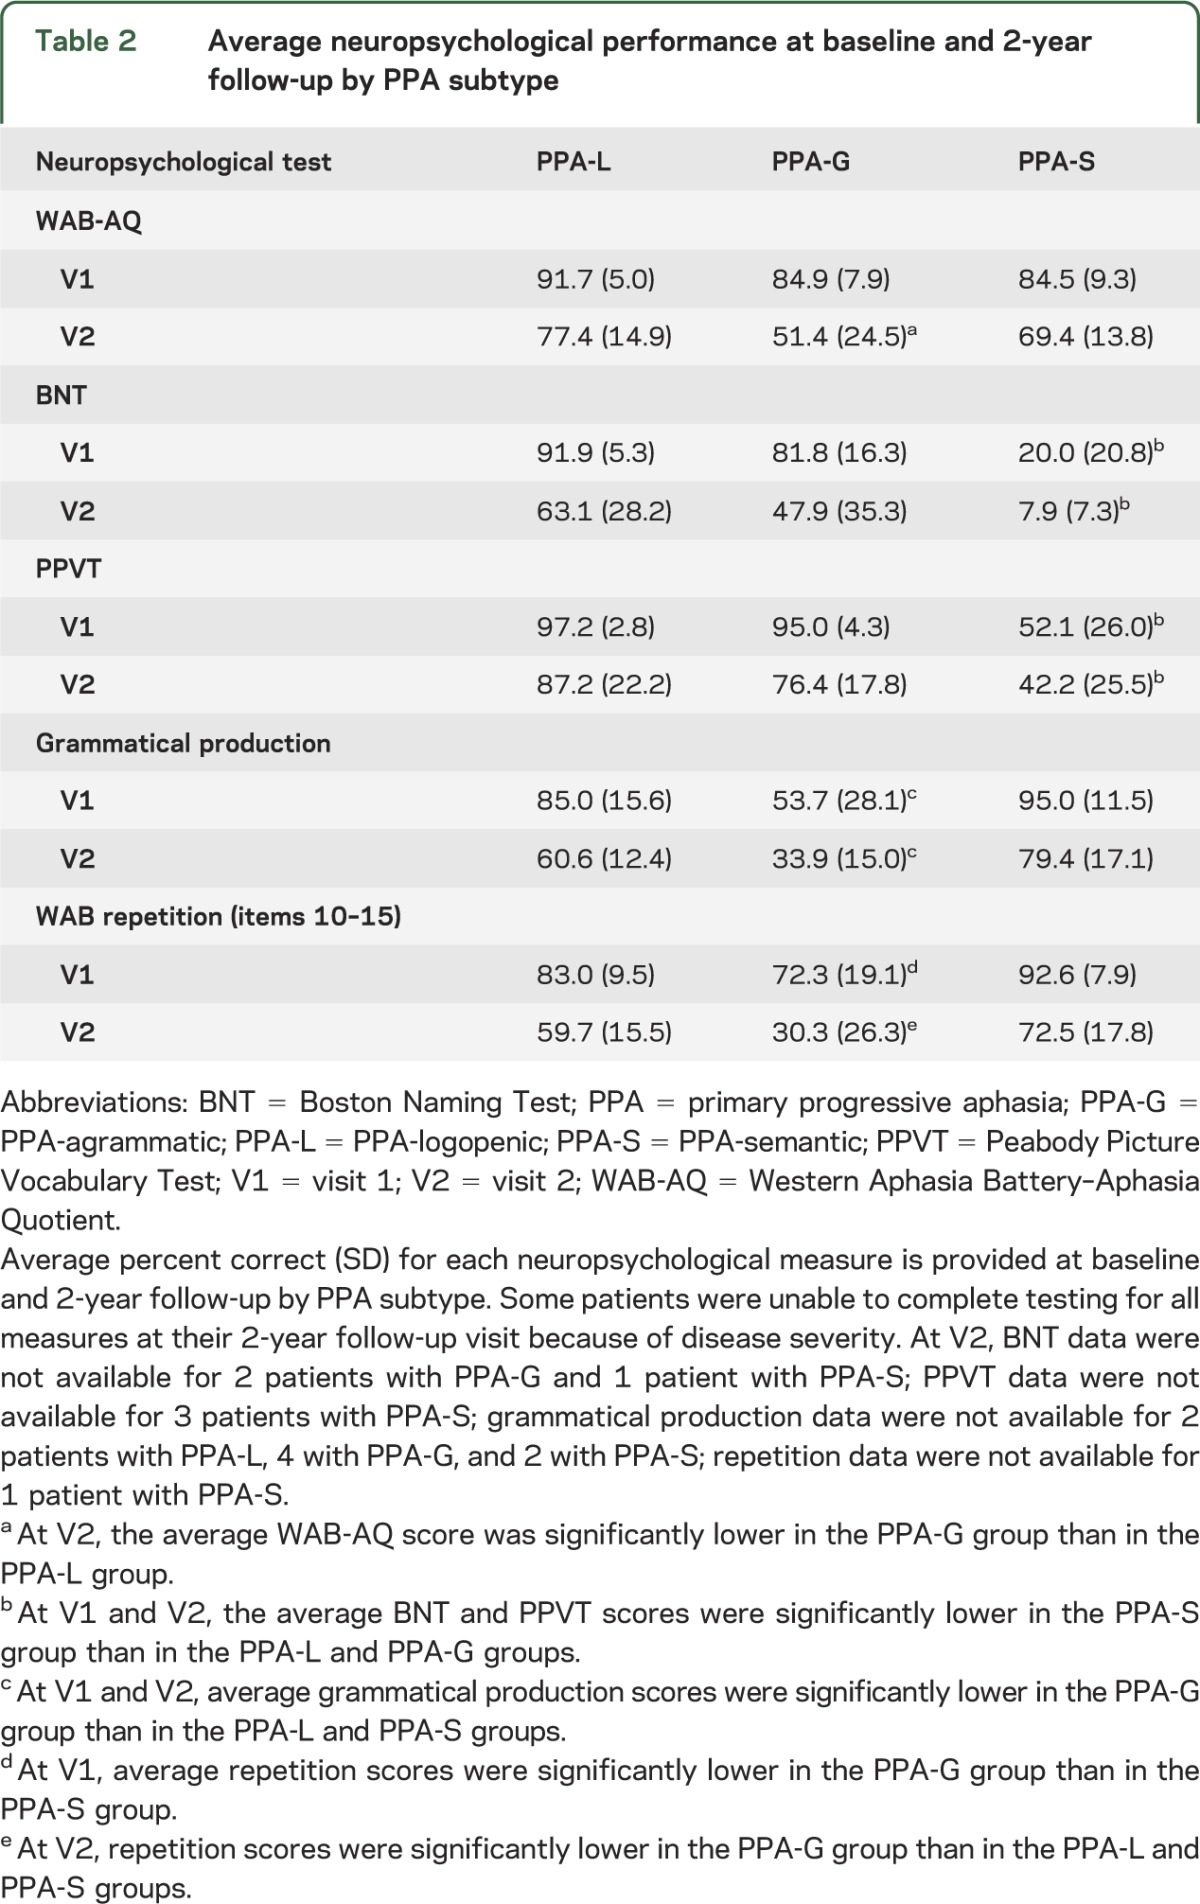
Average scores for language tests and severity are provided in table 2. Decline in scores was evident for all subjects, although there was variability at the individual level by test (figure e-1). ANOVAs were used to identify differences in performance by PPA subtype. Our measure of aphasia severity, the WAB-AQ, showed no differences at V1 among the subtypes, but at V2, the average WAB-AQ score was lower in the PPA-G than in the PPA-L group (p = 0.009). The average Boston Naming Test and Peabody Picture Vocabulary Test scores were lower in the PPA-S group than in the PPA-L and PPA-G groups at V1 and remained lower at V2 (p ≤ 0.010, for each comparison). The average grammar production scores were lower in the PPA-G group than in the PPA-L and PPA-S groups at V1 and V2 (p ≤ 0.007, for each comparison). The average repetition scores were lower in the PPA-G group than in the PPA-S group at V1, and at V2, the PPA-G group had lower scores than the PPA-L and PPA-S groups, which is consistent with previous findings.8
Table 2.
Average neuropsychological performance at baseline and 2-year follow-up by PPA subtype
Given the relatively small number of subjects per subtype, statistical analyses were not performed to directly assess the relationship between atrophy and clinical decline within the PPA group or by subtype. This will be an important future direction.
DISCUSSION
Quantitative atrophy measurements of 26 patients with PPA found significant deterioration within the language network for each of the 3 PPA subtypes over the course of 2 years. A primary finding was the presence of asymmetric progression of atrophy in the LH for each PPA subtype over the 2-year interval (figures 1 and 3), underscoring the neuroanatomical selectivity of neurodegenerative disease over time. The PPA-G group showed the greatest anatomical selectivity of progression. In fact, loss of cortical volume in the contralateral (right) hemisphere of this group during the 2-year interval was only detectable using an ROI approach. In the LH, incremental atrophy as a percentage of baseline over 2 years was greatest within, rather than outside of, the perisylvian cortex and surrounding temporal regions for all 3 subtypes (figure 3), which suggests that preferential neurodegeneration of the LH language network is a common denominator for all 3 subtypes, even as the disease progresses.
During the 2-year interval, a decline in all language scores was evident; however, the subtype-specific impairment of word comprehension in the PPA-S group vs grammatical processing in the PPA-G group was largely maintained. Individual performance patterns on neuropsychological tests were variable (figure e-1), making it challenging to provide clinical expectations at the individual level.
There have been few studies of progressive neuroanatomical change in PPA,5,9,22–27 which have mainly focused on large-scale measurements of whole-brain volume, ventricular volume, cortical volume, or regional patterns of atrophy. The present study provides greater specificity by examining vertex-wise cortical patterns of atrophy over time as well as focal estimates of change within the PSTC region that encompass most of the key language network components. The vertex-wise analyses provide unbiased visual representations of the anatomical patterns of change across the cortex, which adds to the understanding of the natural progression of the disease by subtype. The ROI analyses provide robust quantitative metrics for comparing progression among subtypes, which can be compared across studies. Investigators can select the method that is most suited to the purpose of a given study.
Power analyses from this study suggest that the cortex and PSTC ROI may provide more sensitive outcome measures than previously reported whole-brain and ventricular volume measures.5 Thus, cortical ROI measures (especially the PSTC) may be useful for future clinical trials in PPA because they allow for smaller samples sizes to detect a significant effect.
There does not appear to be a simple relationship between initial volume and percent change over time. The PPA-S group had the smallest LH PSTC volume at baseline (table e-1); therefore, one might predict that they would also show a slower rate of progression over time, because they have less brain mass to lose. The data from this study did not support this hypothesis; instead, the percent change in volume of the LH PSTC region was larger in the PPA-S group compared with the PPA-G group (figure 3).
The findings from this study are consistent with prior longitudinal reports of atrophy4,24 and neuropathologic findings in patients with PPA,28,29 showing that peak atrophy, neuronal loss, and disease-specific proteinopathy primarily occur in the language-dominant (usually left) hemisphere. The reason(s) for this LH vulnerability in PPA is unclear and remains one of the most important questions in the field.
Supplementary Material
ACKNOWLEDGMENT
The authors thank Dr. Mokhtar Gado, Washington University School of Medicine, an expert neuroanatomist, who provided guidance in the delineation of the PSTC ROI as well as Amanda Rezutek, Kristen Whitney, and Joseph Boyle for neuropsychological test administration of the participants. Imaging was performed at the Northwestern University Department of Radiology Center for Translational Imaging.
GLOSSARY
- ANOVA
analysis of variance
- eTIV
estimated total intracranial volume
- IFG
inferior frontal gyrus
- LH
left hemisphere
- PPA
primary progressive aphasia
- PPA-G
primary progressive aphasia–agrammatic
- PPA-L
primary progressive aphasia–logopenic
- PPA-S
primary progressive aphasia–semantic
- PSTC
perisylvian temporal cortex
- RH
right hemisphere
- ROI
region of interest
- V1
visit 1
- V2
visit 2
- WAB-AQ
Western Aphasia Battery–Aphasia Quotient
Footnotes
Supplemental data at Neurology.org
AUTHOR CONTRIBUTIONS
Dr. Rogalski contributed to drafting/revising the manuscript for content, including medical writing for content, study concept or design, analysis or interpretation of data, obtaining funding, and statistical analysis. She has access to all the data and takes responsibility for the data, accuracy of the data analysis, and the conduct of the research. She has the right to publish any and all data, separate and apart from the guidance of any sponsor of the research. Dr. Cobia contributed to drafting/revising the manuscript for content, including medical writing for content, study concept or design, and analysis or interpretation of data. Mr. Martersteck contributed to analysis or interpretation of data. Dr. Rademaker contributed to analysis or interpretation of data and statistical analysis. Ms. Wieneke contributed to drafting/revising the manuscript for content, acquisition of the data, and study supervision and coordination. Dr. Weintraub contributed to drafting/revising the manuscript for content and obtaining funding. Dr. Mesulam contributed to drafting/revising the manuscript for content, including medical writing for content, study concept or design, analysis or interpretation of data, and obtaining funding.
STUDY FUNDING
Supported by DC008552 from the National Institute on Deafness and Other Communication Disorders; AG13854 (Alzheimer Disease Core Center) from the National Institute on Aging; and NS075075 from the National Institute of Neurological Disorders and Stroke. This is not an industry-sponsored study.
DISCLOSURE
The authors report no disclosures relevant to the manuscript. Go to Neurology.org for full disclosures.
REFERENCES
- 1.Mesulam MM. Primary progressive aphasia: a language-based dementia. N Engl J Med 2003;349:1535–1542 [DOI] [PubMed] [Google Scholar]
- 2.Gorno-Tempini ML, Dronkers NF, Rankin KP, et al. Cognition and anatomy in three variants of primary progressive aphasia. Ann Neurol 2004;55:335–346 [DOI] [PMC free article] [PubMed] [Google Scholar]
- 3.Mesulam M, Wieneke C, Rogalski E, Cobia D, Thompson C, Weintraub S. Quantitative template for subtyping primary progressive aphasia. Arch Neurol 2009;66:1545–1551 [DOI] [PMC free article] [PubMed] [Google Scholar]
- 4.Rogalski E, Cobia D, Harrison TM, Wieneke C, Weintraub S, Mesulam MM. Progression of language decline and cortical atrophy in subtypes of primary progressive aphasia. Neurology 2011;76:1804–1810 [DOI] [PMC free article] [PubMed] [Google Scholar]
- 5.Knopman DS, Jack CR, Jr, Kramer JH, et al. Brain and ventricular volumetric changes in frontotemporal lobar degeneration over 1 year. Neurology 2009;72:1843–1849 [DOI] [PMC free article] [PubMed] [Google Scholar]
- 6.Mesulam M, Weintraub S. Primary progressive aphasia and kindred disorders. Handb Clin Neurol 2008;89:573–587 [DOI] [PubMed] [Google Scholar]
- 7.Gorno-Tempini ML, Hillis AE, Weintraub S, et al. Classification of primary progressive aphasia and its variants. Neurology 2011;76:1006–1014 [DOI] [PMC free article] [PubMed] [Google Scholar]
- 8.Mesulam MM, Wieneke C, Thompson C, Rogalski E, Weintraub S. Quantitative classification of primary progressive aphasia at early and mild impairment stages. Brain 2012;135:1537–1553 [DOI] [PMC free article] [PubMed] [Google Scholar]
- 9.Kertesz A. Western Aphasia Battery. San Antonio: The Psychological Corporation; 1982 [Google Scholar]
- 10.Weintraub S, Mesulam MM, Wieneke C, Rademaker A, Rogalski EJ, Thompson CK. The Northwestern Anagram Test: measuring sentence production in primary progressive aphasia. Am J Alzheimers Dis Other Demen 2009;24:408–416 [DOI] [PMC free article] [PubMed] [Google Scholar]
- 11.Dunn L, Dunn D. Peabody Picture Vocabulary Test. Toronto: Pearson Canada Assessment Inc.; 2006 [Google Scholar]
- 12.Dale AM, Fischl B, Sereno MI. Cortical surface-based analysis: I: segmentation and surface reconstruction. Neuroimage 1999;9:179–194 [DOI] [PubMed] [Google Scholar]
- 13.Reuter M, Schmansky NJ, Rosas HD, Fischl B. Within-subject template estimation for unbiased longitudinal image analysis. Neuroimage 2012;61:1402–1418 [DOI] [PMC free article] [PubMed] [Google Scholar]
- 14.Segonne F, Pacheco J, Fischl B. Geometrically accurate topology-correction of cortical surfaces using nonseparating loops. IEEE Trans Med Imaging 2007;26:518–529 [DOI] [PubMed] [Google Scholar]
- 15.Desikan RS, Segonne F, Fischl B, et al. An automated labeling system for subdividing the human cerebral cortex on MRI scans into gyral based regions of interest. Neuroimage 2006;31:968–980 [DOI] [PubMed] [Google Scholar]
- 16.Duvernoy H. The Human Brain: Surface, Three-Dimensional Anatomy and MRI. New York: Springer-Verlag; 1991 [Google Scholar]
- 17.Naidich TP, Hof PR, Gannon PJ, Yousry TA, Yousry I. Anatomic substrates of language: emphasizing speech. Neuroimaging Clin N Am 2001;11:305–341, ix [PubMed] [Google Scholar]
- 18.Cobia D, Rogalski E, Ming J, Wang L, Mesulam MM. Cortical estimates of the perisylvian and temporal language network in primary progressive aphasia subtypes. In: Dementia and Geriatric Cognitive Disorders: 7th International Conference on Frototemporal Dementias. Indianapolis, IN: Basel: Karger; 2010:88 [Google Scholar]
- 19.Ratnanather JT, Barta PE, Honeycutt NA, et al. Dynamic programming generation of boundaries of local coordinatized submanifolds in the neocortex: application to the planum temporale. Neuroimage 2003;20:359–377 [DOI] [PubMed] [Google Scholar]
- 20.Buckner RL, Head D, Parker J, et al. A unified approach for morphometric and functional data analysis in young, old, and demented adults using automated atlas-based head size normalization: reliability and validation against manual measurement of total intracranial volume. Neuroimage 2004;23:724–738 [DOI] [PubMed] [Google Scholar]
- 21.Genovese CR, Lazar NA, Nichols T. Thresholding of statistical maps in functional neuroimaging using the false discovery rate. Neuroimage 2002;15:870–878 [DOI] [PubMed] [Google Scholar]
- 22.Avants B, Anderson C, Grossman M, Gee JC. Spatiotemporal normalization for longitudinal analysis of gray matter atrophy in frontotemporal dementia. Med Image Comput Comput Assist Interv 2007;10:303–310 [DOI] [PubMed] [Google Scholar]
- 23.Brambati SM, Rankin KP, Narvid J, et al. Atrophy progression in semantic dementia with asymmetric temporal involvement: a tensor-based morphometry study. Neurobiol Aging 2009;30:103–111 [DOI] [PMC free article] [PubMed] [Google Scholar]
- 24.Rohrer JD, Caso F, Mahoney C, et al. Patterns of longitudinal brain atrophy in the logopenic variant of primary progressive aphasia. Brain Lang 2013;127:121–126 [DOI] [PMC free article] [PubMed] [Google Scholar]
- 25.Rohrer JD, Clarkson MJ, Kittus R, et al. Rates of hemispheric and lobar atrophy in the language variants of frontotemporal lobar degeneration. J Alzheimers Dis 2012;30:407–411 [DOI] [PMC free article] [PubMed] [Google Scholar]
- 26.Whitwell JL, Anderson VM, Scahill RI, Rossor MN, Fox NC. Longitudinal patterns of regional change on volumetric MRI in frontotemporal lobar degeneration. Dement Geriatr Cogn Disord 2004;17:307–310 [DOI] [PubMed] [Google Scholar]
- 27.Rohrer JD, McNaught E, Foster J, et al. Tracking progression in frontotemporal lobar degeneration: serial MRI in semantic dementia. Neurology 2008;71:1445–1451 [DOI] [PubMed] [Google Scholar]
- 28.Gefen T, Gasho K, Rademaker A, et al. Clinically concordant variations of Alzheimer pathology in aphasic versus amnestic dementia. Brain 2012;135:1554–1565 [DOI] [PMC free article] [PubMed] [Google Scholar]
- 29.Mesulam MM, Weintraub S, Rogalski E, Wieneke C, Geula C, Bigio E. Asymmetry and heterogeneity of Alzheimer's and frontotemporal pathology in primary progressive aphasia. Brain 2014;137:1176–1192 [DOI] [PMC free article] [PubMed] [Google Scholar]
Associated Data
This section collects any data citations, data availability statements, or supplementary materials included in this article.


