

Abstract
The rapid pharmacodynamic response of cells to toxic xenobiotics is primarily coordinated by signal transduction networks, which follow a simple framework: the phosphorylation/dephosphorylation cycle mediated by kinases and phosphatases. However, the time course from initial pharmacodynamic response(s) to cell death following exposure can have a vast range. Viewing this time lag between early signaling events and the ultimate cellular response as an opportunity, we hypothesize that monitoring the phosphorylation of proteins related to cell death and survival pathways at key, early time points may be used to forecast a cell's eventual fate, provided that we can measure and accurately interpret the protein responses. In this paper, we focused on a three-phased approach to forecast cell death after exposure: (1) determine time points relevant to important signaling events (protein phosphorylation) by using estimations of adenosine triphosphate production to reflect the relationship between mitochondrial-driven energy metabolism and kinase response, (2) experimentally determine phosphorylation values for proteins related to cell death and/or survival pathways at these significant time points, and (3) use cluster analysis to predict the dose-response relationship between cellular exposure to a xenobiotic and plasma membrane degradation at 24 h post-exposure. To test this approach, we exposed HepG2 cells to two disparate treatments: a GSK-3β inhibitor and a MEK inhibitor. After using our three-phased approach, we were able to accurately forecast the 24 h HepG2 plasma membrane degradation dose-response from protein phosphorylation values as early as 20 min post-MEK inhibitor exposure and 40 min post-GSK-3β exposure.
Keywords: predictive toxicology, signal transduction, kinase, cytotoxicity, dose-response
In mammalian systems, the cellular response to toxic xenobiotics involves the complex, yet coordinated transmission of intracellular signaling molecules to determine a cell's eventual fate (i.e., survival or death) (Kumar et al., 2007; Schilling et al., 2009). The initial pharmacodynamic response to any xenobiotic exposure is predominantly coordinated by signal transduction networks, which can initiate response within the first few seconds to minutes of exposure. This response follows a simple framework: the phosphorylation and dephosphorylation cycle of proteins mediated by kinases and phosphatases (Kholodenko, 2006; Newman et al., 2013). However, the time course of cell death from exposure to visual morphological changes can have a vast range. For example, the time delay between xenobiotic exposure and execution of apoptosis can take from several hours to over a day (Lemasters et al., 1998; Messam and Pittman, 1998). Based upon the time delay between these early and late responses, we hypothesize that monitoring the phosphorylation of proteins related to cell death and survival pathways may be predictive of a cell's eventual fate, provided that we can read and correctly interpret the protein responses.
Considering the vast number of proteins involved in critical intracellular signaling processes, the number and type of proteins to be monitored for forecasting a cell's fate must be judiciously selected. An advantageous group of proteins to monitor for this approach are kinases involved in the regulation of signaling events relevant to cellular death and survival processes. Irrespective of the cell death modality, the cellular decision to survive or die relies on the integration of signals at mitochondrial membranes that contribute to mitochondrial membrane permeability (MMP) (Kroemer et al., 2007). By monitoring kinases upstream of MMP signaling proteins, a detailed snapshot of the cell's own interpretation of exposure can theoretically be determined, and this early signaling may foreshadow the cell's fate long before the final steps of cell death occur.
Appropriately capturing the time course of critical signaling events that will be predictive of cellular survival or death post-exposure is difficult. However, time points of significant deviation may be determined by exploiting the intricate inter-relationship between mitochondrial-driven energy metabolism and kinase response in real time. Most importantly, this can be accomplished without potentially disrupting intracellular activity. Kinase signaling is an energy demanding process, and its reliance on phosphorylation results in the consumption of substantial amounts of available adenosine triphosphate (ATP) (Hammerman et al., 2004). ATP production governs ATP-consuming processes, such as signal transduction in mammalian cells, and this production is primarily driven by oxidative phosphorylation within mitochondria (Ainscow and Brand, 1999; Buttgereit and Brand, 1995). Additionally, it is known that some types of cell death (e.g., apoptosis and autophagy) require appreciable amounts of energy due to their reliance on ATP-dependent processes (Eguchi et al., 1999; Kanzawa et al., 2004; Yamamoto et al., 1998), such as activation of caspase signaling cascades (Leist et al., 1997), chromatin condensation (Eguchi et al., 1997), and autophagic sequestration (Kondo et al., 2005). Therefore, by monitoring energy production processes in the cell in real time, key time points of significant deviation may indicate critical kinase signaling events relevant to, in this study, cell death post-exposure.
In this paper, we focused on a three-phased approach to forecast cell death in an in vitro system: (1) determine time points relevant to critical signaling events, (2) experimentally determine the phosphorylation of proteins related to cell death and/or survival at these significant time points, and (3) use cluster analysis to predict the 24 h plasma membrane degradation dose-response of cells to xenobiotic exposure. We chose the human hepatocellular carcinoma-derived HepG2 cell line as our model in vitro system because the liver is rich in mitochondria (Veltri et al., 1990) and this cell line is human-derived. Additionally, hepatocellular carcinoma incidence is on the rise in the United States with five-year survival rates of 10% (Altekruse et al., 2009). To test this approach, we chose xenobiotics that have activities at disparate intracellular targets in vitro. Specifically, we exposed HepG2 cells to various doses of 4-Benzyl-2-methyl-1,2,4-thiadiazolidine-3,5-dione (TDZD-8), a glycogen synthase kinase 3β (GSK-3β) substrate-competitive inhibitor (Martinez et al., 2002). As a therapeutic target, GSK3 has seen a recent surge in interest for its multifunctional role in a variety of signaling processes, as well as its implication in a number of diseases, such as diabetes, Alzheimer's, bipolar disorder, and cancer (Kim and Kimmel, 2000; Wang et al., 2006). We also exposed HepG2 cells to various doses of 2-Chloro-3-(N-succinimidyl)-1,4-naphthoquinone (MEK inh II), a MEK1 inhibitor (Bakare et al., 2003). MEK1 has been shown to be constitutively active in several carcinoma cell lines, such as hepatocellular carcinoma, contributing to cell survival (Ballif and Blenis, 2001; Mitsui et al., 2001). This makes the MEK1-MAPK signal transduction pathway an attractive target for chemotherapies (Huynh et al., 2003). By using our three-phased approach, we were able to accurately forecast the 24 h HepG2 plasma membrane degradation dose-response from protein phosphorylation values as early as 20 min post-MEK inh II exposure and 40 min post-TDZD-8 exposure. The implications of this proof of principle study may have a broad reaching impact: from the ability to forecast in vitro cytotoxicity of xenobiotic exposures to the identification of therapeutic windows for pharmacological treatments.
MATERIALS AND METHODS
Materials
4-Benzyl-2-methyl-1,2,4-thiadiazolidine-3,5-dione (TDZD-8, cas 327036–89–5), Dulbecco's modified Eagle's medium (DMEM), sodium pyruvate, D-glucose, L-glutamate, and sodium bicarbonate were obtained from Sigma Aldrich (St. Louis, MO). 2-Chloro-3-(N-succinimidyl)-1,4-naphthoquinone (MEK inh II, cas 623163–52–0) was purchased from CalBiochem (La Jolla, CA). HEPES was purchased from Fisher Scientific (USA). Fetal bovine serum, Ethidium homodimer-1 cytotoxicity kit, ATP determination kit (luciferase assay), and penicillin-streptomycin were obtained from Invitrogen (Carlsbad, CA). HyClone phosphate buffered saline (PBS) was purchased from Thermo Scientific (USA). Cell lines and MTT assay kits were obtained from American Type Culture Collection (Manassas, VA). MitoXpress oxygen probe was obtained from Luxcel Corporation (Cork, Ireland). Deionized water used in this study was prepared with the Milli-Q Water System (Millipore, Bedford, MA).
Cell culture
Human hepatocellular carcinoma-derived HepG2 cells were cultured in DMEM, supplemented with 2 g/L D-glucose, 2mM L-Glutamate, 5mM HEPES, 24mM sodium bicarbonate, 1mM sodium pyruvate, 10% fetal bovine serum, 100 U/ml penicillin, and 100 mg/ml streptomycin. Cells were maintained in a humidified atmosphere at 37°C, 5% CO2 and passaged at 80% confluence.
Dosing
For MTT, NADH, cellular ATP, and plasma membrane degradation assays, cells were seeded into clear-bottom, 96-well plates (black-sided for fluorescence assays) at a concentration of 4 × 10⁴ cells per well in DMEM without phenol red and allowed to grow for 24 h before dosing. For multiplex phosphoprotein assays, cells were seeded in 12-well plates at a concentration of 5 × 10⁵ cells per well in DMEM without phenol red and allowed to grow for 24 h before dosing. For oxygen consumption assays, cells were seeded into clear-bottom, black-sided 96-well plates at a concentration of 8 × 10⁴ cells per well in DMEM without phenol red and allowed to grow for 24 h before dosing. Medium was then aspirated from wells and cells were challenged with TDZD-8 or MEK inh II. TDZD-8 and MEK inh II were prepared so that resulting well concentrations would be < 1% DMSO.
MTT assay
After 24 h of exposure to TDZD-8 (10, 20, 30, 40, 50, or 100μM) or MEK inh II (1, 5, 10, 20, 50, or 100μM), cell viability was determined using the MTT (3-(4,5-dimethyl)-2,5-diphenyl tetrazolium bromide) assay, according to the manufacturer's protocol. This assay is based on the reduction of tetrazolium MTT to formazan by metabolically active cells, in part by the action of dehydrogenase enzymes, to generate reducing equivalents such as NADH and NADPH. Briefly, MTT reagent was added to the wells of the microplate, and after 4 h of incubation at 37°C, intracellular formazan crystals were solubilized with the provided detergent solution. Absorbance values were obtained using the Tecan InfiniteM1000 plate reader (Tecan US, Raleigh, NC) with a measurement wavelength of 570 nm and a reference wavelength of 700 nm, read from the bottom. Assay was performed in quadruplicate. Relative viability was calculated by subtracting the negative control (contained no cells) and normalizing to controls, which received dosing vehicle (< 1% DMSO).
Oxygen consumption assay
Immediately after dosing with TDZD-8 (10, 20, 30, 40, or 50μM) or MEK inh II (1, 5, 10, 20, or 50μM), cellular oxygen consumption was assessed using the MitoXpress probe, according to manufacturer's protocol. Briefly, oxygen-sensitive probe was diluted to a stock concentration of 1μM, and stock probe was diluted 1:15 in each well of a black walled 96-well plate containing cells (8 × 10⁴ cells/well); 100 μl of pre-warmed mineral oil was also added to each well to block ambient oxygen from the cells. After pre-warming the plates at 37°C for 1 h, cells were challenged with varying doses of TDZD-8 or MEK inh II. Immediately following addition of TDZD-8 or MEK inh II, oxygen consumption was determined by measuring fluorescence. Fluorescent signal was obtained using the Infinite M1000 microplate reader (Tecan US, Raleigh NC) with excitation wavelength of 380 nm and emission wavelength of 650 nm, reading from the bottom every 10 min for 24 h after dosing. Experiments were performed in quadruplicate. Relative oxygen consumption was calculated by normalizing to controls, which received dosing vehicle (< 1% DMSO).
NADH assay
Immediately after dosing with TDZD-8 (10, 20, 30, 40, or 50μM) or MEK inh II (1, 5, 10, 20, or 50μM), NADH generation was determined by measuring absorbance. The absorbance of NADH at wavelength 340 nm was measured every 10 min for 24 h. Experiments were performed in quadruplicate. Relative NADH generation was calculated by normalizing to controls, which received dosing vehicle (< 1% DMSO).
Cellular ATP assay
The boiling water method was used to extract cellular ATP from attached cells, as described previously (Yang et al., 2002). After 40 min, 10 h, or 24 h of exposure to TDZD-8 (10, 20, 30, 40, or 50μM), medium was aspirated and cells were washed twice with PBS. In the same manner, after 20 min, 8 h 20 min, or 24 h of exposure to MEK inh II (1, 5, 10, 20, or 50μM), medium was aspirated and cells were washed twice with PBS. Cells were suspended in 100 μl/well boiling deionized water with repeated pipetting. The cell suspension was transferred to a microcentrifuge tube and centrifuged 12,000 g for 5 min at 4°C. Following centrifugation, 10 μl of supernatant was used for the ATP luciferase assay, which was performed according to the manufacturer's protocol. Bioluminescence was measured using the Infinite M1000 microplate reader (Tecan US, Raleigh NC). Experiments were performed in quadruplicate. Relative cellular ATP was determined by normalizing to positive control, which received dosing vehicle (< 1% DMSO).
Multiplex phosphoprotein assay
After 40 min or 10 h of exposure to TDZD-8 (10, 20, 30, 40, 50, or 100μM), cells were washed with ice cold PBS and lysed according to manufacturer's protocol. In the same manner, after 20 min or 8 h 20 min of exposure to MEK inh II (1, 5, 10, 20, 50, or 100μM), cells were washed with ice cold PBS and lysed according to manufacturer's protocol. Total protein concentration was determined using the DC Protein Assay (BioRad, Hercules, CA) according to the manufacturer's instructions. Protein phosphorylation was determined by using the bead-based BioPlex suspension array system (Bio-Rad, Hercules, CA) and lysates were prepared according to the manufacturer's protocol. Beads and detection antibodies against phosphorylated AKT (Ser473), ERK1/2(Thr202/Tyr204, Thr185/Tyr187), GSK-3α/β (Ser21/Ser9), HSP27 (Ser78), IκBα (Ser32/Ser36), JNK1/2 (Thr 183/Tyr185), MEK1 (Ser217/Ser221), p38MAPK (Thr180/Tyr182), p53 (Ser15), and p90RSK (Thr359/Ser363) were obtained from Bio-Rad (Hercules, CA). Beads and detection antibodies against phosphorylated BAD (Ser 112), CREB1 (Ser133), IGFR (Tyr1131), IRS1 (Ser636/Ser639), EGFR (Tyr), MSK1(Ser212), p70S6K (Thr421/Ser424), AKT(Thr308), and p53(Ser46) were obtained from EMD Millipore. Relative phosphorylation was calculated by normalizing to control, which received dosing vehicle (< 1% DMSO). TDZD-8 exposed phosphoprotein experiments were performed in triplicate and MEK inh II exposed phosphoprotein experiments were performed in duplicate.
Plasma membrane degradation assay
To determine plasma membrane degradation of HepG2 cells exposed to TDZD-8 or MEK inh II, the ethidium homodimer-1 (EthD-1) kinetic assay was used. Twenty-four hours after seeding HepG2 cells (4 × 10⁴) in a black-sided clear-bottom 96 well plate, culture medium was removed and replaced with probe-containing culture medium (2μM EthD-1). Dead control wells were exposed to 70% methanol and the plate was incubated for 30 min. Following the 30 min incubation, cells were challenged with TDZD-8 (10, 20, 30, 40, 50, or 100μM) or MEK inh II (1, 5, 10, 20, 50, or 100μM) and read immediately after dosing. Fluorescent signal was obtained using the Infinite M1000 microplate reader (Tecan US, Raleigh NC) with excitation wavelength of 530 nm and emission wavelength of 645 nm, reading from the bottom every 10 min for 24 h after dosing. Experiments were performed in sextuplicate. Relative plasma membrane degradation was determined by normalizing to dead control (received 70% methanol).
Statistical analysis
Dose-response curves for MTT assays were generated by best-fit Hill-plot regression with varying slope of scatter plot data using Prism V5 (Graphpad Software, San Diego, CA). Selection of time points related to critical signaling events (40 min and 10 h for TDZD-8; 20 min and 8 h 20 min for MEK inh II) was determined by estimating temporal bifurcation points from theoretical ATP generation and activity using SAS JMP V12Pro (Cary, NC). Correlation analysis for theoretical ATP generation and relative cellular ATP was determined using SAS JMP V12Pro (Cary, NC). Two-way hierarchical cluster analyses with Ward's minimum variance were determined by using SAS JMP V12Pro (Cary, NC). Statistical significance for plasma membrane degradation (observed and forecasted) was determined by using a two-way analysis of variance (ANOVA) with Bonferroni post-test. A difference of p < 0.05 was considered statistically significant. For viability, plasma membrane degradation (observed and predicted), cellular ATP, and relative phosphorylation data, error bars reflect standard error of the mean (S.E.M.).
Signaling pathway analysis
Functional pathway and network analyses were generated with Ingenuity Pathway Analysis (IPA) software (Ingenuity Systems) as described elsewhere (Madoz-Gurpide et al., 2007). IPA identified pathways from the IPA Library of Canonical Pathways that were significant to our phosphorylation data. The 19 proteins used in this paper were considered for analysis. For this study, significance between our protein phosphorylation data set (TDZD-8 and MEK inh II) and the molecular and cellular function p-score, along with associated network functions, was measured by the Fisher's exact test. The Fisher's exact test calculates a p-value to determine the probability that the relationship between the phosphorylated proteins in our data set and a canonical pathway, biological function or disease could be related by chance alone. We reported the top three biological functions associated with our datasets.
RESULTS
HepG2 Viability in Response to TDZD-8 and MEK Inh II
For this proof-of-principle study, we first determined the appropriate dosing range for TDZD-8, a GSK-3β substrate-competitive inhibitor (IC50 = 2μM) (Martinez et al., 2002), and MEK inh II, a MEK1 inhibitor (IC50 = 0.38μM) (Bakare et al., 2003). Previously, MEK inh II has also been shown to inhibit other intracellular targets, such as ERK1 (IC50 = 82.9μM) and Raf1 (IC50 = 34.5μM) (Bakare et al., 2003). To accomplish this, we measured HepG2 viability via MTT assay in response to varying doses of TDZD-8 and MEK inh II at 24 h post-exposure (Figs. 1a,b). From HepG2 viability, the best-fit Hill-plot regression with varying slope was used to determine the EC50 of TDZD-8 (19 ± 1μM) and MEK inh II (9 ± 1μM).
FIG. 1.
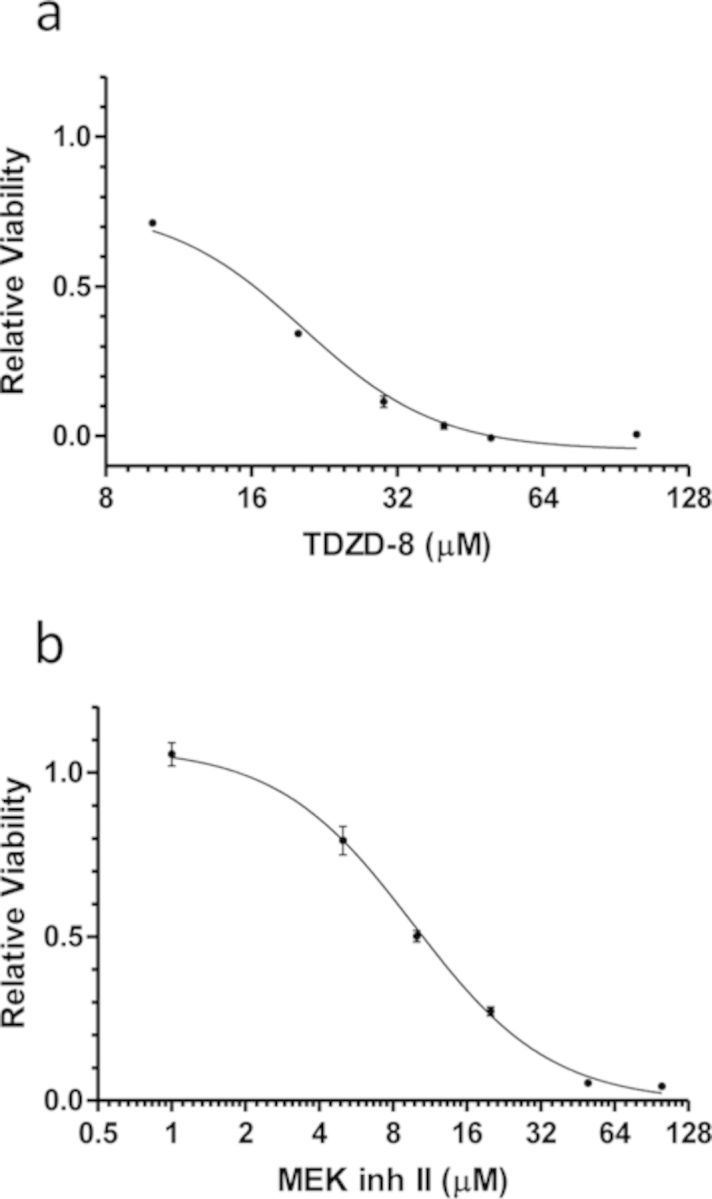
HepG2 viability to determine relevant TDZD-8 and MEK inh II doses. HepG2 viability dose-response curves for (a) TDZD-8 and (b) MEK inh II. Viability was measured by MTT assay and is shown as relative viability. Relative viability was calculated relative to control cells, which received dosing vehicle (< 1% DMSO), but no inhibitor. Dose-response curves were generated using the best-fit Hill-plot regression with varying slope. The x-axis is shown as log2 to better visualize TDZD-8 and MEK inh II dosing range. Error bars reflect ± S.E.M.
Estimation of ATP Generation to Determine Critical Signaling Events
Monitoring relative ATP generation in response to chemical insult without potentially disrupting sensitive intracellular activity is imperative. To this end, we have developed an extracellular approach to determine kinase signaling events on a temporal scale by estimating ATP production with data collected from real-time oxygen consumption and NADH production assays. These data sets allow for stoichiometric determinations of ATP production in real time. Theoretically, mitochondrial oxidative phosphorylation is responsible for producing a substantial portion of cellular ATP, and traditionally, NADH and oxygen are related to ATP production as shown below (Kadenbach, 1986; Nelson and Cox, 2008):
 |
(1) |
Because our assay monitors oxygen consumption, the equation can be doubled:
 |
(2) |
Additionally, cells can produce ATP via glycolysis, where 1 ATP is generated for each available NADH. This may be particularly true for HepG2 cells, because many cancer cells have been shown to have a high reliance on glycolysis due to the Warburg effect (Vander Heiden et al., 2009; Warburg, 1956). To account for ATP production when there is limited or no oxygen, an “if then else loop” was used to calculate theoretical ATP generation:
 |
To account for variations in ATP generation over time, we calculated the relative ATP generation activity (Equation 3), which we believe more accurately captures temporal bifurcations relevant to critical signaling events. This equation is the average of the integrated NADH and O2 consumption assays over time divided by their total NADH produced and O2 consumed. We also subtracted the positive control and then added a value of 1 to make generation activity curves relative to control, where a value of 1 on the generation activity graph is the same as control.
 |
(3) |
Bifurcation points relevant to critical signaling events are shown in Figure 2a for TDZD-8 (40 min and 10 h) and Figure 2b for MEK inh II (20 min and 8 h 20 min). Bifurcations were selected by relying on the relative ATP generation activity curves, then relating ATP generation activity curve changes to simultaneous changes in theoretical ATP generation. The first bifurcation is the point before a sustained increase/decrease in ATP generation activity that is simultaneously related to a change in theoretical ATP generation curves for three or more doses. The second bifurcation is selected just after there is a rapid decrease/increase in ATP generation activity that is simultaneously related to a change in theoretical ATP generation curves for three or more doses. To validate our ATP estimation method, we determined cellular ATP at the time points of interest for each compound using the luciferase assay (Figs. 2c,d). Relative cellular ATP from the luciferase assay was found to be significantly correlated to our theoretical ATP generation model for TDZD-8 (r = 0.59, p = 0.021) (Fig. 2a, third graph) and MEK inh II (r = 0.85, p < 0.001) (Fig. 2b, third graph).
FIG. 2.

Theoretical ATP generation and activity models indicate key bifurcation points for HepG2 cells exposed to TDZD-8 and MEK inh II. (a) Using the NADH/NADPH absorbance at 340 nm, NADH generation was measured every 10 min for 24 h following administration of 10, 20, 30, 40, and 50μM doses of TDZD-8 to HepG2 cells. Data are reported as relative NADH generation, which was normalized to controls that received vehicle control (< 1% DMSO). Oxygen consumption of HepG2 cells exposed to TDZD-8 was monitored every 10 min for 24 h with an oxygen sensitive probe (MitoXpress). An increase in probe signal indicates an increase in oxygen consumption relative to controls, which received dosing vehicle (< 1% DMSO). Theoretical ATP generation (third graph) was calculated using the “If then else loop,” as described in Results, which is based on the stoichiometric production of ATP from cellular respiration (oxidative phosphorylation). Relative ATP generation activity (fourth graph) was calculated from Equation 3. Critical signaling events were selected at 40 min and 10 h post-TDZD-8 exposure from our bifurcation analysis described in Results. (b) HepG2 cells exposed to 1, 5, 10, 20, and 50μM doses of MEK inh II were measured and analyzed in the same way as TDZD-8. Critical signaling events were selected at 20 min and 8 h 20 min post-MEK inh II exposure from our bifurcation analysis described in Results. To determine if the theoretical ATP generation model predicted relative cellular ATP levels, the luciferase assay was used to measure cellular ATP at the time points of interest. Extracted cellular ATP of HepG2 cells exposed to either (c) TDZD-8 or (d) MEK inh II were measured using the luciferase assay as described in Materials and Methods. Relative cellular ATP from the luciferase assay of TDZD-8 exposed cells (c) was found to be significantly correlated to our theoretical ATP generation (a, third graph) for TDZD-8 (r = 0.59, p = 0.021) at the time points of interest (40 min, 10 h, and 24 h). Relative cellular ATP from the luciferase assay of MEK inh II exposed cells (d) was found to be significantly correlated to the theoretical ATP generation for MEK inh II (b, third graph) for MEK inh II (r = 0.85, p < 0.001) at the time points of interest (20 min, 8 h 20 min, and 24 h). Results were reported as relative to controls, which received dosing vehicle (< 1% DMSO) and error bars reflect S.E.M.
Multiplex Assay to Determine Phosphorylation of Key Proteins
After time points of critical signaling events have been identified, a snapshot of the pharmacodynamic response to xenobiotic exposure can be determined with a high-throughput approach. Inclusion of valuable proteins that cast a wide net on cell death or survival pathways at these time points are necessary to capture intracellular processes that will determine the cell's eventual fate. In response to cellular stressors (e.g., xenobiotics, endogenous molecules), many kinase pathways converge upon mitochondria, which can result in MMP-mediated death (Kroemer et al., 2007; Rehm et al., 2009). From this, we chose to narrow the list of potential proteins to those that are only a few kinase steps removed from key survival or death proteins that are known to alter mitochondrial activity. Specifically, mitogen-activated protein kinases (MAPKs) have been the subject of intense research for many disease pathologies, especially cancer, due to their role in cell proliferation (Anjum and Blenis, 2008). The EGFR-Ras-Raf-MEK-ERK-RSK signaling network is involved in cellular proliferation, survival, differentiation, and motility (Roberts and Der, 2007); alterations in the normal function of these proteins have been implicated in cancer and other diseases (Sebolt-Leopold and Herrera, 2004). Dysregulated cAMP response element binding protein (CREB1) has also been implicated in uncontrolled growth and survival in several cancer cell lines, making it an excellent candidate for this approach (Shukla et al., 2009). JNK and p38 kinases are involved in the coordinated response to external stress stimuli, inflammation, and apoptosis (for review, see Pearson et al., 2001), making them viable candidates for this work. Another class of proteins relevant to cell survival and death pathways are heat shock proteins (HSP), specifically HSP27, which has been shown to act as a protective protein, binding to cytochrome c, preventing apoptosis (Bruey et al., 2000). Two proteins intimately involved in mediating stress stimuli signals and cell death are tumor suppressor protein p53 and Akt (Gottlieb et al., 2002). p53-dependent apoptosis plays a critical role regulating pro- and anti-apoptotic factors for transcription, as well as translocating from the cytosol to mitochondria, where it interacts with proteins related to MMP (Sorrentino et al., 2013). Akt, on the other hand, has been shown to phosphorylate BCL-2 family proteins, therefore inhibiting MMP (Datta et al., 1997). BAD, another valuable pro-apoptotic BCL-2 family protein, is an excellent candidate protein to monitor for this approach due to its intimate relationship with MMP-related proteins (Zha et al., 1996). To this end, a multiplex bead-based ELISA assay was designed and used to simultaneously determine 19 different protein phosphorylation responses for TDZD-8 and 18 different protein phosphorylation responses for MEK inh II at time points relevant to critical signaling events from ATP production bifurcation points. Cells were lysed at the pre-selected critical signaling time points: 40 min and 10 h post-exposure to TDZD-8 (Fig. 3) and at 20 min and 8 h 20 min post-exposure to MEK inh II (Fig. 4); the phosphoprotein responses of 19 (or 18) different proteins were determined relative to control, which received dosing vehicle (< 1% DMSO).
FIG. 3.

Protein phosphorylation responses of HepG2 cells to TDZD-8. From the previously determined temporal bifurcations (40 min and 10 h), relative protein phosphorylation was determined by dosing HepG2 cells with various doses of TDZD-8 (10, 20, 30, 40, 50, and 100μM) and lysing the cell membrane at (a–b) 40 min and (c–d) 10 h post-exposure. Relative phosphorylation was calculated by normalizing to controls, which received vehicle control (< 1% DMSO). Error bars reflect S.E.M.
FIG. 4.

Protein phosphorylation responses of HepG2 cells to MEK inh II. From the previously determined temporal bifurcations (20 min and 8 h 20 min), relative protein phosphorylation was determined by dosing HepG2 cells with various doses of MEK inh II (1, 5, 10, 20, 50, and 100μM) and lysing the cell membrane at (a–b) 20 min and (c–d) 8 h 20 min post-exposure. Relative phosphorylation was calculated by normalizing to controls, which received vehicle control (< 1% DMSO). Error bars reflect S.E.M.
Hierarchical Cluster Analysis
In order to group protein responses that are relevant to varying doses of TDZD-8 and MEK inh II, we used the unsupervised (i.e., we did not pre-select clusters) Ward two-way Hierarchical clustering method (Ward, 1963) (Figs. 5a–d). Two-way clustering is necessary to obtain clusters of protein responses across all doses in the first dimension, and dose clusters in the second dimension. Negative control-subtracted raw fluorescence values for cells exposed to TDZD-8 (10, 20, 30, 40, 50, or 100μM) or MEK inh II (1, 5, 10, 20, 50, or 100μM), as well as cells exposed to vehicle control only (0μM), were used to determine cluster distances. By including the 0μM phosphoprotein response values, we can include the distance between no dose and the lowest experimentally determined dose to forecast the full plasma membrane degradation dose-response. Additionally, if we assume that an arbitrary/infinite dose of a xenobiotic (i.e., TDZD-8 or MEK inh II) successfully kills all cells exposed, the fluorescence values due to protein phosphorylation should theoretically be zero (via endogenous protein degradation after the plasma membrane is compromised). From this basic theoretical assumption, we included an “infinite dose” column with raw fluorescence values of zero for each protein in the two-way hierarchical cluster analysis. Importantly, the inclusion of a true 0μM dose and a theoretical infinite dose allows for a full dose-response prediction to be made without experimentally testing the entire dosing range. As a visual aid, this unsupervised hierarchical clustering method yields a heat map of phosphoprotein responses, where blue represents low response values and red represents high response values. These clusters are based on similarities in phosphoprotein response magnitude profiles. After performing two-way hierarchical cluster analysis on each protein for each set of replicates (clusters not shown, only averaged responses are depicted in Figs. 5a–d), cluster distances between doses were used for dose-response predictions.
FIG. 5.
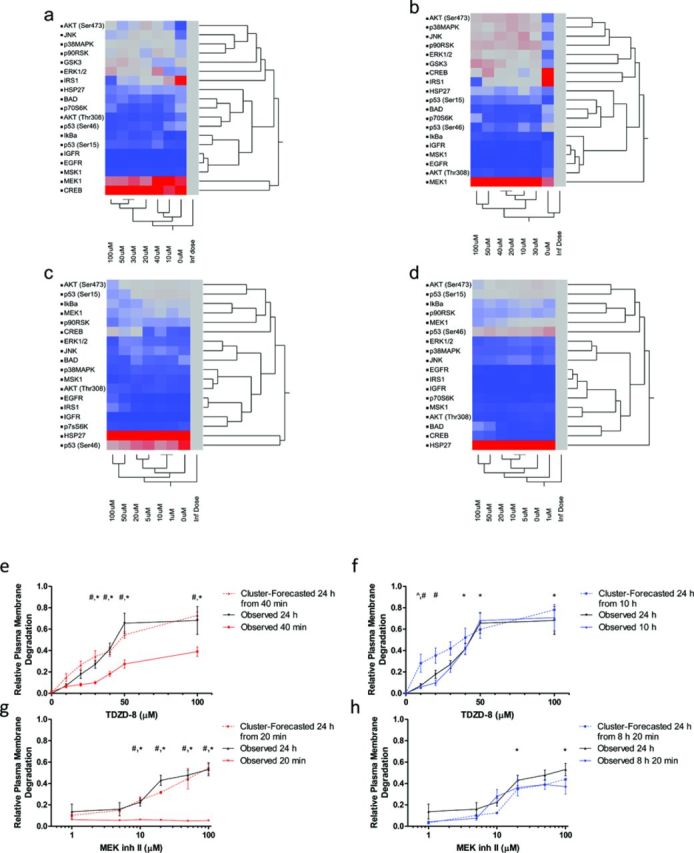
Forecasting plasma membrane degradation from two-way hierarchical cluster analysis distances. The phosphoprotein fluorescence responses of HepG2 cells to various doses of TDZD-8 (10, 20, 30, 40, 50, and 100μM) or MEK inh II (1, 5, 10, 20, 50, and 100μM) were analyzed with the unsupervised Ward two-way hierarchical clustering method. Each set of replicates was treated as a different cluster for our analyses; however, to save space, we will show the averaged fluorescence values at each time point. Shown above, cluster analyses of phosphoprotein responses to (a) TDZD-8 at 20 min post-exposure, (b) TDZD-8 at 10 h post-exposure, (c) MEK inh II at 20 min post-exposure, and (d) MEK inh II at 8 h 20 min post-exposure. After the cluster analyses were performed, the cluster distances associated with each dose are assembled and integrated across the dosing range to formulate the forecasted relative plasma membrane degradation dose-response curve (e–h). (e) Experimentally observed relative plasma membrane responses to TDZD-8 at 40 min and 24 h post-exposure are connected with red and black solid lines, respectively. The forecasted 24 h plasma membrane degradation responses that were calculated with cluster distances from 40 min post-TDZD-8 exposure phosphoprotein responses are connected with a red dashed line. (f) Experimentally observed relative plasma membrane degradation responses to TDZD-8 at 10 h and 24 h post-exposure are connected with blue and black solid lines, respectively. The forecasted 24 h plasma membrane degradation responses that were calculated with cluster distances from 10 h post-TDZD-8 exposure phosphoprotein responses are connected with a blue dashed line. (g) Experimentally observed relative plasma membrane degradation responses to MEK inh II at 20 min and 24 h post-exposure are connected with red and black solid lines, respectively. The forecasted 24 h plasma membrane degradation responses that were calculated with cluster distances from 20 min post-MEK inh II exposure phosphoprotein responses are connected with a red dashed line. (h) Experimentally observed relative plasma membrane degradation responses to MEK inh II at 8 h 20 min and 24 h post-exposure are connected with blue and black solid lines, respectively. The forecasted 24 h plasma membrane degradation responses that were calculated with cluster distances from 8 h 20 min post-exposure phosphoprotein responses are connected with a blue dashed line. For graphs in figures e–h, relative plasma membrane responses were analyzed using two-way ANOVA. Cluster-forecasted responses found to be significantly different (p < 0.05) from observed 24 h responses are marked with ∧, cluster-forecasted responses found to be significantly different (p < 0.05) from early time point observed responses are marked with #, and observed early time point responses found to be significantly different (p < 0.05) from observed 24 h responses are marked with *. Error bars reflect ± S.E.M.
Forecasting Dose-Response from Hierarchical Cluster Analysis
By monitoring the phosphorylation response of proteins involved in cellular survival and/or death pathways at early time points, the fate of the cell may be forecasted. After determining the cluster distances from two-way hierarchical cluster analysis with Ward's minimum variance, these values were used to forecast the relative plasma membrane degradation dose-response of TDZD-8 (Fig. 5e,f) and MEK inh II exposed HepG2 cells (Fig. 5g,h). To forecast the dose-response, the cluster distance between doses including 0μM (vehicle control) and the theoretical infinite dose were organized in order of increasing dose. These values were then integrated across each dose (x) interval and divided by the sum of all dose cluster distances, as described by Equation 4:
 |
(4) |
To determine if the forecasted dose-response (from early time points to TDZD-8 or MEK inh II exposure) matched the observed 24 h plasma membrane dose response, a two-way ANOVA was performed. The 24 h observed and forecasted (from 40 min post-TDZD-8 exposure and 20 min and 8 h 20 min post-MEK inh II exposure) plasma membrane responses were not significantly different at any dose. The 24 h observed and forecasted plasma membrane degradation at 10 h post-TDZD-8 exposure were only statistically different at the 10μM TDZD-8 dose (p < 0.05). Additionally, observed versus forecasted plasma membrane degradation at the early time points (20 min plasma membrane degradation post-MEK inh II exposure observed versus forecasted and 40 min plasma membrane degradation post-TDZD-8 exposure observed versus forecasted) were significantly different (p < 0.05) from each other at 30, 40, 50, and 100μM TDZD-8 and 10, 20, 50, and 100μM MEK inh II indicating that we are not measuring plasma membrane degradation at those early time points, rather we are capturing early critical signaling events related to the eventual cellular fate.
DISCUSSION
Understanding the cell's own pharmacodynamic interpretation of exposure to a potentially toxic xenobiotic or therapeutic is imperative to determining the eventual cellular fate. Before morphological changes (e.g., plasma membrane degradation) indicate the overall cellular state, the intracellular domain is coordinating a dynamic and networked response that dictates the eventual cellular outcome. By exploiting critical pharmacodynamic events related to the eventual cellular fate decision, the cellular response to external stimuli (e.g., xenobiotic exposure or general stress) can be forecasted from significantly early time points post-exposure. In this paper, human hepatocellular carcinoma derived HepG2 cells were exposed to two disparate inhibitors, TDZD-8 (GSK-3β substrate-competitive inhibitor) and MEK inh II (MEK1 inhibitor), to test an approach that combines several datasets to forecast the eventual cellular outcome. The datasets used in this work incorporated theoretical ATP generation for the identification of critical signaling bifurcation points, followed by determinations of the phosphoprotein response at these time points post-exposure for further cluster analyses to forecast the plasma membrane degradation dose-response at 24 h of exposure. This concept has a universal approach: utilizing the cell's own early responses post-exposure to forecast the cell's eventual fate that may be irrespective of the xenobiotic's intracellular mode(s) of action.
To our knowledge, reliable in vitro approaches that are capable of determining important intracellular processes in real time, such as ATP production, without perturbing native intracellular biochemical processes have yet to be determined (Imamura et al., 2009). Real-time oxygen consumption has been used to identify temporal events post-xenobiotic exposure that are related to intracellular signaling, due to the relationship between oxygen consumption and oxidative phosphorylation (Janssen-Heininger et al., 2008). Although we have had some success using oxygen consumption alone to select critical signaling events (Boyd et al., 2013), this method can be improved by exploiting the intricate intracellular relationship between NADH generation, oxygen consumption, and ATP production. By extracellularly monitoring analogs of ATP production over time after xenobiotic exposure, critical signaling events may be estimated without potentially disrupting intracellular activity. In this manner, two bifurcation time points were identified for HepG2 cells post-TDZD-8 or MEK inh II exposure. Because kinase signaling, which utilizes appreciable amounts of available ATP, is an energy demanding process (Hammerman et al., 2004), these early bifurcation points may be indicative of critical signaling processes relevant to intracellular-level decision making for the cell's overall eventual fate. This approach assumes that all oxygen consumption and NADH generation measured in vitro is attributed to oxidative phosphorylation for ATP synthesis. Thus, this model does not incorporate oxidative phosphorylation-independent oxygen consumption, which can vary based on cell type (Herst and Berridge, 2007; Trimarchi et al., 2000). Additionally, cellular glucose, calcium, and magnesium were not measured in this study. For future model development, these critical cellular components may be measured to more accurately select key time points. This new approach may translate well into other cell lines with similar amounts of mitochondria, such as heart and kidney (Veltri et al., 1990), or similar mitochondrial bioenergetics, such as the heart, testes, and brain (Menzies and Gold, 1971). To fully validate this method, additional cell lines, both immortalized and primary, in various tissues need to be tested.
Cell death can take a number of routes, such as necrosis, apoptosis, or autophagy, to name a few (for review, see Galluzzi et al., 2012), whose time course after initial exposure can last anywhere from minutes to days (Lemasters et al., 1998). Irrespective of the cell death modality, the switch between cell death and survival revolves around the integration of signals at mitochondrial membranes that contribute to MMP (Kroemer et al., 2007). Because MMP is a major player in the eventual cellular fate decision of survival or death, monitoring protein signaling cascades that converge upon mitochondrial membranes is an advantageous approach. Forecasting a cell's eventual fate can be accomplished by monitoring the phosphorylation status of proteins that are relevant to survival and death pathways at critical signaling time points following exposure to xenobiotics. Although the minimum number of proteins necessary to forecast future cell death has yet to be determined, our proof of principle study included 19 judiciously selected phosphoproteins in a multiplexable and high-throughput bead-based ELISA assay. In this work, we chose to cast a wide net on cell death and survival pathways at pre-selected time points to capture critical processes responsible for determining the cell's eventual fate. The proteins selected for this study were confirmed to be most relevant to cell death (specifically apoptosis and necrosis) and survival by using IPA-constructed multidirectional interaction networks with biological function overlay (Figs. 6a,b) to visualize the connectivity of the proteins and their association with various biological functions. For future development of this approach, additional phosphoproteins or different combinations of phosphoproteins should be measured to determine the optimal number and type of protein to forecast eventual cellular fate. Additionally, this approach only monitored phosphoprotein responses to xenobiotic exposure. However, different types of post-translational modifications, such as glycosylation, methylation, or acetylation, may also be useful for this type of methodology.
FIG. 6.

IPA of phosphoprotein responses. The most significant network interactions from the 19 different phosphoproteins measured and important intermediate proteins were compiled in IPA. Because the proteins included in the analyses did not change for all doses at both time points, only one dataset per inhibitor is shown in the figure. As examples, (a) 50μM TDZD-8 at 40 min post-exposure and (b) 50μM MEK inh II at 20 min post-exposure are included in the figure above. Normalized phosphoproteins that were greater than control are shown in red and phosphoproteins that were less than control are shown in green. IPA analysis indicated that the most significant molecular and cellular function of both inhibitor datasets were cell death and survival; specifically, apoptosis, cell survival, and necrosis were the most significant biological functions of the proteins included in the analyses.
Although relative phosphoprotein responses of HepG2 cells to various doses of inhibitors at key time points post-exposure offer a wealth of information about these critical signaling events, a more digestible data platform and data transformation are required to construct the forecasted dose-response to TDZD-8 and MEK inh II exposure. Hierarchical cluster analysis using Ward's method produces clusters that minimize the variance within each cluster (Ward, 1963). Going a step further, two-way cluster analysis allows for the simultaneous clustering of both variables in this paper (i.e., phosphoprotein response profiles and dose). In the first dimension, the protein responses across all doses (0μM–100μM and theoretical infinite dose) are clustered to minimize the within-cluster variance and simultaneously in the second dimension, doses with similar phosphoprotein response profiles are clustered together. It is the latter dimension that provides useful distances based on the within-group minimized ANOVA sum of squares across all clusters. By including the vehicle control phosphoprotein responses (0μM) and theoretical infinite dose phosphoprotein responses, the forecasted dose-response range can be computed, regardless of the actual full dose-response curve (i.e., this circumvents the need to pre-determine exposure doses that go from 0% cell death to 100% cell death). Each replicate dose cluster's ANOVA sum of squares distances was placed in order of increasing dose (0μM - theoretical infinite dose) and integrated across the dosing range to formulate the forecasted relative plasma membrane degradation dose-response curve. Although this method does not pinpoint the full intracellular mode(s) of action for the two inhibitors included in this study, the 24 h relative plasma membrane degradation dose-response was accurately forecasted as early as 20 min post-exposure to MEK inh II and 40 min post-exposure to TDZD-8 exposure. Additionally, the observed relative plasma membrane degradation at 20 min post-exposure to MEK inh II and 40 min post-exposure to TDZD-8 has little to no death occurring. Therefore, the phosphoprotein responses at 20 min and 40 min post-exposure are likely associated with the cell's own pharmacodynamic interpretation of exposure and eventual cell fate decision, as opposed to actual cell death occurring at this time point.
In conclusion, this approach offers several advantages over current methodologies to determine future xenobiotic toxicity: using extracellular techniques that do not disrupt the native intracellular biochemical processes to estimate ATP production relevant to critical signaling events, selecting phosphoproteins relevant to survival and/or death pathways at critical signaling time points that may be predictive of the cell's eventual fate (i.e., 24 h post-exposure), and using hierarchical cluster analysis to predict the 24 h relative plasma membrane degradation from early phosphoprotein responses. This method has been shown to accurately forecast the eventual cellular fate of HepG2 cells exposed to two different xenobiotics, with disparate intracellular modes of action, and may theoretically work for any intracellular mode of toxicity or cell death modality. Finally, our results for this approach suggest that an analysis aggregating several different protein networks may be more informative of in vitro toxicity than any individual pathways or biomarkers. This has broad implications for many scientific fields, including toxicology and pharmacology. These advantages allow for future studies in a high-throughput framework to quickly assess and forecast the eventual xenobiotic toxicity of cells in vitro. Additionally, the ability to identify early critical signaling events post-exposure that are related to important cellular endpoints, such as survival or death, may significantly impact the pharmacological understanding of the therapeutic window for treatment strategies, and potentially alter the forecasted cellular fate by probing the endogenous signaling responses to treatments at these time points.
FUNDING
Defense Advanced Research Projects Agency (DARPA) [N66001–09–1–2090-WVA]; NIH IDeA Networks of Biomedical Research Excellence (INBRE) [GM10343]; U. S. Army Research Laboratory and the U. S. Army Research Office [W911NF-12–1–0165]; and West Virginia University.
REFERENCES
- Ainscow E. K., Brand M. D. Top-down control analysis of ATP turnover, glycolysis and oxidative phosphorylation in rat hepatocytes. Eur. J. Biochem. 1999;263:671–685. doi: 10.1046/j.1432-1327.1999.00534.x. [DOI] [PubMed] [Google Scholar]
- Altekruse S. F., McGlynn K. A., Reichman M. E. Hepatocellular carcinoma incidence, mortality, and survival trends in the United States from 1975 to 2005. J. Clin. Oncol. 2009;27:1485–1491. doi: 10.1200/JCO.2008.20.7753. [DOI] [PMC free article] [PubMed] [Google Scholar]
- Anjum R., Blenis J. The RSK family of kinases: emerging roles in cellular signalling. Nat. Rev. Mol. Cell. Biol. 2008;9:747–758. doi: 10.1038/nrm2509. [DOI] [PubMed] [Google Scholar]
- Bakare O., Ashendel C. L., Peng H., Zalkow L. H., Burgess E. M. Synthesis and MEK1 inhibitory activities of imido-substituted 2-chloro-1,4-naphthoquinones. Bioorg. Med. Chem. 2003;11:3165–3170. doi: 10.1016/s0968-0896(03)00267-0. [DOI] [PubMed] [Google Scholar]
- Ballif B. A., Blenis J. Molecular mechanisms mediating mammalian mitogen-activated protein kinase (MAPK) Cell. Growth Differ. 2001;12:397–408. [PubMed] [Google Scholar]
- Boyd J., Vrana J. A., Williams H. N. In vitro approach to predict post-translational phosphorylation response to mixtures. Toxicology. 2013;313:113–121. doi: 10.1016/j.tox.2012.10.010. [DOI] [PubMed] [Google Scholar]
- Bruey J. M., Ducasse C., Bonniaud P., Ravagnan L., Susin S. A., Diaz-Latoud C., Gurbuxani S., Arrigo A. P., Kroemer G., Solary E., et al. Hsp27 negatively regulates cell death by interacting with cytochrome c. Nat. Cell Biol. 2000;2:645–652. doi: 10.1038/35023595. [DOI] [PubMed] [Google Scholar]
- Buttgereit F., Brand M. D. A hierarchy of ATP-consuming processes in mammalian cells. Biochem. J. 1995;312(Pt 1):163–167. doi: 10.1042/bj3120163. [DOI] [PMC free article] [PubMed] [Google Scholar]
- Datta S. R., Dudek H., Tao X., Masters S., Fu H., Gotoh Y., Greenberg M. E. Akt phosphorylation of BAD couples survival signals to the cell-intrinsic death. Cell. 1997;91:231–241. doi: 10.1016/s0092-8674(00)80405-5. [DOI] [PubMed] [Google Scholar]
- Eguchi Y., Shimizu S., Tsujimoto Y. Intracellular ATP levels determine cell death fate by apoptosis or necrosis. Cancer Res. 1997;57:1835–1840. [PubMed] [Google Scholar]
- Eguchi Y., Srinivasan A., Tomaselli K. J., Shimizu S., Tsujimoto Y. ATP-dependent steps in apoptotic signal transduction. Cancer Res. 1999;59:2174–2181. [PubMed] [Google Scholar]
- Galluzzi L., Vitale I., Abrams J. M., Alnemri E. S., Baehrecke E. H., Blagosklonny M. V., Dawson T. M., Dawson V. L., El-Deiry W. S., Fulda S., et al. Molecular definitions of cell death subroutines: recommendations of the Nomenclature Committee on Cell Death 2012. Cell Death Differ. 2012;19:107–120. doi: 10.1038/cdd.2011.96. [DOI] [PMC free article] [PubMed] [Google Scholar]
- Gottlieb T. M., Leal J. F., Seger R., Taya Y., Oren M. Cross-talk between Akt, p53 and Mdm2: possible implications for the regulation of apoptosis. Oncogene. 2002;21:1299–1303. doi: 10.1038/sj.onc.1205181. [DOI] [PubMed] [Google Scholar]
- Hammerman P. S., Fox C. J., Thompson C. B. Beginnings of a signal-transduction pathway for bioenergetic control of cell survival. Trends Biochem. Sci. 2004;29:586–592. doi: 10.1016/j.tibs.2004.09.008. [DOI] [PubMed] [Google Scholar]
- Herst P. M., Berridge M. V. Cell surface oxygen consumption: a major contributor to cellular oxygen consumption in glycolytic cancer cell lines. Biochim. Biophys. Acta. 2007;1767:170–177. doi: 10.1016/j.bbabio.2006.11.018. [DOI] [PubMed] [Google Scholar]
- Huynh H., Nguyen T. T., Chow K. H., Tan P. H., Soo K. C., Tran E. Over-expression of the mitogen-activated protein kinase (MAPK) kinase (MEK)-MAPK. BMC Gastroenterol. 2003;3:19. doi: 10.1186/1471-230X-3-19. [DOI] [PMC free article] [PubMed] [Google Scholar]
- Imamura H., Nhat K. P., Togawa H., Saito K., Iino R., Kato-Yamada Y., Nagai T., Noji H. Visualization of ATP levels inside single living cells with fluorescence resonance energy transfer-based genetically encoded indicators. Proc. Natl Acad. Sci. U.S.A. 2009;106:15651–15656. doi: 10.1073/pnas.0904764106. [DOI] [PMC free article] [PubMed] [Google Scholar]
- Janssen-Heininger Y. M., Mossman B. T., Heintz N. H., Forman H. J., Kalyanaraman B., Finkel T., Stamler J. S., Rhee S. G., van der Vliet A. Redox-based regulation of signal transduction: principles, pitfalls, and promises. Free Radic. Biol. Med. 2008;45:1–17. doi: 10.1016/j.freeradbiomed.2008.03.011. [DOI] [PMC free article] [PubMed] [Google Scholar]
- Kadenbach B. Regulation of respiration and ATP synthesis in higher organisms: hypothesis. J. Bioenerg. Biomembr. 1986;18:39–54. doi: 10.1007/BF00743611. [DOI] [PubMed] [Google Scholar]
- Kanzawa T., Germano I. M., Komata T., Ito H., Kondo Y., Kondo S. Role of autophagy in temozolomide-induced cytotoxicity for malignant glioma cells. Cell Death Differ. 2004;11:448–457. doi: 10.1038/sj.cdd.4401359. [DOI] [PubMed] [Google Scholar]
- Kholodenko B. N. Cell-signalling dynamics in time and space. Nat. Rev. Mol. Cell. Biol. 2006;7:165–176. doi: 10.1038/nrm1838. [DOI] [PMC free article] [PubMed] [Google Scholar]
- Kim L., Kimmel A. R. GSK3, a master switch regulating cell-fate specification and tumorigenesis. Curr. Opin. Genet. Dev. 2000;10:508–514. doi: 10.1016/s0959-437x(00)00120-9. [DOI] [PubMed] [Google Scholar]
- Kondo Y., Kanzawa T., Sawaya R., Kondo S. The role of autophagy in cancer development and response to therapy. Nat. Rev. Cancer. 2005;5:726–734. doi: 10.1038/nrc1692. [DOI] [PubMed] [Google Scholar]
- Kroemer G., Galluzzi L., Brenner C. Mitochondrial membrane permeabilization in cell death. Physiol. Rev. 2007;87:99–163. doi: 10.1152/physrev.00013.2006. [DOI] [PubMed] [Google Scholar]
- Kumar D., Srikanth R., Ahlfors H., Lahesmaa R., Rao K. V. Capturing cell-fate decisions from the molecular signatures of a receptor-dependent signaling response. Mol. Syst. Biol. 2007;3:150. doi: 10.1038/msb4100197. [DOI] [PMC free article] [PubMed] [Google Scholar]
- Leist M., Single B., Castoldi A. F., Kuhnle S., Nicotera P. Intracellular adenosine triphosphate (ATP) concentration: a switch in the decision between apoptosis and necrosis. J. Exp. Med. 1997;185:1481–1486. doi: 10.1084/jem.185.8.1481. [DOI] [PMC free article] [PubMed] [Google Scholar]
- Lemasters J. J., Nieminen A. L., Qian T., Trost L. C., Elmore S. P., Nishimura Y., Crowe R. A., Cascio W. E., Bradham C. A., Brenner D. A., et al. The mitochondrial permeability transition in cell death: a common mechanism in necrosis, apoptosis and autophagy. Biochim. Biophys. Acta. 1998;1366:177–196. doi: 10.1016/s0005-2728(98)00112-1. [DOI] [PubMed] [Google Scholar]
- Madoz-Gurpide J., Canamero M., Sanchez L., Solano J., Alfonso P., Casal J. I. A proteomics analysis of cell signaling alterations in colorectal cancer. Mol. Cell. Proteomics. 2007;6:2150–2164. doi: 10.1074/mcp.M700006-MCP200. [DOI] [PubMed] [Google Scholar]
- Martinez A., Alonso M., Castro A., Perez C., Moreno F. J. First non-ATP competitive glycogen synthase kinase 3 beta (GSK-3beta) inhibitors: thiadiazolidinones (TDZD) as potential drugs for the treatment of Alzheimer's disease. J. Med. Chem. 2002;45:1292–1299. doi: 10.1021/jm011020u. [DOI] [PubMed] [Google Scholar]
- Menzies R. A., Gold P. H. The turnover of mitochondria in a variety of tissues of young adult and aged rats. J. Biol. Chem. 1971;246:2425–2429. [PubMed] [Google Scholar]
- Messam C. A., Pittman R. N. Asynchrony and commitment to die during apoptosis. Exp. Cell Res. 1998;238:389–398. doi: 10.1006/excr.1997.3845. [DOI] [PubMed] [Google Scholar]
- Mitsui H., Takuwa N., Maruyama T., Maekawa H., Hirayama M., Sawatari T., Hashimoto N., Takuwa Y., Kimura S. The MEK1-ERK map kinase pathway and the PI 3-kinase-Akt pathway independently. Int. J. Cancer. 2001;92:55–62. [PubMed] [Google Scholar]
- Nelson D. L., Cox M. M. Lehninger Principles of Biochemistry. New York, NY: W. H. Freeman; 2008. [Google Scholar]
- Newman R. H., Hu J., Rho H. S., Xie Z., Woodard C., Neiswinger J., Cooper C., Shirley M., Clark H. M., Hu S., et al. Construction of human activity-based phosphorylation networks. Mol. Syst. Biol. 2013;9:655. doi: 10.1038/msb.2013.12. [DOI] [PMC free article] [PubMed] [Google Scholar]
- Pearson G., Robinson F., Beers Gibson T., Xu B. E., Karandikar M., Berman K., Cobb M. H. Mitogen-activated protein (MAP) kinase pathways: regulation and physiological functions. Endocr. Rev. 2001;22:153–183. doi: 10.1210/edrv.22.2.0428. [DOI] [PubMed] [Google Scholar]
- Rehm M., Huber H. J., Hellwig C. T., Anguissola S., Dussmann H., Prehn J. H. Dynamics of outer mitochondrial membrane permeabilization during apoptosis. Cell Death Differ. 2009;16:613–623. doi: 10.1038/cdd.2008.187. [DOI] [PubMed] [Google Scholar]
- Roberts P. J., Der C. J. Targeting the Raf-MEK-ERK mitogen-activated protein kinase cascade for the treatment of cancer. Oncogene. 2007;26:3291–3310. doi: 10.1038/sj.onc.1210422. [DOI] [PubMed] [Google Scholar]
- Schilling M., Maiwald T., Hengl S., Winter D., Kreutz C., Kolch W., Lehmann W. D., Timmer J., Klingmuller U. Theoretical and experimental analysis links isoform-specific ERK signalling to cell fate decisions. Mol. Syst. Biol. 2009;5:334. doi: 10.1038/msb.2009.91. [DOI] [PMC free article] [PubMed] [Google Scholar]
- Sebolt-Leopold J. S., Herrera R. Targeting the mitogen-activated protein kinase cascade to treat cancer. Nat. Rev. Cancer. 2004;4:937–947. doi: 10.1038/nrc1503. [DOI] [PubMed] [Google Scholar]
- Shukla A., Bosenberg M. W., MacPherson M. B., Butnor K. J., Heintz N. H., Pass H. I., Carbone M., Testa J. R., Mossman B. T. Activated cAMP Response Element Binding Protein Is Overexpressed in Human Mesotheliomas and Inhibits Apoptosis. Am. J. Pathol. 2009;175:2197–2206. doi: 10.2353/ajpath.2009.090400. [DOI] [PMC free article] [PubMed] [Google Scholar]
- Sorrentino G., Mioni M., Giorgi C., Ruggeri N., Pinton P., Moll U., Mantovani F., Del Sal G. The prolyl-isomerase Pin1 activates the mitochondrial death program of p53. Cell Death Differ. 2013;20:198–208. doi: 10.1038/cdd.2012.112. [DOI] [PMC free article] [PubMed] [Google Scholar]
- Trimarchi J. R., Liu L., Porterfield D. M., Smith P. J., Keefe D. L. Oxidative phosphorylation-dependent and -independent oxygen consumption by individual preimplantation mouse embryos. Biol. Reprod. 2000;62:1866–1874. doi: 10.1095/biolreprod62.6.1866. [DOI] [PubMed] [Google Scholar]
- Vander Heiden M. G., Cantley L. C., Thompson C. B. Understanding the Warburg effect: the metabolic requirements of cell proliferation. Science. 2009;324:1029–1033. doi: 10.1126/science.1160809. [DOI] [PMC free article] [PubMed] [Google Scholar]
- Veltri K. L., Espiritu M., Singh G. Distinct genomic copy number in mitochondria of different mammalian organs. J. Cell. Physiol. 1990;143:160–164. doi: 10.1002/jcp.1041430122. [DOI] [PubMed] [Google Scholar]
- Wang Q., Zhou Y., Wang X., Evers B. M. Glycogen synthase kinase-3 is a negative regulator of extracellular signal-regulated kinase. Oncogene. 2006;25:43–50. doi: 10.1038/sj.onc.1209004. [DOI] [PMC free article] [PubMed] [Google Scholar]
- Warburg O. On the origin of cancer cells. Science. 1956;123:309–314. doi: 10.1126/science.123.3191.309. [DOI] [PubMed] [Google Scholar]
- Ward J. H. Hierarchical grouping to optimize an objective function. J. Am. Stat. Assoc. 1963;58:236–244. [Google Scholar]
- Yamamoto A., Tagawa Y., Yoshimori T., Moriyama Y., Masaki R., Tashiro Y. Bafilomycin A1 prevents maturation of autophagic vacuoles by inhibiting fusion between autophagosomes and lysosomes in rat hepatoma cell line, H-4-II-E cells. Cell Struct. Funct. 1998;23:33–42. doi: 10.1247/csf.23.33. [DOI] [PubMed] [Google Scholar]
- Yang N. C., Ho W. M., Chen Y. H., Hu M. L. A convenient one-step extraction of cellular ATP using boiling water for the luciferin-luciferase assay of ATP. Anal. Biochem. 2002;306:323–327. doi: 10.1006/abio.2002.5698. [DOI] [PubMed] [Google Scholar]
- Zha J., Harada H., Yang E., Jockel J., Korsmeyer S. J. Serine phosphorylation of death agonist BAD in response to survival factor results in binding to 14-3-3 not BCL-X(L) Cell. 1996;87:619–628. doi: 10.1016/s0092-8674(00)81382-3. [DOI] [PubMed] [Google Scholar]