

Abstract
Motivation: Although the majority of gene histories found in a clade of organisms are expected to be generated by a common process (e.g. the coalescent process), it is well known that numerous other coexisting processes (e.g. horizontal gene transfers, gene duplication and subsequent neofunctionalization) will cause some genes to exhibit a history distinct from those of the majority of genes. Such ‘outlying’ gene trees are considered to be biologically interesting, and identifying these genes has become an important problem in phylogenetics.
Results: We propose and implement kdetrees, a non-parametric method for estimating distributions of phylogenetic trees, with the goal of identifying trees that are significantly different from the rest of the trees in the sample. Our method compares favorably with a similar recently published method, featuring an improvement of one polynomial order of computational complexity (to quadratic in the number of trees analyzed), with simulation studies suggesting only a small penalty to classification accuracy. Application of kdetrees to a set of Apicomplexa genes identified several unreliable sequence alignments that had escaped previous detection, as well as a gene independently reported as a possible case of horizontal gene transfer. We also analyze a set of Epichloë genes, fungi symbiotic with grasses, successfully identifying a contrived instance of paralogy.
Availability and implementation: Our method for estimating tree distributions and identifying outlying trees is implemented as the R package kdetrees and is available for download from CRAN.
Contact: ruriko.yoshida@uky.edu
Supplementary information: Supplementary data are available at Bioinformatics online.
1 INTRODUCTION
A central problem in systematic biology is the reconstruction of the evolutionary history of populations and species from numerous gene trees with varying levels of discordance (Brito and Edwards, 2009; Edwards, 2009). Although there is a well-established understanding that discordant phylogenetic relationships will exist among independent gene trees drawn from a common species tree (Maddison, 1997; Pamilo and Nei, 1988; Takahata, 1989), phylogenetic studies have only recently begun to shift away from single-gene and concatenated-gene estimates of phylogeny in favor of multilocus methods (Carling and Brumfield, 2008). These newer approaches focus on the role of genetic drift in producing patterns of incomplete lineage sorting and gene tree/species tree discordance, largely using coalescent theory (Degnan and Salter, 2005; Rosenberg, 2002, 2003). These theoretical developments have been used to reconstruct species trees from samples of estimated gene trees (Carstens and Knowles, 2007; Edwards et al., 2007; Maddison and Knowles, 2006; Mossel and Roch, 2010; RoyChoudhury et al., 2008).
Detecting concordance among gene trees is also a topic of interest. For example, Ané et al. (2007) developed a Bayesian method to estimate concordance among gene trees using molecular sequence data from multiple loci. The method can produce estimated gene trees as well as an estimate of the proportion of the genome that supports a particular clade. However, a priori assumptions must be made about the degree and structure of concordance present in the gene trees.
Although there is a tremendous amount of ongoing effort to develop better parametric models for gene tree distributions, the parametric framework has inherent limitations. Although a parametric method typically makes the most efficient use of a given dataset when the model is specified correctly, they achieve this efficiency by assuming that the true distribution of gene trees is one of a relatively small class of distributions. This can lead to erroneous inferences when the true distribution does not resemble any of the models in the proposed class. Given that many questions remain about the proper way to incorporate a number of important processes into a parametric model (e.g. geographic barriers to migration or a population bottleneck), the problem of model mis-specification is real. Non-parametric methods avoid the majority of these modeling issues, enabling unbiased estimation for a much larger class of true tree distributions at a cost of statistical efficiency.
Numerous processes can reduce the correlation among gene trees. Negative or balancing selection on a particular locus is expected to increase the probability that ancestral gene copies are maintained through speciation events (Takahata and Nei, 1990). Horizontal transfer introduces divergent gene copies into a different species through shuffling gene copies among species via hybridization (Maddison, 1997). The correlation may also be reduced by naive sampling of loci for analysis. For example, paralogous gene copies will result in a gene tree that conflates gene duplication with speciation. Similarly, sampled sequence data that span one or more recombination events will yield ‘gene trees’ that are hybrids of two or more genealogical histories (Posada and Crandall, 2002). These non-coalescent processes can strongly influence phylogenetic inference (Edwards, 2009; Martin and Burg, 2002; Posada and Crandall, 2002). In addition, Rivera et al. (1998) showed that an analysis of complete genomes indicated a massive prokaryotic gene transfer (or transfers) preceding the formation of the eukaryotic cell, arguing that there is significant genomic evidence for more than one distinct class of genes. These examples suggest that the distribution of eukaryotic gene trees may be more accurately modeled as a mixture of a number of more fundamental distributions.
In this article, we focus on the problem of identifying significant discordance among gene trees, as well as estimating the distribution of gene trees as a whole. This set of gene trees is assumed to consist mostly of ‘typical’ (or ‘non-outlier’) gene trees, which are assumed to be independently sampled from some distribution f. For example, gene trees have evolved neutrally under a coalescent process. In addition, there are a smaller number of ‘outlier’ gene trees that are sampled from a different distribution . These genes are assumed to arise from less-common evolutionary processes, for example, paralogy, neofunctionalization, horizontal gene transfer or periods of rapid molecular evolution. In addition, more mundane errors—such as incorrect sequencing, alignment, tree reconstruction or annotation—can also produce outlier trees in a dataset (Horner and Pesole, 2004). Our method produces a non-parametric estimate of the distribution f and also attempts to identify potential outlier gene trees that are probably not generated by f. Trees identified as outliers can then be inspected more closely for biologically interesting properties. In particular, identifying and removing outliers that violate model assumptions can improve the accuracy of inferences made from a collection of gene trees (e.g. Disotell and Raaum, 2004; Edwards, 2009; Martin and Burg, 2002; Posada and Crandall, 2002). Note that in this article we use dissimilarity maps, geodesic distances and topological dissimilarity maps between trees for simulations and implementation of our software (see Subsection 2.1.1). With these distance measures between trees, we implicitly assume a multispecies coalescent model (Helmkamp et al., 2012). Also note that the choice of tree distance measures might change the detected outlying gene trees. For example, if the subtree pruning and regrafting (SPR) distance between trees is used, the detected outlier gene trees would be having an excess of recombinations or horizontal gene transfers.
1.1 Related work
The method presented in this article is not, at its present state of development, a statistical method for hypothesis testing, but rather for discovering possible outliers present in a given collection of orthologous genes. However, there has been significant work devoted to the development of statistical methods for testing hypotheses of discordance between the trees in a collection. The reviewed methods in Poptsova (2009) are the following: (i) likelihood-based tests of tree topologies, such as Kishino–Hasegawa test (Kishino and Hasegawa, 1989), Shimodaira–Hasegawa test (Shimodaira and Hasegawa, 1999) and approximately unbiased tests (Shimodaira, 2002); (ii) tree distance methods, such as Robinson and Foulds (1981) and SPR distances (Goloboff, 2008); and (iii) genome spectral approaches, such as bipartition (Lockhart et al., 1995) and quartet decomposition analyses (Piaggio-Talice et al., 2004).
The likelihood-based tests of tree topologies and tree distance methods are statistical hypothesis tests that detect significant incongruence between trees, i.e. they are testing the following hypotheses:
H0: given trees are topologically congruent.
H1: given trees are topologically incongruent.
The distinction between likelihood- and distance-based methods is in how they calculate the P-value of these hypotheses. The likelihood-based tests compare each gene tree with a species/reference tree using a likelihood value to see if the incongruence is ‘statistically significant’. These methods are also known as partition likelihood support (Lee and Hugall, 2003). Tree distance methods estimate the P-value of the hypotheses above by computing a distance between a reference tree and each gene tree. Holmes (2005) describes a framework for statistical hypothesis testing on trees based on tree distances using distributions of phylogenetic trees (e.g. a posterior distribution or bootstrap resampling). Holmes also presents a statistical method to compare two sets of bootstrap sampling distributions, using the mean and variance of each distribution (Holmes, 2005; Section 4.4.1). A non-parametric method for detecting significant discordance between two sets of trees via supporting vector machines was introduced by Haws et al. (2012). This is a non-parametric method for statistical testing of the hypotheses:
H0: Two sets of trees are drawn from the same distribution.
H1: Two sets of trees are not drawn from the same distribution
Although likelihood-based tests assume that the species tree is known, genome spectral approaches do not use such a reference tree. Genome spectral methods summarize a set of gene trees with phylogenetic spectra (frequencies), such as splits or quartets. These frequencies can be used to approximate the distribution of gene trees, instead of producing a summarizing tree. Outlier trees can be identified by looking for trees whose highly supported features disagree with prevalent features in the spectra (Nepusz et al., 2010).
A non-statistical approach for summarizing collections of gene trees is presented by Nye (2008). Treating each gene tree as a leaf node, a ‘meta-tree’ is constructed where nodes correspond to phylogenetic trees; distances between nodes of the meta-tree correspond to distances between phylogenetic trees, and internal nodes correspond to gene trees with various branches collapsed. When using the Robinson–Fould distance, the non-parametric method proposed in this article can be viewed as a numerical summarization of the meta-tree in (Nye, 2008).
Recently, de Vienne et al. (2012) developed a statistical non-parametric method to detect outlier trees from the set of gene trees. They first convert gene trees into vectors in a multidimensional Euclidean space and then apply multiple co-inertia analysis (MCOA)—an extension of principal coordinate analysis—directly to these vectorized gene trees. Their method, Phylo-MCOA, also detects outlier species, those whose position varies widely from tree to tree. Included in our results are simulation studies comparing our non-parametric method with Phylo-MCOA.
2 METHODS
2.1 Algorithm
Let denote the set of all tree topologies (including multifurcating trees) on n taxa (which we call tree space). We consider trees to be unrooted, but rooted trees can be treated similarly. Our main object of study is a sample, , of N trees (gene trees) mostly drawn from a distribution f on . If n is large enough that , then many tree topologies in the sample may have low empirical frequency. In this case, f cannot be estimated well by assigning to be the empirical frequency of T in the sample. On the other hand, if f corresponds to a model such as the coalescent, it is reasonable to expect that topologies ‘close’ to many observed trees will have a higher likelihood than topologies ‘far away’ from the observed trees.
Kernel density estimation is a non-parametric technique to estimate a distribution that generated a sample, by leveraging the fact that points close to sample points tend to have higher likelihood than distant outlier points [underadequate assumptions on the distribution, namely, the distribution is square integrable (Meloche, 1990)]. Kernel density estimation can be viewed as a refined version of histogram-based estimation of a density.
Given an independent and identically distributed sample of trees , we propose a non-parametric estimator of the distribution that generated the sample with the form
Here k, the kernel function, is a non-negative function defined on pairs of trees, which measures how ‘similar’ two trees are. For our approach, we do not require k to be a kernel in a strict statistical sense.
In kdetrees, we have implemented a kernel of the form
A distance function on the space of trees, , is used to define a univariate projection in the natural way for each fixed , mapping . The ‘shape’ parameter and the ‘bandwidth’ parameters control how tightly each contribution will be centered on Ti. Allowing the bandwidth to vary with the sample points, Ti, is called an adaptive bandwidth method. Alternatively, the bandwidth can be set to a constant value for all Ti.
In general, we can remove the symmetry and triangle inequality requirements for d, and it is possible that the sum over tree space, , will vary with . Ideally, we would remedy this issue by normalizing so that . (This is the case most analogous to kernel density estimation.) However, for the d implemented by kdetrees, Monte Carlo estimates of this sum do not appear to vary significantly across , and so the current version of the software assumes that it is constant. (Additional information about these estimates is presented in Supplementary Fig. S1.)
Because the ultimate goal is to detect outlier trees, Tj, which are not actually drawn from the true distribution f, we are most concerned with estimating the density at the observed sample points. In this context, it makes sense to use a ‘leave-one-out’ estimator that excludes the contribution of the point in question from the tree score,
Once we have computed the scores, , we classify tree Tj as an outlier if is less than . Where Q1 and IQR are the first quartile and the interquartile range of the set of tree scores, respectively, and κ is a classification tuning parameter. The choice of κ affects the sensitivity and specificity of the classifier and is set to 1.5 by default as defined by J. Tukey for finding outliers (Tukey, 1977), although the users may supply their own value.
2.1.1 Choice of tree distance
In our approach, trees can be incorporated into a statistical framework by converting them into a numerical vector format based on a distance matrix or map. These vectorized trees can then be analyzed as points in a multidimensional space where the distance between trees increases as they become more dissimilar (Graham and Kennedy, 2010; Hillis et al., 2005; Semple and Steel, 2003).
For the choice of d, we propose distances derived from three different distances on trees: dissimilarity map dd, topological dissimilarity map dt and geodesic distance dgeo. The dissimilarity map distance measure between two trees is the Euclidean distance, where is a vectorization of trees, , based on an enumeration of the pairwise distances between the tips (Buneman, 1971). The topological dissimilarity map distance measure between two trees is defined similarly, but uses a vectorization that counts the number of edges between the tips (Steel and Penny, 1993). An example calculation of both vd and vt is shown in Supplementary Figure S2.
Billera et al. (2001) showed that the space of rooted trees with a fixed number of taxa is the union of positive cones in . Thus, the space of trees is the set of all metrics derived from valid trees and is a subspace of the space of all distance matrices. The geodesic distance dg is the shortest distance between two valid trees when the connecting path is constrained within this tree space (note that this subspace of valid trees is not itself Euclidean). Owen and Provan (2011) developed an algorithm to compute the geodesic distance between any two valid trees.
2.1.2 Missing taxa
It is desirable for phylogenetic analyses to be able to deal with situations with incomplete data. In this case, the most relevant type of missing data is when some gene trees are missing a tip that is present in other trees in the dataset. Our method is capable of handling such a situation if the dissimilarity or topological distance maps are used. In this situation, we impute missing tip-to-tip distances in the tree vectors with the median value found in trees containing the missing tip. Unfortunately, the geodesic distance algorithm we used does not currently allow us to perform such an imputation, and so kdetrees cannot handle missing tips if the geodesic distance map is selected.
If the trees have node labels that correspond to support for the given split (obtained, for example, by a bootstrap analysis), then the software can accommodate this information by collapsing nodes with support less than a given value. This behavior is disabled by default.
2.1.3 Kernel bandwidth
The estimator depends crucially on the choice of the bandwidth parameter h. We use a nearest-neighbor approach to estimate an adaptive bandwidth for each sample point. To estimate the bandwidth for a point Tj, we use the distance to the m-th closest sample point. This approach has the effect of causing the kernels to be concentrated in areas where there is a lot of data and diffuse in the tails of the distribution. In the current version of kdetrees, m is defaulted to be 20% of the sample size, a heuristic value chosen based on simulation results.
Alternatively, the bandwidth can be set to a constant value for all Ti. To do this, we must find a way to choose an optimal value for the bandwidth h. We experimented with a constant bandwidth chosen by estimating the partition function using a random sample of trees. However, it seems that we tend to underestimate the bandwidth h, and the results are not as robust as in the case of the adaptive bandwidth.
2.1.4 Tuning parameters
The outlier classifier’s sensitivity depends on the choice of a tuning parameter, κ. The default value, 1.5, is chosen for historical reasons. In our simulations, smaller values of κ, ∼0.75–1, often resulted in false-positive rates (FPRs) close to 5%. Creating plots of the tree scores may be helpful in choosing an appropriate value for a given dataset.
2.1.5 Computational complexity
The running time of kdetrees is dominated by the step where pairwise tree distances are calculated. For N trees, each with n taxa, this step takes operations when using the dissimilarity or topological distances or if using the geodesic distance.
2.2 Simulations
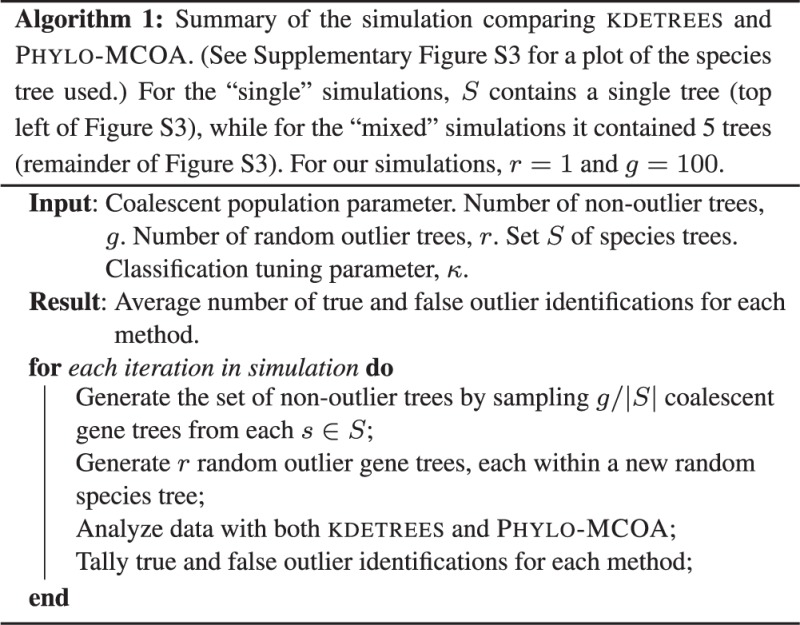
We conducted a series of simulations comparing the performance of kdetrees and Phylo-MCOA. (Code and documentation for the simulations is included in a package vignette with kdetrees.) The simulated data consisted of coalescent trees generated by the Python library DendroPy (Sukumaran and Holder, 2010). Six species trees (see Supplementary Fig. S3) were used to contain coalescent gene trees. A dataset consisted of a small number of ‘outlier’ gene trees, together with a larger number of ‘non-outlier’ gene trees. Pseudocode in Algorithm 1 summarizes the simulation processes.
Our first simulation investigated the classification characteristics of the methods, producing receiver operating characteristic (ROC) curves comparing kdetrees and Phylo-MCOA, by varying the classification tuning parameter of each method. [An ROC curve is a graphical plot of the fraction of true-positive rate versus the fraction of FPR at various threshold settings (Hastie et al., 2009).] In this simulation, we set the effective population size of the coalescent process generating the trees to 2000, a value that produced a moderate amount of variance in the generated coalescent trees.
A second simulation compares the true-positive rates of the methods as the variance of the coalescent trees increases. (Variance of the random trees is controlled by the coalescent population parameter.) This simulation was performed both with the default classification tuning values, as well as values chosen based on the ROC simulation results to limit the FPR to ∼5%.
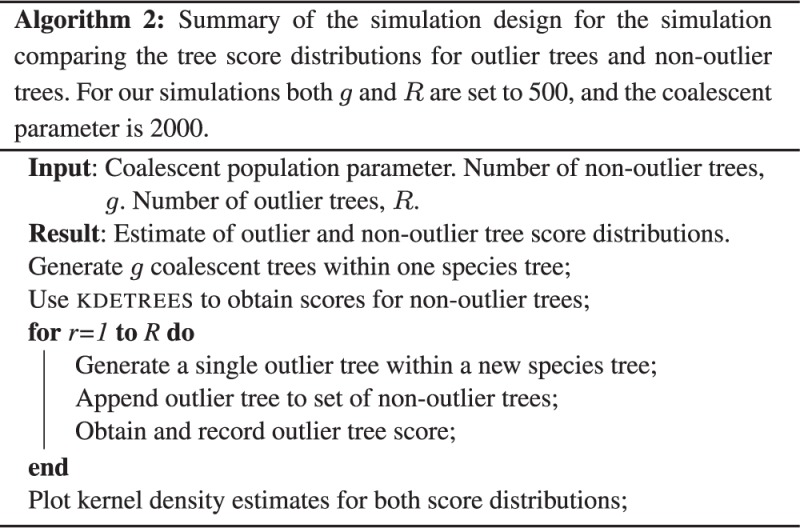
A third simulation compared the distribution of outlier tree scores with the distribution of non-outlier tree scores. The simulation process is summarized in the pseudocode in Algorithm 2.
2.3 Biological datasets
2.3.1 Apicomplexa
The Apicomplexa dataset presented by Kuo et al. (2008) consists of trees reconstructed from 268 single-copy genes from the following species: Babesia bovis (Brayton et al., 2007; GenBank accession numbers AAXT01000001–AAXT01000013), Cryptosporidium parvum (Abrahamsen et al., 2004) from CryptoDB.org (Heiges et al., 2006), Eimeria tenella from GeneDB.org (Hertz-Fowler et al., 2004), Plasmodium falciparum (Gardner et al., 2002) and Plasmodium vivax from PlasmoDB.org (Bahl et al., 2003), Theileria annulata (Pain et al., 2005) from GeneDB.org (Hertz-Fowler et al., 2004) and Toxoplasma gondii from Toxo-DB.org (Gajria et al., 2008). A free-living ciliate, Tetrahymena thermophila (Eisen et al., 2006), was used as the outgroup. To this set of sequences, we appended the Set8 gene, which has been identified by Kishore et al. (2013) as a probable case of horizontal gene transfer from a higher eukaryote to an ancestor of the Apicomplexa.
2.3.2 Epichloë
Another set of biological sequences to use as a test case was generated from housekeeping genes and a known pair of paralogs in Epichloë species and related plant symbionts and parasites in the fungal family Clavicipitaceae. We previously reported sequencing, annotation and the identification of orthologs in genome of Epichloë amarillans strain E57, Epichloë brachyelytri E4804, Epichloë festucae strains E2368 and Fl1, Epichloë glyceriae E277, Epichloë poae E5819, Epichloë typhina E8, Aciculosporium take MAFF-241224, Claviceps fusiformis PRL 1980, Claviceps paspali RRC-1481, Claviceps purpurea 20.1, Neotyphodium gansuense e7080 and Periglandula ipomoeae IasaF13 (Schardl et al., 2013). We compiled the inferred protein sequences for 10 housekeeping proteins, namely, γ-actin (ActG), DNA lyase (ApnB), a calmodulin-dependent protein kinase (CpkA), the largest and second largest subunits of RNA polymerase II (rpbA and rpbB), translation elongation factor 1-α (TefA), α-tubulin (paralogs TubB and TubC) and β-tubulin (paralogs TubB and TubP). As a possible phylogenetic outlier, we used an alignment of proteins related to the Emericella nidulans O-acetylhomoserine (thiol) lyase enzyme (CysD). In some, but not all, of the fungal strains we analyzed, the CysD homologs were located in the loline alkaloid biosynthesis gene cluster and have been designated LolC (Schardl et al., 2013). Analysis by OrthoMCL (Li et al., 2003) grouped all of the CysD-related proteins as orthologs, whereas further analysis with COCO-CL (Jothi et al., 2006a) separated LolC from the other CysD-related sequences as paralogs.
3 RESULTS
We present the software package kdetrees for non-parametric estimation of tree distributions and detection of outlier trees. The software takes as input a sample of trees in Newick format and estimates for each tree a ‘score’ based on a non-parametric estimator of the tree density. It can then use these scores to identify putative outlying trees in the sample. The tree scores and summary plots are produced as output.
The kdetrees package is written in R (R Development Core Team, 2011) and depends on packages DISTORY (Chakerian and Holmes, 2013), GGPLOT2 (Wickham, 2009) and APE (Paradis et al., 2004). The software is available for download from CRAN and is compatible with all systems supported by R.
3.1 Simulation results
Our first simulation, presented in Figure 1, produced ROC curves comparing the various methods of outlier identification. We find that the performance of kdetrees and Phylo-MCOA is similar, with Phylo-MCOA having a slightly better curve in the single simulations, and kdetrees in the mixed scenarios. Interestingly, the geodesic distance worked better for the ‘single’ simulation data than the dissimilarity map, whereas the relationship is reversed for the ‘mixed’ simulation. These results were almost completely unaffected by changes in the proportion of outliers in the sample (proportions between 1 and 10% were tested).
Fig. 1.

ROC curves comparing kdetrees and Phylo-MCOA as the classification tuning parameter is varied. (In general, higher is better; an effective classifier will pass close to the upper left corner.) The effective population size is 2000 for the coalescent trees. At left are the ‘single’ contained coalescent simulations, with the non-outlier trees all contained within a single species tree. At right are results from a ‘mixed’ simulation, with the non-outlier trees generated from a mixture of five species trees
The variability of the coalescent trees is determined by the effective population size, the parameter studied in our second simulation. The proportion of the simulated datasets where each method correctly identified an added outlier tree is illustrated in Figure 2. This simulation was run both with default tuning parameters and ones chosen based on the ROC curve simulation results. If optimal tuning parameters are selected, Phylo-MCOA can outperform kdetrees; however, selecting these correctly can be difficult.
Fig. 2.
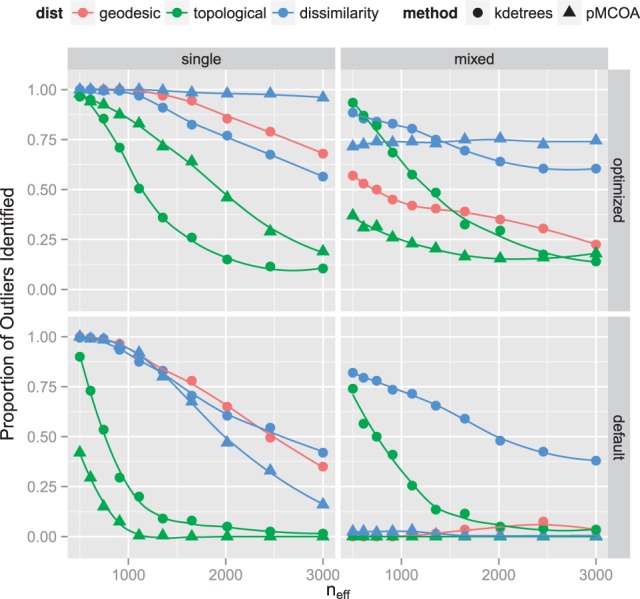
Summary of simulation results comparing performance of kdetrees and Phylo-MCOA for various values of the effective population size. The proportion of simulated datasets in which the methods identified the outlier tree is shown. The top two plots use tuning parameters chosen based on results of the ROC simulation, whereas the bottom plots use default values. For kdetrees, the optimal tuning parameter was , whereas for Phylo-MCOA, it was . The default values are both
We ran a third simulation studying the difference between the score distributions of outlier trees and non-outlier trees, as the ability of our method to reliably detect outlying trees depends on a tendency by outlier trees to produce scores significantly lower than the scores of non-outlier trees. The results are presented in Figure 3. We found that, although there is some overlap between the score distributions, the distribution of scores for outlier trees lies significantly below that of non-outlier trees.
Fig. 3.

Kernel density estimates of the observed distribution of tree scores. The ‘coalescent’ scores are for contained coalescent trees generated within a fixed species tree (bottom). A single random outlier tree is added to this dataset and its score computed. This process is replicated to generate the sample of ‘outlier’ tree scores (top). Lines and dots represent the 5–95% quantiles and the median, respectively. An effective population size of 2000 was used to produce these estimates
3.2 Biological data results
3.2.1 Apicomplexa
The list of putative outlier genes identified by kdetrees in the Apicomplexa data is presented in Table 1, with additional discussion in Supplementary Table S1. When using either the dissimilarity maps or geodesic distance, our method identified the same set of putative outlier trees. (The first four trees identified as putative outliers are also plotted in Supplementary Figure S4, and the entire set of estimated scores are summarized in Supplementary Fig. S5.) These trees all contain a branch with a length that is far too long in proportion to the other branches, leading to their identification as outliers. Closer inspection of these trees suggested that they correspond to questionable sequence alignments, which are likely non-homologues included due to poor annotation, many involving E.tenella sequences.
Table 1.
Apicomplexa gene sets identified as outliers by kdetrees
| No.a | GeneIDb | Functional annotation |
|---|---|---|
| 488 | PF08_0086 | RNA-binding protein |
| 497 | PF13_0228 | 40S ribosomal subunit protein S6 |
| 515 | PFA0390w | DNA repair exonuclease |
| 546 | PFF0285c | DNA repair protein RAD50 |
| 547 | PFL1345c | Radical SAM protein |
| 641 | PFE0750c | Hypothetical protein, conserved |
| 660 | PF10_0043 | Ribosomal protein L13 |
| 662 | PF11_0463 | Coat protein, gamma subunit |
| 728 | MAL13P1.22 | DNA ligase 1 |
| 747 | PFB0550w | Peptide chain release factor subunit 1 |
| 773 | PFF0120w | Geranylgeranyltransferase |
| 780 | PFD0420c | Flap exonuclease |
Notes: All annotations except 728 are putative.
aBased on the gene set designations in Kuo et al. (2008).
bGene set represented by GeneID for P.falciparum.
Because kdetrees revealed that there were pervasive problems with the E.tenella sequence data, we removed this species from the dataset and recreated the phylogenetic analysis as in the paper by Kuo et al. (2008). With the reduced set of gene trees, kdetrees identified a different set of outlier trees, and in this case, the Set8 gene was selected as the furthest outlying tree.
3.2.2 Epichloë
The fungal datasets included alignments of 10 fungal housekeeping proteins, plus an alignment of suspected paralogs designated LolC and CysD. The LolC/CysD tree was identified as one of two outliers, the other being the DNA lyase protein ApnB. Topologically, the LolC/CysD tree differed markedly from the others. However, the topology of the ApnB tree was similar to the topologies for the other housekeeping proteins, so its identification as an outlier suggested that the ApnB tree had significantly different relative branch lengths from those of the other housekeeping protein phylogenies in the analysis.
3.3 Running time
A significant advantage of kdetrees over Phylo-MCOA is a significant improvement in computational speed, especially with larger datasets. Actual kdetrees running times are well fitted by a curve, as suggested by the complexity of the algorithm discussed previously, whereas the Phylo-MCOA times are .
4 DISCUSSION
4.1 Simulations
The results of our simulations were generally positive for kdetrees. Although Phylo-MCOA was often able to slightly outperform kdetrees in classification accuracy, the difference was often relatively small. However, in terms of computational time, kdetrees vastly outperforms Phylo-MCOA, especially as the number of trees in the dataset increases.
In all cases studied, methods incorporating branch length information outperformed the topology-only methods. The performance of the geodesic distance was better in the ‘single’ simulations than the ‘mixed’ simulations, although the reason for this is unclear. All of the methods were able to correctly identify the outlier tree when the effective population size (and thus tree variance) was low, provided that a suitable tuning parameter was chosen. As the variance of the coalescent trees increased, the performance of Phylo-MCOA tended to degrade at a slightly slower rate than kdetrees.
It should be noted that choosing a suitable tuning parameter can be quite difficult, as the optimal value depends on not only the details of the dataset but also one’s subjective opinions on the relative merits of the sensitivity and specificity of the classifier. As such, we also studied the behavior of the algorithms when using their default tuning parameters. This information is relevant, as many users will not change the parameters from their default values. With these values, we found that kdetrees is slightly superior to Phylo-MCOA in the single-distribution simulations. In the mixed-distribution simulations, the default values for Phylo-MCOA resulted in poor performance, whereas kdetrees’s rate of outlier identification was much higher.
The third simulation set compared the distribution of scores for outlier trees with the scores of non-outlier trees. Although the distributions are not completely distinct, it is clear that the outlier trees tend to have scores smaller than the majority of non-outlier trees. Because the outlier trees were generated as completely random coalescent trees, there will inevitably be trees generated that have structure similar to the non-outlier trees, simply by chance, and this accounts for some of the overlap between the distributions. With real data, such trees would correspond to genes that have some exotic history but nonetheless appear to have a phylogeny substantially similar to the rest of the genes in the genome. In this case, it is ambiguous whether such a gene should be legitimately classified as an outlier.
The main advantage of kdetrees over Phylo-MCOA lies in the vast improvement in running time on datasets with larger numbers of gene trees. For small datasets, the difference is not material; however, for datasets with several thousand trees, Phylo-MCOA requires many hours to complete, whereas kdetrees will finish within a few minutes on contemporary commodity hardware.
4.2 Biological datasets
4.2.1 Apicomplexa
The phylum Apicomplexa contains many important protozoan pathogens (Levine, 1988), including the mosquito-transmitted Plasmodium spp., the causative agents of malaria; T.gondii, which is one of the most prevalent zoonotic pathogens worldwide; and the water-borne pathogen Cryptosporidium spp. Several members of the Apicomplexa also cause significant morbidity and mortality in both wildlife and domestic animals. Because of their medical and veterinary importance, whole genome sequencing projects have been completed for multiple prominent members of the Apicomplexa.
The dataset presented in Kuo et al. (2008) consists of 268 orthologous genes from seven species of Apicomplexa and one outgroup ciliate, Tetrahymena thermophelia. To this set of genes, we appended sequences from the Set8 gene, which has been identified by Kishore et al. (2013) as a probable case of horizontal gene transfer from a higher eukaryote to an ancestor of the Apicomplexa.
Although the Set8 gene was not identified initially by kdetrees as an outlier gene, its score was close to the classification threshold and is the next gene to be classified as an outlier if the tuning parameter is lowered slightly, from 1.5 to 1.3. Because many of the outliers in the analysis seem to be caused by questionable annotation in the E.tenella sequences, we removed this species from the dataset and generated new gene trees. In the new analysis, the Set8 gene was identified as the furthest outlier tree. These results demonstrate the potential applicability of the kdetrees method to the curation of genetic datasets by providing a simple tool for highlighting sequences or alignments that may be of further interest. The successful identification of the Set8 outlier indicates that our method is able to highlight interesting cases that warrant further attention from investigators. Moreover, the initial findings with the E.tenella sequences present in the dataset show that kdetrees can be useful for identifying problematic taxa due to incorrect annotation and/or inclusion of non-orthologous genes.
4.2.2 Epichloë
The application of kdetrees to the set of fungal protein alignments successfully identified the paralogous CysD/LolC alignment as an outlier. This is a scenario that could easily arise in phylogenomic analysis, where OrthoMCL (Li et al., 2003) identified the genes as orthologs, although the group was subsequently broken into separate ortholog sets by application of COCO-CL (Jothi et al., 2006b) to the OrthoMCL output. The identification of the LolC/CysD alignment as an outlier was indicative of the utility of kdetrees to identify outliers arising from paralogy.
5 CONCLUSION
The ongoing development of ever-cheaper sequencing methods is producing a plethora of data suitable for phylogenomic analysis. One of the great promises of modern genomics is that phylogenetics applied at the genomic scale (phylogenomics) should be especially powerful for elucidating gene and genome evolution, relationships among species and populations and processes of speciation and molecular evolution. However, for genomic data that can now be generated relatively cheaply and quickly, but for which computationally efficient analytical tools are lacking, there is a major need to explore new approaches to undertake comparative genomic and phylogenomic studies more rapidly and robustly than existing tools allow. There is a major need to explore new approaches to undertake comparative genomic and phylogenomic studies more rapidly and robustly than existing tools allow.
In simulations and applications to biological data, we address particular challenges posed by bioinformatic artifacts, as well as interesting biological phenomena such as gene duplications and horizontal gene transfer. As we observed in the Apicomplexa and fungal datasets, our approach also serves as a means of identifying ‘interesting’ gene trees that may arise from horizontal gene transfer, paralogy or experimental artifacts such as misannotations or misalignments.
A further advantage of our method is that it may be applied in a straightforward way to phylogenetic reconstruction methods which produce a sample of many trees as output, rather than a single ‘best fit’ tree. Methods that produce only a point estimate do not represent the full set of possible phylogenies compatible with the gene sequences. We can circumvent this issue by building a kernel for each gene based on a collection or sample of reconstructed topologies (e.g. via the estimated posterior distribution of each gene), rather than using only a point estimate of each gene tree.
In future work, we intend to extend our method to clustering trees based on similarity, in addition to identifying outliers. The identification and exclusion of outlier points is an important preliminary step in many clustering methods. The removal of outlier points facilitates better inference at the clustering stage (Camastra and Verri, 2005; Hur et al., 2001, 2000).
A long-term goal for this project is to develop a phylogenomic pipeline that is convenient and accessible, as well as robust. To accomplish this aim, important problems that need attention are (i) refinement of gene calls based on comparison among orthologs from multiple genomes and (ii) comparing thousands of gene phylogenies across whole genomes. Therefore, our approach is focused on the efficiency of the algorithm in terms of computational complexity and memory requirements, with less emphasis on achieving the highest classification accuracy possible. Such a trade-off makes our approach more attractive candidate for inclusion in a pipeline for genome-wide phylogenetics as an annotation supplement or as a discovery aid for instances where evolutionary processes deviate significantly from normal.
Supplementary Material
ACKNOWLEDGEMENTS
We thank Drs Chih-Horng Kuo (Academia Sinica, Taiwan) and Jessica Kissinger (University of Georgia) for providing the Apicomplexa dataset. We would also like to offer special thanks to Dr de Vienne and our other reviewers for numerous valuable comments that have greatly improved this article.
Funding: NIH grant [R01GM086888 to G.W., C.S., P.H. and R.Y.] and US Department of Agriculture [USDA/CSREES award 2009-65109-05918 to D.H.].
Conflict of interest: none declared.
REFERENCES
- Abrahamsen MS, et al. Complete genome sequence of the apicomplexan, cryptosporidium parvum. Science. 2004;304:441–445. doi: 10.1126/science.1094786. [DOI] [PubMed] [Google Scholar]
- Ané C, et al. Bayesian estimation of concordance among gene trees. Mol. Biol. Evol. 2007;24:412–426. doi: 10.1093/molbev/msl170. [DOI] [PubMed] [Google Scholar]
- Bahl A, et al. Plasmodb: the plasmodium genome resource. a database integrating experimental and computational data. Nucleic Acids Res. 2003;31:212–215. doi: 10.1093/nar/gkg081. [DOI] [PMC free article] [PubMed] [Google Scholar]
- Billera L, et al. Geometry of the space of phylogenetic trees. Adv. Appl. Math. 2001;27:733–767. [Google Scholar]
- Brayton KA, et al. Genome sequence of babesia bovis and comparative analysis of apicomplexan hemoprotozoa. PLoS Pathog. 2007;3:e148. doi: 10.1371/journal.ppat.0030148. [DOI] [PMC free article] [PubMed] [Google Scholar]
- Brito P, Edwards S. Multilocus phylogeography and phylogenetics using sequence-based markers. Genetica. 2009;135:439–455. doi: 10.1007/s10709-008-9293-3. [DOI] [PubMed] [Google Scholar]
- Buneman P. The recovery of trees from measures of similarity. In: Hodson F, et al., editors. Mathematics of the Archaeological and Historical Sciences. Edinburgh: Edinburgh University Press; 1971. pp. 387–395. [Google Scholar]
- Camastra F, Verri A. A novel kernel method for clustering. IEEE Trans. Pattern Anal. 2005;27:801–804. doi: 10.1109/TPAMI.2005.88. [DOI] [PubMed] [Google Scholar]
- Carling M, Brumfield R. Integrating phylogenetic and population genetic analyses of multiple loci to test species divergence hypotheses in passerina buntings. Genetics. 2008;178:363–377. doi: 10.1534/genetics.107.076422. [DOI] [PMC free article] [PubMed] [Google Scholar]
- Carstens BC, Knowles LL. Estimating species phylogeny from gene-tree probabilities despite incomplete lineage sorting: an example from melanoplus grasshoppers. Syst. Biol. 2007;56:400–411. doi: 10.1080/10635150701405560. [DOI] [PubMed] [Google Scholar]
- Chakerian J, Holmes S. distory: Distance Between Phylogenetic Histories. 2013. R package version 1.4.1 R package available at http://CRAN.R-project.org/package=distory. [Google Scholar]
- de Vienne DM, et al. Phylo-MCOA: a fast and efficient method to detect outlier genes and species in phylogenomics using multiple co-inertia analysis. Mol. Biol. Evol. 2012;29:1587–1598. doi: 10.1093/molbev/msr317. [DOI] [PubMed] [Google Scholar]
- Degnan JH, Salter LA. Gene tree distributions under the coalescent process. Evolution. 2005;59:24–37. [PubMed] [Google Scholar]
- Disotell TR, Raaum RL. The Guenons: Diversity and Adaptation in African Monkeys Developments in Primatology: Progress and Prospects. New York: Kluwer Academic/Plenum Publisher; 2004. Molecular timescale and gene tree incongruence in the guenons; pp. 27–36. [Google Scholar]
- Edwards S. Is a new and general theory of molecular systematics emerging? Evolution. 2009;63:1–19. doi: 10.1111/j.1558-5646.2008.00549.x. [DOI] [PubMed] [Google Scholar]
- Edwards S, et al. High-resolution species trees without concatenation. Proc. Natl Acad. Sci. USA. 2007;104:5936–5941. doi: 10.1073/pnas.0607004104. [DOI] [PMC free article] [PubMed] [Google Scholar]
- Eisen JA, et al. Macronuclear genome sequence of the ciliate Tetrahymena thermophila, a model eukaryote. PLoS Biol. 2006;4:1620–1642. doi: 10.1371/journal.pbio.0040286. [DOI] [PMC free article] [PubMed] [Google Scholar]
- Gajria B, et al. Toxodb: an integrated toxoplasma gondii database resource. Nucleic Acids Res. 2008;36:D553–D556. doi: 10.1093/nar/gkm981. [DOI] [PMC free article] [PubMed] [Google Scholar]
- Gardner MJ, et al. Genome sequence of the human malaria parasite plasmodium falciparum. Nature. 2002;419:498–511. doi: 10.1038/nature01097. [DOI] [PMC free article] [PubMed] [Google Scholar]
- Goloboff PA. Calculating spr distances between trees. Cladistics. 2008;24:591–597. doi: 10.1111/j.1096-0031.2007.00189.x. [DOI] [PubMed] [Google Scholar]
- Graham M, Kennedy J. A survey of multiple tree visualisation. Inf. Vis. 2010;9:235–252. [Google Scholar]
- Hastie T, et al. The Elements of Statistical Learning: Data Mining, Inference, and Prediction. 2nd edn. New York, NY: Springer-Verlag; 2009. [Google Scholar]
- Haws D, et al. A support vector machine based test for incongruence between sets of trees in tree space. BMC Bioinformatics. 2012;13:210. doi: 10.1186/1471-2105-13-210. [DOI] [PMC free article] [PubMed] [Google Scholar]
- Heiges M, et al. Cryptodb: a cryptosporidium bioinformatics resource update. Nucleic Acids Res. 2006;34:D419–D422. doi: 10.1093/nar/gkj078. [DOI] [PMC free article] [PubMed] [Google Scholar]
- Helmkamp L, et al. Improvements to a class of distance matrix methods for inferring species trees from gene trees. J. Comput. Biol. 2012;19:632–649. doi: 10.1089/cmb.2012.0042. [DOI] [PMC free article] [PubMed] [Google Scholar]
- Hertz-Fowler C, et al. Genedb: a resource for prokaryotic and eukaryotic organisms. Nucleic Acids Res. 2004;32:D339–D343. doi: 10.1093/nar/gkh007. [DOI] [PMC free article] [PubMed] [Google Scholar]
- Hillis DM, et al. Analysis and visualization of tree space. Syst. Biol. 2005;54:471–482. doi: 10.1080/10635150590946961. [DOI] [PubMed] [Google Scholar]
- Holmes S. Statistical approach to tests involving phylogenies. In: Gascuel O, editor. Mathematics of Phylogeny and Evolution. 2005. chapter 4. Oxford University Press, New York, pp. 91–117. [Google Scholar]
- Horner DS, Pesole G. Phylogenetic analyses: a brief introduction to methods and their application. Expert Rev. Mol. Diagn. 2004;4:339–350. doi: 10.1586/14737159.4.3.339. [DOI] [PubMed] [Google Scholar]
- Hur AB, et al. A support vector method for clustering. NIPS. 2000:367–373. [Google Scholar]
- Hur AB, et al. Support vector clustering. JMLR. 2001;2:125–137. [Google Scholar]
- Jothi RE, et al. Coco-cl: hierarchical clustering of homology relations based on evolutionary correlations. Bioinformatics. 2006a;22:779–788. doi: 10.1093/bioinformatics/btl009. [DOI] [PMC free article] [PubMed] [Google Scholar]
- Jothi R, et al. Coco-cl: hierarchical clustering of homology relations based on evolutionary correlations. Bioinformatics. 2006b;22:779–788. doi: 10.1093/bioinformatics/btl009. doi: 10.1093/bioinformatics/btl009. [DOI] [PMC free article] [PubMed] [Google Scholar]
- Kishino H, Hasegawa M. Evaluation of the maximum likelihood estimate of the evolutionary tree topologies from dna sequence data. J. Mol. Evol. 1989;29:170–179. doi: 10.1007/BF02100115. [DOI] [PubMed] [Google Scholar]
- Kishore SP, et al. Horizontal gene transfer of epigenetic machinery and evolution of parasitism in the malaria parasite plasmodium falciparum and other apicomplexans. Evol. Biol. 2013:13–37. doi: 10.1186/1471-2148-13-37. [DOI] [PMC free article] [PubMed] [Google Scholar]
- Kuo C, et al. The apicomplexan whole-genome phylogeny: an analysis of incongruence among gene trees. Mol. Biol. Evol. 2008;25:2689–2698. doi: 10.1093/molbev/msn213. [DOI] [PMC free article] [PubMed] [Google Scholar]
- Lee MSY, Hugall AF. Partitioned likelihood support and the evaluation of data set conflict. Syst. Biol. 2003;52:15–22. doi: 10.1080/10635150390132650. [DOI] [PubMed] [Google Scholar]
- Levine N. Progress in taxonomy of the apicomplexan protozoa. J. Eukaryot. Microbiol. 1988;35:518–520. doi: 10.1111/j.1550-7408.1988.tb04141.x. [DOI] [PubMed] [Google Scholar]
- Li L, et al. Orthomcl: identification of ortholog groups for eukaryotic genomes. Genome Res. 2003;13:2178–2189. doi: 10.1101/gr.1224503. [DOI] [PMC free article] [PubMed] [Google Scholar]
- Lockhart PJ, et al. Testing the phylogeny of swordtail fishes using split decomposition and spectral analysis. J. Mol. Evol. 1995;41:666–674. [Google Scholar]
- Maddison WP. Gene trees in species trees. Syst. Biol. 1997;46:523–536. [Google Scholar]
- Maddison WP, Knowles LL. Inferring phylogeny despite incomplete lineage sorting. Syst. Biol. 2006;55:21–30. doi: 10.1080/10635150500354928. [DOI] [PubMed] [Google Scholar]
- Martin AP, Burg TM. Perils of paralogy: using hsp70 genes for inferring organismal phylogenies. Syst. Biol. 2002;51:570–587. doi: 10.1080/10635150290069995. [DOI] [PubMed] [Google Scholar]
- Meloche J. Asymptotic behaviour of the mean integrated squared error of kernel density estimators for dependent observations. Can. J. Stat. 1990;18:205–211. [Google Scholar]
- Mossel E, Roch S. Incomplete lineage sorting: consistent phylogeny estimation from multiple loci. IEEE/ACM Trans. Comput. Biol. Bioinf. 2010;7:166–171. doi: 10.1109/TCBB.2008.66. [DOI] [PubMed] [Google Scholar]
- Nepusz T, et al. Scps: a fast implementation of a spectral method for detecting protein families on a genome-wide scale. BMC Bioinformatics. 2010;11:120. doi: 10.1186/1471-2105-11-120. [DOI] [PMC free article] [PubMed] [Google Scholar]
- Nye TM. Trees of trees: an approach to comparing multiple alternative phylogenies. Syst. Biol. 2008;57:785–794. doi: 10.1080/10635150802424072. [DOI] [PubMed] [Google Scholar]
- Owen M, Provan JS. A fast algorithm for computing geodesic distances in tree space. IEEE ACM Trans. Comput. Biol. 2011;8:2–13. doi: 10.1109/TCBB.2010.3. [DOI] [PubMed] [Google Scholar]
- Pain A, et al. Genome of the host-cell transforming parasite theileria annulata compared with t. parva. Science. 2005;309:131–133. doi: 10.1126/science.1110418. [DOI] [PubMed] [Google Scholar]
- Pamilo P, Nei M. Relationships between gene trees and species trees. Mol. Biol. Evol. 1988;5:568–583. doi: 10.1093/oxfordjournals.molbev.a040517. [DOI] [PubMed] [Google Scholar]
- Paradis E, et al. APE: analyses of phylogenetics and evolution in R language. Bioinformatics. 2004;20:289–290. doi: 10.1093/bioinformatics/btg412. [DOI] [PubMed] [Google Scholar]
- Piaggio-Talice R, et al. Auqrtet supertrees. In: Bininda-Emonds ORP, editor. Phylogenetic Supertrees: Combining Information to Reveal the Tree of Life. Netherlands: Kluwer Academic Publishers; 2004. pp. 173–191. [Google Scholar]
- Poptsova M. Testing phylogenetic methods to identify horizontal gene transfer. In: Gogarten MB, et al., editors. Horizontal Gene Transfer, Volume 532 of Methods in Molecular Biology. New York, NY: Humana Press; 2009. pp. 227–240. [DOI] [PubMed] [Google Scholar]
- Posada D, Crandall K. The effect of recombination on the accuracy of phylogeny reconstruction. J. Mol. Evol. 2002;54:396–402. doi: 10.1007/s00239-001-0034-9. [DOI] [PubMed] [Google Scholar]
- R Development Core Team. R: A Language and Environment for Statistical Computing. Vienna, Austria: R Foundation for Statistical Computing; 2011. ISBN 3-900051-07-0. [Google Scholar]
- Rivera MC, et al. Genomic evidence for two functionally distinct gene classes. Proc. Natl Acad. Sci. USA. 1998;95:6239–6244. doi: 10.1073/pnas.95.11.6239. [DOI] [PMC free article] [PubMed] [Google Scholar]
- Robinson DF, Foulds LR. Comparison of phylogenetic trees. Math. Biosci. 1981;53:131–147. [Google Scholar]
- Rosenberg N. The probability of topological concordance of gene trees and species trees. Theor. Popul. Biol. 2002;61:225–247. doi: 10.1006/tpbi.2001.1568. [DOI] [PubMed] [Google Scholar]
- Rosenberg NA. The shapes of neutral gene genealogies in two species: probabilities of monophyly, paraphyly, and polyphyly in a coalescent model. Evolution. 2003;57:1465–1477. doi: 10.1111/j.0014-3820.2003.tb00355.x. [DOI] [PubMed] [Google Scholar]
- RoyChoudhury A, et al. A two-stage pruning algorithm for likelihood computation for a population tree. Genetics. 2008;180:1095–1105. doi: 10.1534/genetics.107.085753. [DOI] [PMC free article] [PubMed] [Google Scholar]
- Schardl CL, et al. Plant-symbiotic fungi as chemical engineers: multi-genome analysis of the clavicipitaceae reveals dynamics of alkaloid loci. PLoS Genet. 2013;9:e1003323. doi: 10.1371/journal.pgen.1003323. [DOI] [PMC free article] [PubMed] [Google Scholar]
- Semple C, Steel M. Oxford Lecture Series in Mathematics and its Applications. Vol. 24. Oxford, UK: Oxford University Press; 2003. p. xiv+239. [Google Scholar]
- Shimodaira H. An approximately unbiased test of phylogenetic tree selection. Syst. Biol. 2002;51:492–508. doi: 10.1080/10635150290069913. [DOI] [PubMed] [Google Scholar]
- Shimodaira H, Hasegawa M. Multiple comparisons of log-likelihoods with applcations to phylogenetic inference. Mol. Biol. Evol. 1999;16:1114–1116. [Google Scholar]
- Steel M, Penny D. Distributions of tree comparison metrics-some new results. Syst. Biol. 1993;42:126–141. [Google Scholar]
- Sukumaran J, Holder MT. Dendropy: a python library for phylogenetic computing. Bioinformatics. 2010;26:1569–1571. doi: 10.1093/bioinformatics/btq228. [DOI] [PubMed] [Google Scholar]
- Takahata N. Gene genealogy in 3 related populations: consistency probability between gene and population trees. Genetics. 1989;122:957–966. doi: 10.1093/genetics/122.4.957. [DOI] [PMC free article] [PubMed] [Google Scholar]
- Takahata N, Nei M. Allelic genealogy under overdominant and frequency-dependent selection and polymorphism of major histocompatibility complex loci. Genetics. 1990;124:967–978. doi: 10.1093/genetics/124.4.967. [DOI] [PMC free article] [PubMed] [Google Scholar]
- Tukey JW. Exploratory Data Analysis. Boston, MA: Addison–Wesley; 1977. [Google Scholar]
- Wickham H. ggplot2: Elegant Graphics for Data Analysis. New York: Springer; 2009. [Google Scholar]
Associated Data
This section collects any data citations, data availability statements, or supplementary materials included in this article.