Background: OmpC porin is less permeable than OmpF, but there is little difference in channel size.
Results: There are more charged residues in the OmpC channel, and mutating them or increasing ionic strength made it more permeable and OmpF-like.
Conclusion: Charged residues produce the low permeability of OmpC.
Significance: OmpC, produced in a high ionic strength environment, has properties optimized for this environment.
Keywords: Antibiotics, Gram-negative Bacteria, Outer Membrane, Permeability, Transport
Abstract
OmpF and OmpC porin channels are responsible for the passage of small hydrophilic solutes across the outer membrane of Escherichia coli. Although these channels are two of the most extensively studied porin channels, what had yet remained elusive was the reason why OmpC shows markedly lower permeability than OmpF, despite having little difference in its channel size. The OmpC channel, however, is known to contain a larger number of ionizable residues than the OmpF channel. In this study, we examined the channel property of OmpF and OmpC using the intact cell of E. coli, and we found that the permeability of several β-lactams and lactose through OmpC became increased to the level comparable with OmpF with up to 0.3 m salt that may increase the Debye-Hückel shielding or with 2% ethanol or 0.3 m urea that may perturb the short range ordering of water molecules. Replacing 10 pore-lining residues that show different ionization behavior between OmpC and OmpF led to substantial conversion of channel property with respect to their permeability and response to external salt concentration. We thus propose that the overall configuration of ionizable residues in the channel that may orient water molecules and the electrostatic profile of the channel play a decisive role in defining the channel property of the OmpC porin rather than its channel size.
Introduction
The Escherichia coli porins OmpF and OmpC are responsible for nonspecific, passive diffusion of small hydrophilic compounds across the outer membrane. Both channels allow the passage of small molecules of less than ∼600 Da without apparent specificity (1). Permeation rates of substrates, examined mainly by the assay using purified porin protein reconstituted into liposomes (2, 3), are dependent on the gross physicochemical properties of compounds, such as size, hydrophobicity, and charge. Most recently, this concept was further confirmed by experiments using E. coli intact cells with ampicillin and benzylpenicillin as substrates (4).
The major difference between OmpF and OmpC is the lower permeability of OmpC, first reported in 1983 (2, 5). This has also been supported by the observations that the mutant strains lacking OmpF, but not those lacking OmpC, showed an elevated level of antibiotic resistance (6, 7). The less permeable nature of OmpC suggested a narrower pore size for this porin (2).
However, when the crystal structures were solved for OmpF (8), OmpC (9), and its close homologue OmpK36 (87% of sequence identity) of Klebsiella pneumoniae (10), there was no significant difference in pore size among these channels. One key notion regarding the difference of OmpF and OmpC has been raised by Schulz (11) and the authors of the papers about the OmpC (8) and the OmpK36 (10) structure in noting the larger number of charged residues inside the pore lumen of OmpC and OmpK36. This may affect the interaction of solutes with the pore walls and/or the structure and orientation of water molecules inside the channel. However, OmpC permeability has not been examined under conditions that may influence these interactions.
Here, we examined how the permeability through the OmpC channel is affected by environmental parameters such as external ionic strength or the presence of compounds that modify water structure, such as urea or ethanol, using β-lactams and lactose as diffusing solutes. We found that permeability of OmpC increases and becomes as permeable as OmpF under high salt concentration, although the permeability of OmpF is unchanged. We also found that the permeability of β-lactams through OmpC was enhanced by 2% ethanol or 0.3 m urea. Replacement of 10 ionizable residues in the pore lining that differ in charge between OmpC and OmpF led to substantial conversion of channel property in respect of the response to salt concentration, whereas none of the 10 single mutations changed the channel property significantly. These results suggest the importance of the overall configuration of ionizable residues in the channel.
EXPERIMENTAL PROCEDURES
Bacterial Strains
LA51A (4) is a ΔacrAB derivative of LA51 (12), a strain with an increased level of the expression of chromosomal AmpC β-lactamase due to the mutation in the promoter of ampC. The construction procedure for LA51A ΔompF or ΔompC is described in our previous paper (4). Construction of LA51A ΔompF ΔompC was done by transducing the ompF::Tn5 gene from strain MH450 (13) to LA51A ΔompC. Transductants were selected with 35 μg/ml kanamycin. K-12 ΔompF was constructed likewise by transducing ompF::Tn5 to wild-type K-12 (strain 4401 from Coli Genetic Stock Center, Yale University). K-12 ΔompC was constructed by transducing ompC null genotype together with zei-298::Tn10, which is located nearby, from strain CS1253 (14). Transductants were selected with 10 μg/ml tetracycline. K-12ΔompF ΔompC was constructed similarly by transducing the ompF::Tn5 gene to K-12 ΔompC.
Expression of Wild-type and Mutated Porins
The ompF gene (with 213 and 202 nucleotides of upstream and downstream sequences) or the ompC gene (with 230 and 220 nucleotides of upstream and downstream sequences) was amplified from the chromosomal DNA of LA51 and was cloned into a low copy number plasmid pHSG575 (15). The plasmids were transformed into either LA51A ΔompF ΔompC or K-12 ΔompF ΔompC. Fresh transformants (within 2-days after the transformation) were always used for the experiments. Proteins were expressed from their own promoters, and a similar expression level was observed with all constructs (data not shown). To maintain the plasmids, 12.5 μg/ml chloramphenicol was added to culture. Site-directed mutations were introduced by the QuikChange protocol (Stratagene).
Outer Membrane Protein Analysis
Cells were harvested at a late exponential phase (A600 = 1.0–1.2) and suspended in KP buffer (50 mm potassium phosphate (pH 7.0) containing 5 mm MgCl2) with 1 mm phenylmethylsulfonyl fluoride and 100 μg/ml DNase. Cells were disrupted in a French pressure cell at 14,000 p.s.i., and unbroken cells were removed by centrifugation at 3000 × g for 5 min. The supernatant was mixed with 0.5% (final concentration) N-laurylsarcosine. The outer membranes were then pelleted by ultracentrifugation at 100,000 × g for 30 min at 4 °C. Proteins were analyzed by 10% SDS-PAGE.
Influx Assay with Ampicillin (Amp)2 or Benzylpenicillin (PEN)
Protocol was generally the same as described previously (4). Briefly, cells were grown in LB medium with 5 mm MgCl2 at 37 °C with shaking and harvested at a late exponential phase (A600 = 1.0–1.2). Cells were then suspended in KP buffer. The assay was started by mixing the cell suspension with substrates (Amp or PEN). The additional salts to be tested were added at the start of the reaction. The assay mixture was incubated for 10 min at room temperature, and the reaction was stopped by heating in a boiling water bath for 50 s with constant shaking. During this reaction, substrates that permeated across the outer membrane were hydrolyzed by the periplasmic AmpC β-lactamase. The hydrolysis rate of the substrates, which is thus equal to the influx rate (Vin) of substrates, was calculated from the amount of hydrolyzed substrate that was quantified by microiodometry (16).
The total activity of cellular β-lactamase was checked using cell extracts. The protocol for the preparation of cell extracts was described elsewhere (4).
Lactose Uptake Assay
The principle of the assay is described under “Results.” This assay involves two experimental measurements, (i) specific growth rate (s−1) of the cell under various concentrations of lactose and (ii) growth yield of the cell per unit amount of lactose. Measurement of specific growth rate was done according to von Meyenburg (17), and the measurement of growth yield was done according to Nikaido and Rosenberg (18).
Measurement of specific growth rate was done as follows. The cells were precultured overnight at 37 °C with shaking in AB medium (per liter: 2 g of (NH4)2SO4, 6 g of Na2HPO4, 3 g of KH2PO4, 0.011 g of Na2SO4, 0.2 g of MgCl2, 0.01 g of CaCl2, 0.0005 g of FeCl3·7H2O) (the original recipe contains added NaCl (19), but its amount was modified in each experiment as described under “Results”) supplemented with 10 mm lactose as a sole carbon source. This culture was diluted 50-fold in a fresh medium with the desired concentration of lactose (usually 1 or 0.6 mm) and incubated at 37 °C with shaking. As soon as the culture reached exponential phase (around optical density at 450 nm (A450) of 0.2), the culture was diluted (usually 2-, 5-, or 10-fold) to 50 ml of pre-warmed fresh medium without lactose. This culture was further incubated for at least 2 h at 37 °C with shaking, and the initial cell growth after dilution was monitored by measuring A450. Specific growth rate (s−1) was calculated as (ln2)/(doubling time (s)).
Measurement of growth yield was done as follows. Cells were precultured overnight in AB medium (with 50 mm NaCl) supplemented with 10 mm lactose at 37 °C with shaking and diluted 200-fold into fresh medium containing 200–1500 μm lactose. The culture was incubated at 37 °C with shaking, and cell growth was monitored by A600 until the growth reached a plateau. The final cell yield was calculated by converting A600 to cell dry weight on the premise that A600 = 1.0 corresponds to 0.375 mg cell/ml (20).
Permeability coefficient of lactose was obtained by fitting the data points with Equation 1 described below. Curve fitting was done by PSI-Plot (version 9.5, Poly Software International, Inc., New York). The initial settings for the Km and Vmax values for the active transport of lactose were 80 μm < Km < 125 μm, and Vmax = 1.9 nmol/mg/s, according to the data of Wright and Overath (21). Vmax was calculated from the reported kcat value and the amount of lactose carrier per membrane protein (0.2 nmol/mg), on the assumption that 55% of membrane dry weight consists of protein and 30% of cell dry weight consists of membrane.
MIC Determination
Linear gradient plates containing β-lactams to be tested were made using LB (with 50 or 300 mm NaCl) agar containing 5 mm MgCl2 (22). MIC was determined using these plates, according to the protocol described previously (4).
Molecular Visualization and Electrostatic Analysis
Crystal structure of OmpF trimer (Protein Data Bank code 1OPF) (23) and OmpC trimer (2J1N) were visualized by PyMOL (Version 1.6.x.). The structures of mutated porins were predicted by SWISS-MODEL. The electrostatic property of the channel was analyzed by APBS software (24, 25), using PQR files generated by the PDB2PQR server (26). Setting of external ionic concentrations was as follows: 78.9 mm monovalent cation, 31.1 mm monovalent anion, 5.0 mm divalent cation, and 28.9 mm divalent anion, which roughly corresponds to the condition in KP buffer. To analyze the effect of additional 0.3 m monovalent salt, the concentrations of the above four species were set to 385.3, 324.7, 5.0, and 35.3 mm, respectively, which corresponds to the KP buffer containing 0.3 m NaCl.
RESULTS
Increase of Amp and PEN Permeability through OmpC under High Salt Concentrations
The influence of external salt concentration on the permeation rates of Amp and PEN was examined using the intact cell of LA51A expressing only OmpF (ΔompC strain) or only OmpC (ΔompF strain). OmpF or OmpC appeared to be expressed to a similar level in each mutant strain as revealed by SDS-PAGE analysis (data not shown). When the assay was done using cells grown in unsupplemented LB medium (except for 5 mm MgCl2) and resuspended in 50 mm potassium phosphate buffer (pH 7.0) with 5 mm MgCl2, the influx rate (Vin) of Amp and PEN through OmpC was 3–5-fold lower than through OmpF. When 0.3 m NaCl, KCl, or Na2SO4 or 0.12 m MgCl2 was added to the assay buffer, Vin through OmpC was increased severalfold to the level comparable with that of OmpF, although no significant change was observed in OmpF (Fig. 1). A previous study (27) showed that 0.3 m NaCl induced a certain level of plasmolysis of the cell but did not cause major damage to the outer membrane, and this was confirmed in this work by verifying that none of these salts, at least up to the concentration used for this assay, induced the leakage of the periplasmic β-lactamase to the supernatant (data not shown). We also found that none of these salts affected the β-lactamase activity. We examined Vin under several different concentrations of NaCl (Fig. 2). Results showed a concentration-dependent increase of Vin, reaching the same level of Vin through OmpF under the NaCl concentration about 200 mm or higher.
FIGURE 1.
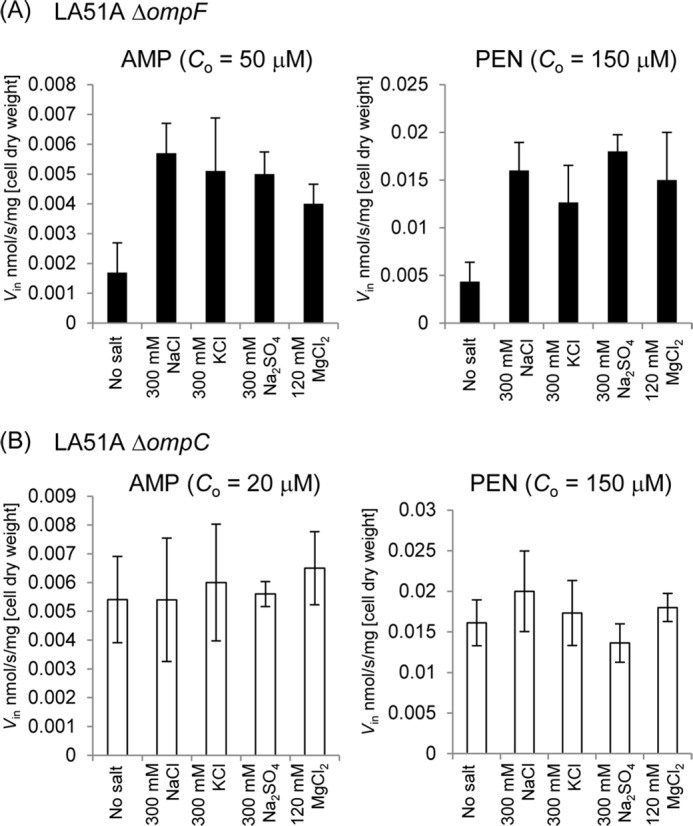
Influx rates (Vin) of Amp and PEN in LA51A ΔompF (A) or ΔompC (B) grown in LB medium containing 5 mm MgCl2 in the presence of NaCl, KCl, Na2SO4, or MgCl2 at given concentrations. Co is the substrate concentration used in the assay. Data represent averages of triplicate measurements with standard deviations.
FIGURE 2.
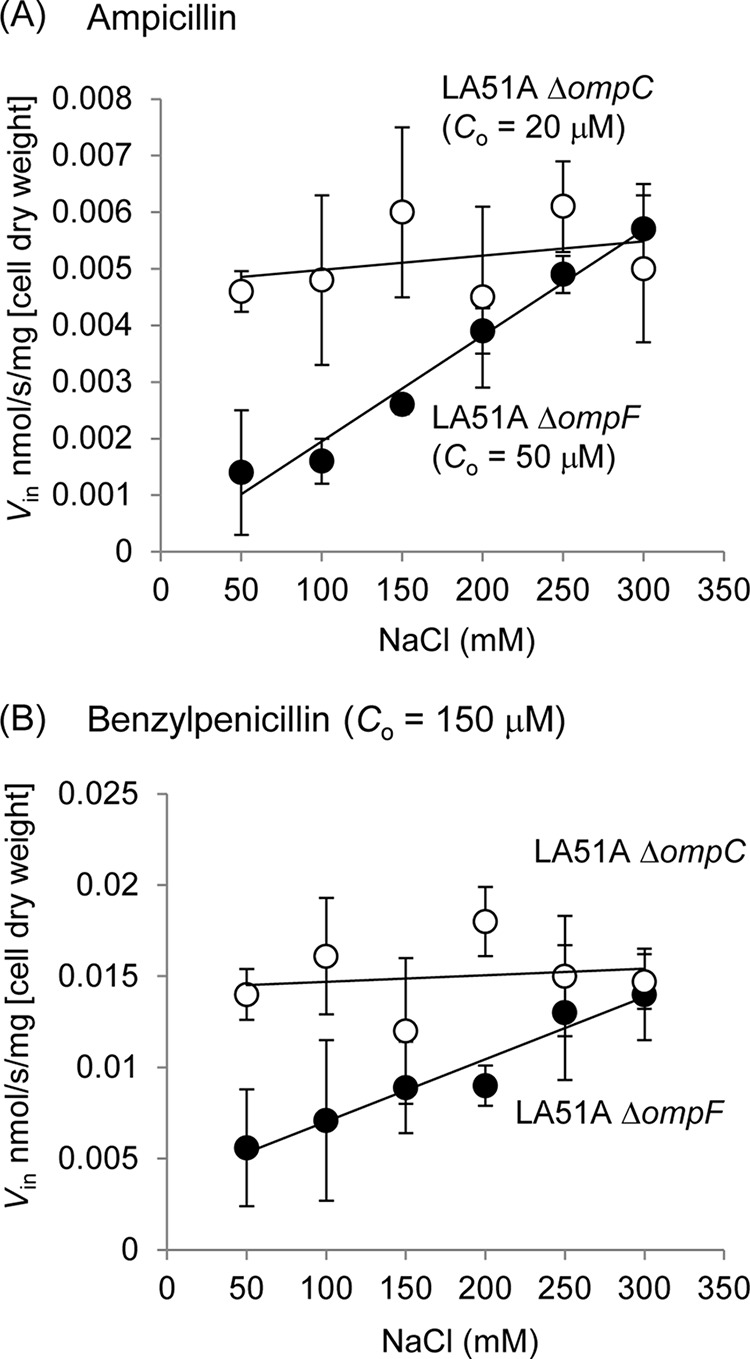
Influx rates (Vin) of ampicillin and benzylpenicillin in LA51A ΔompF (A) or ΔompC (B) under various concentrations of NaCl. Co is the substrate concentration used in the assay. Data represent the averages of triplicate measurements.
To ascertain that increased ionic strength, rather than osmolarity, caused these changes, we tested the effects of other uncharged osmolytes. In this experiment, we used cells grown with the osmolyte (0.3 m NaCl, sucrose, sorbitol, or polyethylene glycol with the average molecular weight of 400 (PEG400)) to avoid the possible effect of sudden osmotic upshift. As shown in Fig. 3, the influx rates (Vin) of both Amp and PEN increased strongly in the presence of NaCl, in the strain producing only OmpC (Fig. 3A) but not in the presence of other uncharged osmolytes. In OmpF-expressing cells (Fig. 3B), NaCl (0.3 m) exerted little effect on the permeation rates of Amp and PEN, although uncharged osmolytes decreased the Vin of PEN, possibly through their effects on water structure (see below).
FIGURE 3.

Influx rates (Vin) of Amp and PEN in LA51A ΔompF (A) or ΔompC (B) grown with various osmolytes and assayed in the presence of corresponding osmolytes. Letters on the abscissa indicate the nature of osmolytes: no additives (a), 0.3 m NaCl (b), 0.3 m sucrose (c), 0.3 m sorbitol (d), or 0.2 m polyethylene glycol (Mr ≈400) (e). Co is the substrate concentration used in the assay. Data represent averages of triplicate measurements with standard deviations.
We also examined whether other agents that might perturb the structure of water, such as ethanol or urea, affect the permeability of porin channel. This experiment was done in 5 mm as well as 50 mm potassium phosphate buffer (pH 7.0), both containing 5 mm MgCl2, to see the effect of salt concentration in the buffer solution. As seen in Fig. 4, 2% (0.435 m) ethanol or 0.3 m urea strongly increased the Vin of PEN (especially in the 50 mm buffer), and 0.3 m urea increased Vin of Amp (in the 5 mm buffer) through OmpC. No obvious change of Vin was observed with OmpF.
FIGURE 4.
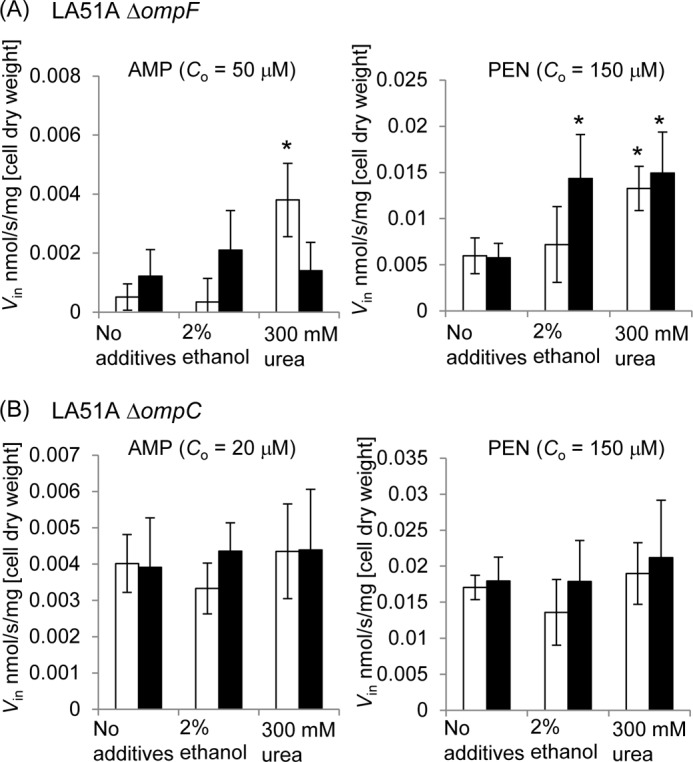
Influx rates (Vin) of ampicillin and benzylpenicillin in LA51A ΔompF (A) or ΔompC (B) in the presence of ethanol or urea at given concentrations. Co is the substrate concentration used in the assay. The assay was conducted with 5 mm (open bars) or 50 mm (filled bars) potassium/phosphate buffer (pH 7.0) containing 5 mm MgCl2. Data represent averages of quadruplicate measurements with standard deviations. Asterisks show the presence of statistically significant changes (p < 0.05 according to Student's t test) in comparison with the data with no additives.
Εffect of NaCl on β-Lactam MICs of the Strain Expressing Only OmpC
Given that the permeability of OmpC increases under high salt concentration, this should be reflected in the susceptibility of the cell to antibiotics. We determined the MIC of Amp, PEN, and several other β-lactams in LB medium with 50 or 300 mm NaCl (Table 1). MIC of these β-lactams for LA51A ΔompF was higher than for LA51A ΔompC at a low concentration (50 mm) of NaCl as expected, but it became lowered under 300 mm NaCl to reach similar values as in LA51A ΔompC. This is consistent with what was expected from the influx assay (Fig. 1). The expression level of OmpF and OmpC did not vary significantly in 50 and 300 mm NaCl as revealed by SDS-PAGE analysis (data not shown); it was shown earlier that the deletion of either ompC or ompF gene compromises the regulation of the remaining porin and consequently allows the nearly full, constitutive expression of the latter under varying conditions (14, 28). Thus, the change of MIC seems to have been caused by the change of permeability of OmpC. It is noteworthy that MIC changes were not restricted only to Amp and PEN but that all of the other β-lactams tested also showed similar changes.
TABLE 1.
MICs (μg/ml) of β-lactams determined in LB medium with 50 or 300 mm NaCl
| Drug | LA51A ΔompF NaCl |
LA51A ΔompC NaCl |
||
|---|---|---|---|---|
| 50 mm | 300 mm | 50 mm | 300 mm | |
| Ampicillin | 35 | 9 | 12 | 12 |
| Benzylpenicillin | 246 | 123 | 138 | 123 |
| Carbenicillin | 14 | 4 | 4 | 4 |
| Cephalothin | 92 | 54 | 69 | 62 |
| Cefaclor | 20 | 5 | 9 | 8 |
| Cefamandole | 2.4 | 0.7 | 1.1 | 0.7 |
| Cefazolin | 6.4 | 3.5 | 3.4 | 3.7 |
NaCl Also Increases Permeability of Lactose through OmpC
As the NaCl-induced increase of OmpC permeability was observed so far with β-lactams, it is now crucial to examine whether a similar phenomenon can be seen with other compounds with no structural similarity to β-lactams. We chose lactose (molecular weight = 342) as the test compound for following reasons. (i) The compound is similar in size to Amp and PEN (molecular weight = 349 and 334), and the compound should not interact with porin channels in any specific manner. To examine the permeability of lactose, we developed the following strategy that consists of two steps as follows: (i) measurement of uptake rate of lactose in intact cell, which can be derived from the specific growth rate (s−1) of the cells in a medium with lactose as a sole carbon source, and (ii) cell yield per unit amount of lactose. In our measurement, 1 mg of lactose gave rise to 0.55 mg (dry weight) of the cell, as shown by the determination of growth yields with five different initial lactose concentrations, from 0.2 to 1.5 mm. This means that a yield of 1 mg of cell was produced by the consumption of 5.3 μmol of lactose. The uptake rate of lactose was thus calculated by multiplying this by the specific growth rate (s−1), giving the rate expressed by the unit of mol·s−1·mg−1 cell dry weight. (ii) The uptake process, however, contains two successive steps as follows: the influx across the outer membrane and the active transport across the cytoplasmic membrane (29). Under the conditions where the external concentration of lactose can serve as a limiting factor for the overall uptake rate (i.e. low concentration of lactose), the rate of outer membrane influx and the rate of active transport can be considered to be equal to each other and also equal to the overall uptake rate. The influx rate, VOM, can be derived by Fick's first law of diffusion, VOM = P·A·(Co − Cp), where P, A, Co, and Cp are permeability coefficient, cell surface area (132 cm2/mg (cell dry weight)) (30), and external and periplasmic concentration of lactose. The active transport rate, VCM, is derived from the Michaelis-Menten equation, VCM = Vmax·Cp/(Cp + Km), where Vmax and Km values are the kinetic parameters of the active transport. Because the uptake rate, V, should be equal to VOM and VCM, the equations above can be combined, eliminating Cp, and then can be solved for V. The solution gives Equation 1,
 |
In theory, a simulation using Equation 1 at different values of Co should be able to give us all the parameters. However, the small number of data points was not sufficient to permit this approach. We therefore used the published values of kinetic constants for the lactose transporter LacY of E. coli (Km = 80–125 μm, Vmax ≈ 1.9 nmol/s/mg (dry cell weight)) (21) and used the simulation with Equation 1 to solve for the only remaining unknown parameter, P, by curve fitting for the V versus Co plot. To measure the uptake rates of lactose in a reliable manner, we constructed the deletion mutant of ompF or ompC from the wild-type K-12 strain that has no marker for nutritional requirement. Fig. 5 shows the uptake rates over the various Co values of lactose with 0, 50, or 150 mm added NaCl. The uptake rates under >150 mm NaCl could not be measured because the cell growth was retarded. The ΔompF strain showed an increase of uptake rate along with the increase of NaCl concentration, whereas ΔompC strain showed no obvious change. Under high concentrations of lactose (at 1 and 1.5 mm), each strain showed an identical growth rate regardless of the NaCl concentration (0, 0.05, and 0.15 m) (data not shown), and thus the change of uptake rate was not caused by the change of total cellular capacity for lactose uptake. The potential complication is the possibility of the active transport rate being affected by the NaCl concentration. However, this is unlikely as the uptake rate in the ΔompC strain did not show any significant change dependent on NaCl. We also know that the outer membrane components can hardly affect the active transport of lactose, according to the study by Wright and Overath (21) in which they showed no obvious difference in the kinetic parameters of active transport examined in spheroplasts and intact cells. Thus, the change of outer membrane permeability is the most plausible explanation for the change of uptake rates. Table 2 shows the permeability coefficients obtained by curve fitting. The permeability difference, by 2-fold, between OmpF and OmpC examined under 0 mm NaCl was in a good agreement with the 4-fold difference obtained by the liposome swelling assay that was conducted under a low salt concentration (4 mm sodium NAD and 1 mm imidazole NAD) (2). The permeability of OmpC became increased to the level comparable with that of OmpF under 150 mm NaCl, a phenomenon that is similar to what was seen with β-lactams.
FIGURE 5.
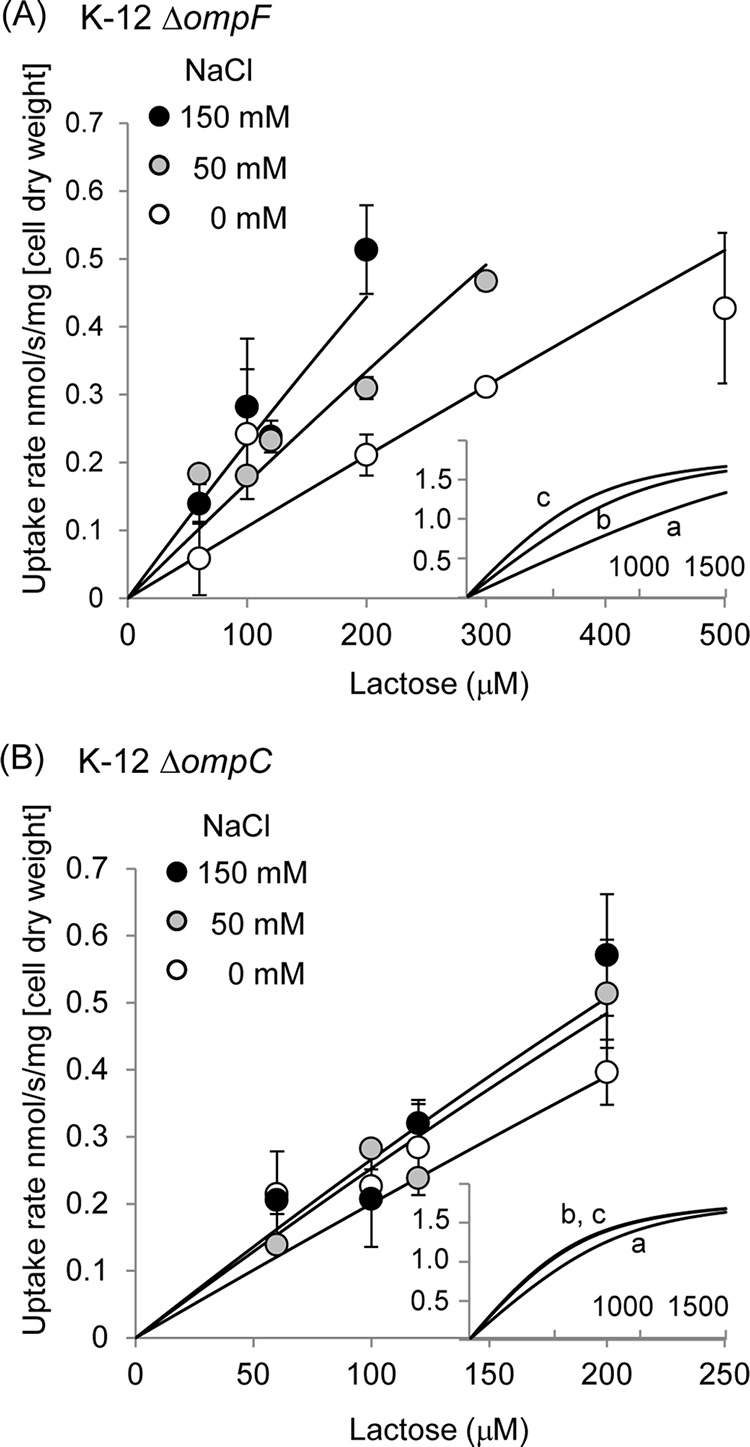
Lactose uptake rate of K-12 ΔompF (A) or ΔompC (B) cultured in AB medium with a given concentration of NaCl. Data show the results obtained by two independent experiments using different lactose concentrations. Lines were drawn by fitting the data point to Equation 1, with the assumed values of the kinetic constants of LacY transporter (see text). The values of P obtained by this simulation are shown in Table 2. Insets show the entire simulation curves at 0 mm (a), 50 mm (b), and 150 mm (c) NaCl.
TABLE 2.
Permeability coefficients of lactose (10−5 cm/s)
| NaCl | Strain |
|
|---|---|---|
| K-12 ΔompF | K-12 ΔompC | |
| mm | ||
| 0 | 0.84 | 1.7 |
| 50 | 1.5 | 2.4 |
| 150 | 2.1 | 2.3 |
We note that lactose permeates through OmpF about 2.8-fold faster than Amp (2, 3), in the liposome swelling assay. The permeability coefficients of lactose and Amp through OmpF, determined here and earlier (4), were 1.73 × 10⁻⁵ and 0.18 × 10⁻⁵ cm/s, and thus there is an almost 10-fold difference. This difference, however, became exaggerated because the liposome swelling assay was done at pH 6.0, a condition where almost all of Amp in a solution is in a zwitterionic state (because pKa of the amino group of Amp is 7.3), in contrast to the present study at pH 7.0 where 71% of Amp is zwitterionic. If we assume that the permeability coefficient of monoanionic Amp is equal to that of PEN (0.06 × 10⁻⁵ cm/s) (4), then the estimated coefficient of zwitterionic Amp becomes 0.24 × 10⁻⁵ cm/s thus the difference between lactose and Amp is reduced to 7-fold. This is still larger than the measured difference of 2.8-fold, but it appears not to be unreasonable, considering the rather imprecise nature of the methods used.
Replacement of the Ionizable Residues That Differ in Charge in the Pore Lining Leads to Substantial Conversion of Channel Property
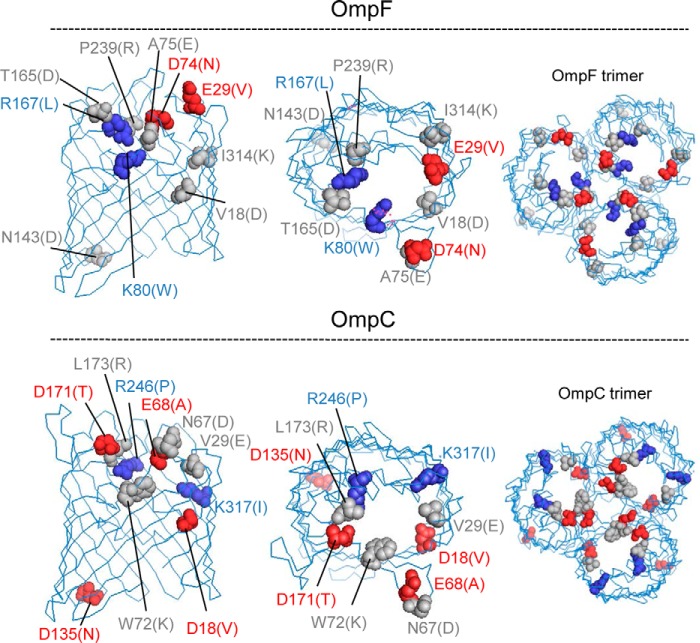
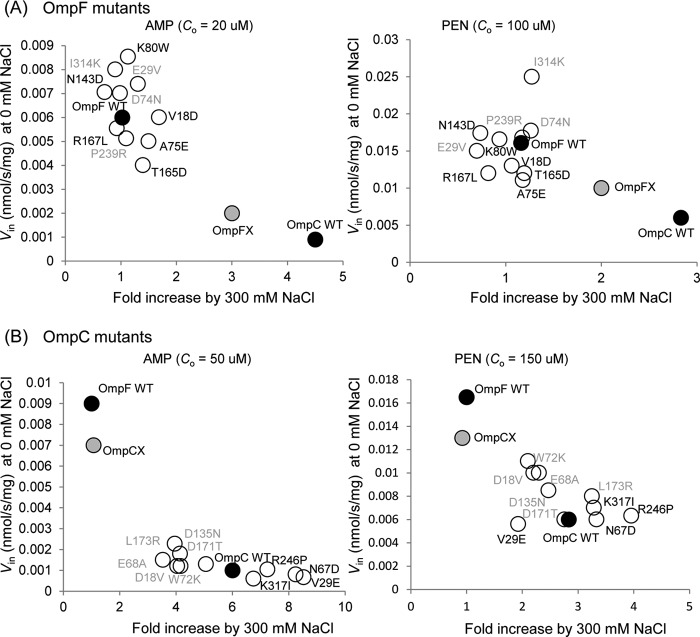
As OmpF and OmpC responded differently to changes in salt concentration, it seemed possible that this difference was caused by the different distributions of the ionizable residues inside each channel. According to Basle et al. (9), there are 10 ionizable residues that differ in charge in the pore lining of OmpF and OmpC (Fig. 6). To examine the possible influence that these residues may have on the channel property, we constructed the mutant channels with all these 10 residues exchanged between each other (OmpFX, OmpF mutant with all 10 residues replaced with the corresponding residues of OmpC; and OmpCX, OmpC mutant with 10 residues replaced likewise), as well as the single mutants with one residue replacement. Channel property was evaluated by two criteria as follows: the extent of increase in permeability upon addition of 0.3 m NaCl, and the absolute permeability of Amp or PEN in the absence of added NaCl (Fig. 7). By both these criteria, OmpFX behaved similarly to OmpC and OmpCX to OmpF, indicating that the channel property was largely converted by the 10-residue replacement. When the response to the added NaCl was compared (Fig. 8), however, OmpFX was more sensitive than OmpC, requiring only 0.06 m added NaCl to reach the maximal permeability.
FIGURE 6.
Position of mutated residues. Negative, positive, and neutral residues were colored with red, blue, and gray. Each residue was replaced with the residue designated in parentheses. Structure was viewed from side (left) or top (middle and right).
FIGURE 7.
Channel properties of OmpF (A) and OmpC (B) mutants. Plasmid-coded porins were expressed in LA51A ΔompF ΔompC, and influx rates of ampicillin and benzylpenicillin were examined under 0 or 300 mm NaCl. Single mutations that give a net positive charge (adding positive charge or removing negative charge) were described in gray type. The others give net negative charge. Co is the substrate concentration used in the assay. Data represent the average of triplicate measurements.
FIGURE 8.
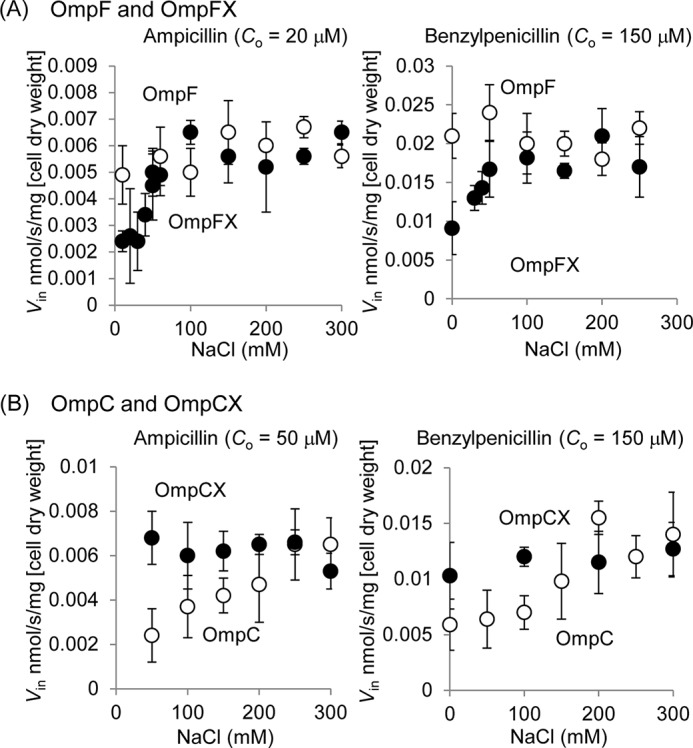
Influx rates (Vin) of ampicillin and benzylpenicillin through OmpF, OmpFX (A), OmpC, and OmpCX (B) under various concentrations of NaCl. Plasmid-coded porins were expressed in LA51A ΔompF ΔompC. Co is the substrate concentration used in the assay. Data represent the average of triplicate measurements with standard deviations.
A similar pattern of permeability change was also observed with lactose (Fig. 9). At 0 mm NaCl, OmpCX showed a higher permeability than OmpC, a result in agreement with the influx assay with Amp and PEN. In contrast, OmpFX showed no difference to OmpF unless the medium used for the assay was further diluted to lower the salt concentration. A 2-fold dilution of the medium with distilled H2O led to a measurable difference between OmpFX and OmpF, with lowered permeability through OmpFX as expected (Fig. 9A). This is probably because the ionic strength of the medium, even without added NaCl, is already higher than in the buffer where OmpFX showed comparable permeability to OmpF in the influx assay with Amp or PEN (50 mm potassium phosphate (pH 7.0) with 60 mm NaCl and 5 mm MgCl2).
FIGURE 9.
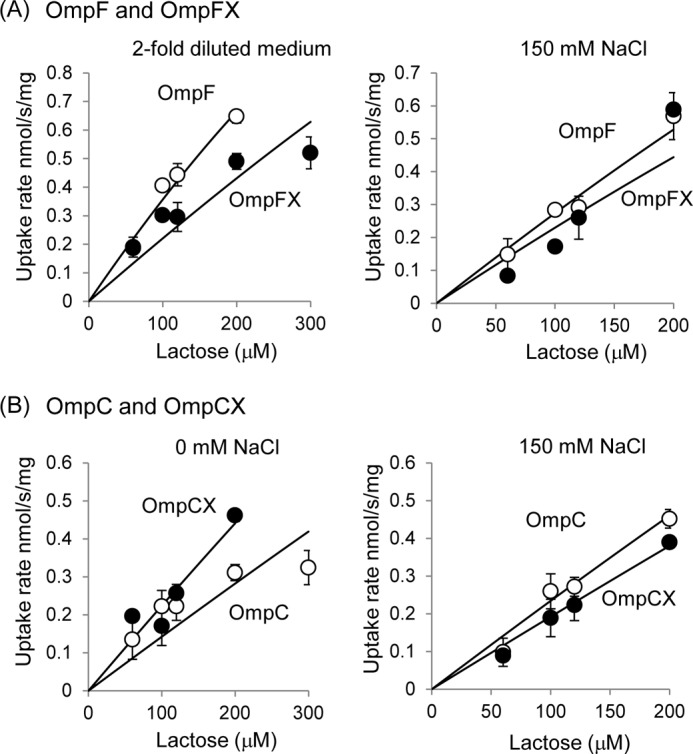
Lactose uptake rate of K-12 ΔompF ΔompC expressing plasmid-coded OmpF and OmpFX (A) or OmpC and OmpCX (B). Cells were cultured in AB medium with the given concentrations of NaCl. The result shown in upper left graph was obtained from the experiment with AB medium diluted with distilled H2O by 2-fold. Data show the results obtained by two independent experiments using different lactose concentrations.
In comparison with the 10-residue replacement mutant channel, none of the single mutations showed a similar large effect (Fig. 7). However, in OmpC, the mutations removing the extra negative charges (E68A, D18V, and to a lesser degree D171T) or adding a positive charge (L173R and W72K) led to a noticeable change of channel property toward the direction of “OmpF-like” property (see the changes in sensitivity to added NaCl with Amp and the increases in PEN permeability in Fig. 7B). The overall properties of single mutants suggest that the ionizable residues exert their influence in a collective way; these results thus appear to imply that the overall configuration of ionizable residues in the channel, and consequently the gross electrostatic property of the channel, possibly plays a decisive role in defining the channel property.
The mutation R167L in OmpF was of special interest because Arg167 was shown to form an “Amp-binding site” together with Arg168, Ser125, Tyr32, and Gly119, and the single mutation of R167S was reported to lead to a 20% increase of the susceptibility of the cell to Amp (31). Unfortunately, in our study R167L produced essentially undetectable effects on Amp penetration (Fig. 7A).
Analysis of Electrostatic Property of OmpF, OmpC, and Mutant Channels
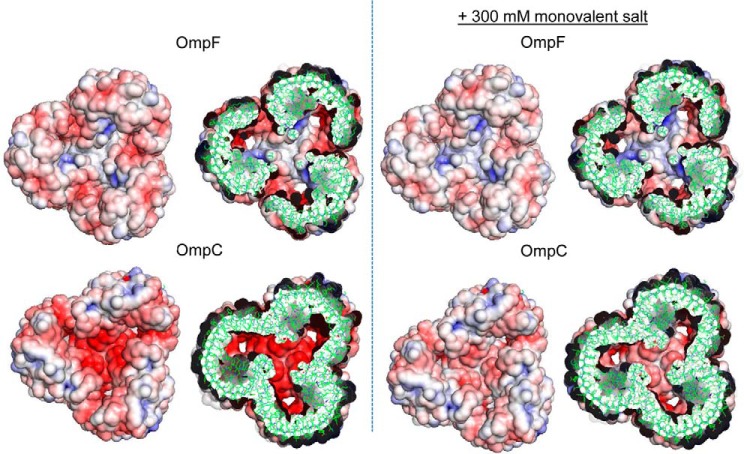
Fig. 10 shows the electrostatic potential on the porin surface. As expected, the pore interior (seen in the cutoff structures) is more negative in OmpC than in OmpF, and 0.3 m NaCl is seen to alleviate this difference significantly. These are qualitatively similar to the analysis done previously (10). Furthermore, the center of the trimer is strikingly different between OmpF and OmpC and is strongly negatively charged in OmpC. This difference is quite reasonable in view of the position of the ionizable residues that differ in charge between OmpF and OmpC (Fig. 6), as most of the residues that add extra negative charges in OmpC (adding a negative charge to OmpC or adding a positive charge to OmpF) are located close to the center of the trimers. The presence of 0.3 m monovalent salt again appeared to alleviate this difference between OmpF and OmpC (Fig. 10). The mutant porins, OmpFX and OmpCX, behaved in a similar manner (data not shown).
FIGURE 10.
Electrostatic property of OmpF and OmpC. Analysis was done at the condition that roughly corresponds to 50 mm potassium/phosphate (pH 7.0) containing 5 mm MgCl2 (left panel) or with additional 300 mm monovalent salt (right panel). All images are the views from outside (extracellular side). The section images show the slab of ±15 Å from Arg-82 of OmpF and Arg-72 of OmpC. Electrostatic potential was visualized with blue (positive potential) to red (negative potential) color corresponding to potential of ± 7 kT/e.
DISCUSSION
One difficulty in assessing the possible alteration of porin channel properties by environmental parameters has been the fact that the widely used liposome swelling assays cannot tolerate large changes in solute concentration or use of high concentrations of salt. With our approach using intact cells, which can tolerate a wide range of environmental conditions, we found that OmpC showed lower permeability than OmpF to both β-lactams and lactose, but this permeability could be increased nearly to the level of OmpF by adding up to 0.3 m salt. Furthermore, we showed that this difference between OmpC and OmpF is mostly due to 10 residues that show different ionization behavior in these two porins. These results are indeed consistent with the 1985 ion permeability studies using black lipid bilayers carried out by Benz et al. (32). Thus, they showed that both OmpF and OmpC are cation-selective, but OmpC is much more strongly cation-selective than OmpF, suggesting the presence of larger numbers of anionic residues in OmpC channel. A similar observation was also made in comparison of OmpK36 and OmpF (10). Furthermore, there was little difference in permeability between OmpF and OmpC in 1 m KCl (32), a result again consistent with our results. However, OmpK36 showed a much lower conductance than OmpF even in 1 m NaCl (10) for reasons not currently understood.
Possible Mechanisms of OmpC Permeability Enhancement
As noted by crystallographers (9–11), the most noticeable difference between OmpF and OmpC is the number and configuration of ionizable residues at the pore interior, resulting in differences in electrostatic potential. The direct electrostatic interaction between the substrate and channel, however, may not be the major factor for the different behaviors of these two porins, because our results showed that similar difference was found regardless of whether the substrate was zwitterionic (Amp), anionic (PEN), or uncharged (lactose). As was also pointed out by crystallographers (9–11), OmpC channel contains a larger number of charged residues (Fig. 6), which are thought to stabilize the structure of oriented water molecules within the channel, slowing down the solute penetration (10). Increased ionic strength should then increase the Debye-Hückel shielding, and thus accelerate the movement of molecules through the OmpC channel. The calculated electrostatic property (Fig. 10) also showed that 0.3 m monovalent salt could alleviate much of the difference between OmpC and OmpF. This interpretation is also supported by the data that both ethanol and urea, which disrupt short range organization of structured water molecules, also enhance Amp and PEN permeability through OmpC (Fig. 4). Both Amp and PEN contain hydrophobic structures of significant size, which would be prevented from entering the ordered structure of water, as their entry will be energetically unfavorable as was first proposed by Schulz in 1992 (33). The lower permeability of a hydrophilic solute, lactose, through the OmpC porin and its increase in a higher ionic strength environment (Table 2) were somewhat unexpected, because solutes of this type might be expected to be able to diffuse through layers of oriented water molecules. However, the stimulation by NaCl was not as pronounced as with Amp and PEN, and oligosaccharides actually contain a hydrophobic face, as seen with the interaction of maltodextrins with the “greasy slide” within the LamB channel (34).
We found that the most obvious difference in the electrostatic properties between OmpF and OmpC trimers, viewed from outside, was the negative potential in OmpC, at the center (Fig. 10). This may help OmpC in attracting basic solutes from external medium, a topic that may be examined in the future.
There are possible alternative explanations of our observations. For example, if the pore size of OmpC varies depending on the external salt concentration, it can also produce the phenomenon we observed in this study. The possible alteration of channel size was described by Kumar et al. (35), who reported that molecular dynamics simulations showed that the area of the narrowest point in the OmpF channel increased by 20% from that seen in the crystal structure, whereas that of OmpC channel decreased by 23% in 50 mm NaCl. However, these changes are in the opposite direction from what is expected from the permeability data in our study, and thus cannot explain our data.
Another alternative explanation is based on the specific binding of Amp to the interior of the OmpF channel (36, 37). However, this is most unlikely because PEN, which has not been shown to interact strongly with the channel, behaves in a similar manner, and most importantly a similar difference between OmpC and OmpF, as well as the salt-induced enhancement through OmpC, was also seen with lactose. Furthermore, we saw no evidence for a saturable uptake process of Amp, which may be expected if its specific binding to the channel played a major role in the permeation process (4).
Implication for Physiological Role of OmpC Channel
The expression level of OmpF and OmpC is strongly regulated in response to a variety of environmental parameters (38). High osmolarity and ionic strength in the medium, as well as higher growth temperature, are especially important in the down-regulation of OmpF and the up-regulation of OmpC. Because these are conditions encountered in the body of higher animals, it has been suggested that this regulation is used by E. coli to maximize the uptake of nutrients through OmpF in natural waters (where the ionic strength as well as the temperature is low) and to minimize the entry of noxious chemicals in the animal body (39). However, even in the intestinal tracts of animals, where presumably OmpC becomes the major porin, E. coli must take up nutrients rapidly in this competitive environment. In this sense, the present finding may be very important in showing salt concentrations similar to those found in this environment make the OmpC porin behave more like the OmpF porin in terms of general permeability (as was indeed predicted earlier by Schulz (11)). It is possible that the permeability of important noxious compounds in this environment, such as bile salts and cationic antimicrobial peptides, might remain low through OmpC, but this is a topic for future investigation.
This work was supported, in whole or in part, by National Institutes of Health Grant RO1 AI-009644 (to H. N.).
- Amp
- ampicillin
- PEN
- benzylpenicillin
- MIC
- minimum inhibitory concentration.
REFERENCES
- 1. Nikaido H. (2003) Molecular basis of bacterial outer membrane permeability revisited. Microbiol. Mol. Biol. Rev. 67, 593–656 [DOI] [PMC free article] [PubMed] [Google Scholar]
- 2. Nikaido H., Rosenberg E. Y. (1983) Porin channels in Escherichia coli: studies with liposomes reconstituted from purified proteins. J. Bacteriol. 153, 241–252 [DOI] [PMC free article] [PubMed] [Google Scholar]
- 3. Yoshimura F., Nikaido H. (1985) Diffusion of β-lactam antibiotics through the porin channels of Escherichia coli K-12. Antimicrob. Agents Chemother. 27, 84–92 [DOI] [PMC free article] [PubMed] [Google Scholar]
- 4. Kojima S., Nikaido H. (2013) Permeation rates of penicillins indicate that Escherichia coli porins function principally as nonspecific channels. Proc. Natl. Acad. Sci. U.S.A. 110, E2629–E2634 [DOI] [PMC free article] [PubMed] [Google Scholar]
- 5. Nikaido H., Rosenberg E. Y., Foulds J. (1983) Porin channels in Escherichia coli: studies with β-lactams in intact cells. J. Bacteriol. 153, 232–240 [DOI] [PMC free article] [PubMed] [Google Scholar]
- 6. Harder K. J., Nikaido H., Matsuhashi M. (1981) Mutants of Escherichia coli that are resistant to certain β-lactam compounds lack the OmpF porin. Antimicrob. Agents Chemother. 20, 549–552 [DOI] [PMC free article] [PubMed] [Google Scholar]
- 7. Jaffe A., Chabbert Y. A., Semonin O. (1982) Role of porin proteins OmpF and OmpC in the permeation of β-lactams. Antimicrob. Agents Chemother. 22, 942–948 [DOI] [PMC free article] [PubMed] [Google Scholar]
- 8. Cowan S. W., Schirmer T., Rummel G., Steiert M., Ghosh R., Pauptit R. A., Jansonius J. N., Rosenbusch J. P. (1992) Crystal structures explain functional properties of two E. coli porins. Nature 358, 727–733 [DOI] [PubMed] [Google Scholar]
- 9. Baslé A., Rummel G., Storici P., Rosenbusch J. P., Schirmer T. (2006) Crystal structure of osmoporin OmpC from E. coli at 2.0 Å. J. Mol. Biol. 362, 933–942 [DOI] [PubMed] [Google Scholar]
- 10. Dutzler R., Rummel G., Albertí S., Hernández-Allés S., Phale P., Rosenbusch J., Benedí V., Schirmer T. (1999) Crystal structure and functional characterization of OmpK36, the osmoporin of Klebsiella pneumoniae. Structure 7, 425–434 [DOI] [PubMed] [Google Scholar]
- 11. Schulz G. E. (2002) The structure of bacterial outer membrane proteins. Biochim. Biophys. Acta 1565, 308–317 [DOI] [PubMed] [Google Scholar]
- 12. Jaurin B., Grundström T., Edlund T., Normark S. (1981) The E. coli β-lactamase attenuator mediates growth rate-dependent regulation. Nature 290, 221–225 [DOI] [PubMed] [Google Scholar]
- 13. Hall M. N., Silhavy T. J. (1981) The ompB locus and the regulation of the major outer membrane porin proteins of Escherichia coli K12. J. Mol. Biol. 146, 23–43 [DOI] [PubMed] [Google Scholar]
- 14. Schnaitman C. A., McDonald G. A. (1984) Regulation of outer membrane protein synthesis in Escherichia coli K-12: deletion of ompC affects expression of the OmpF protein. J. Bacteriol. 159, 555–563 [DOI] [PMC free article] [PubMed] [Google Scholar]
- 15. Takeshita S., Sato M., Toba M., Masahashi W., Hashimoto-Gotoh T. (1987) High-copy-number and low-copy-number plasmid vectors for lacZ α-complementation and chloramphenicol- or kanamycin-resistance selection. Gene 61, 63–74 [DOI] [PubMed] [Google Scholar]
- 16. Novick R. P. (1962) Micro-iodometric assay for penicillinase. Biochem. J. 83, 236–240 [DOI] [PMC free article] [PubMed] [Google Scholar]
- 17. von Meyenburg K. (1971) Transport-limited growth rates in a mutant of Escherichia coli. J. Bacteriol. 107, 878–888 [DOI] [PMC free article] [PubMed] [Google Scholar]
- 18. Nikaido H., Rosenberg E. Y. (1981) Effect on solute size on diffusion rates through the transmembrane pores of the outer membrane of Escherichia coli. J. Gen. Physiol. 77, 121–135 [DOI] [PMC free article] [PubMed] [Google Scholar]
- 19. Clark D. J., Maaloe O. (1967) DNA replication and division cycle in Escherichia coli. J. Mol. Biol. 23, 99–112 [Google Scholar]
- 20. Lim S. P., Nikaido H. (2010) Kinetic parameters of efflux of penicillins by the multidrug efflux transporter AcrAB-TolC of Escherichia coli. Antimicrob. Agents Chemother. 54, 1800–1806 [DOI] [PMC free article] [PubMed] [Google Scholar]
- 21. Wright J. K., Overath P. (1984) Purification of the lactose:H+ carrier of Escherichia coli and characterization of galactoside binding and transport. Eur. J. Biochem. 138, 497–508 [DOI] [PubMed] [Google Scholar]
- 22. Takatsuka Y., Nikaido H. (2006) Threonine-978 in the transmembrane segment of the multidrug efflux pump AcrB of Escherichia coli is crucial for drug transport as a probable component of the proton relay network. J. Bacteriol. 188, 7284–7289 [DOI] [PMC free article] [PubMed] [Google Scholar]
- 23. Cowan S. W., Garavito R. M., Jansonius J. N., Jenkins J. A., Karlsson R., König N., Pai E. F., Pauptit R. A., Rizkallah P. J., Rosenbusch J. P., et al. (1995) The structure of OmpF porin in a tetragonal crystal form. Structure 3, 1041–1050 [DOI] [PubMed] [Google Scholar]
- 24. Holst M. J., Saied F. (1995) Numerical-solution of the nonlinear Poisson-Boltzmann equation–developing more robust and efficient methods. J. Comput. Chem. 16, 337–364 [Google Scholar]
- 25. Baker N. A., Sept D., Joseph S., Holst M. J., McCammon J. A. (2001) Electrostatics of nanosystems: application to microtubules and the ribosome. Proc. Natl. Acad. Sci. U.S.A. 98, 10037–10041 [DOI] [PMC free article] [PubMed] [Google Scholar]
- 26. Dolinsky T. J., Nielsen J. E., McCammon J. A., Baker N. A. (2004) PDB2PQR: an automated pipeline for the setup of Poisson-Boltzmann electrostatics calculations. Nucleic Acids Res. 32, W665–W667 [DOI] [PMC free article] [PubMed] [Google Scholar]
- 27. Decad G. M., Nikaido H. (1976) Outer membrane of Gram-negative bacteria. XII. Molecular-sieving function of cell wall. J. Bacteriol. 128, 325–336 [DOI] [PMC free article] [PubMed] [Google Scholar]
- 28. Ozawa Y., Mizushima S. (1983) Regulation of outer-membrane porin protein-synthesis in Escherichia coli K-12-OmpF regulates the expression of OmpC. J. Bacteriol. 154, 669–675 [DOI] [PMC free article] [PubMed] [Google Scholar]
- 29. Kaback H. R. (2005) Structure and mechanism of the lactose permease. C. R. Biol. 328, 557–567 [DOI] [PubMed] [Google Scholar]
- 30. Smit J., Kamio Y., Nikaido H. (1975) Outer membrane of Salmonella typhimurium: chemical analysis and freeze-fracture studies with lipopolysaccharide mutants. J. Bacteriol. 124, 942–958 [DOI] [PMC free article] [PubMed] [Google Scholar]
- 31. Ziervogel B. K., Roux B. (2013) The binding of antibiotics in OmpF porin. Structure 21, 76–87 [DOI] [PMC free article] [PubMed] [Google Scholar]
- 32. Benz R., Schmid A., Hancock R. E. (1985) Ion selectivity of Gram-negative bacterial porins. J. Bacteriol. 162, 722–727 [DOI] [PMC free article] [PubMed] [Google Scholar]
- 33. Schulz G. E. (1992) in Membrane Proteins: Structures, Interactions and Models (Pulman A., Jortner J., Pulman B., eds) pp. 403–412, Springer, Dordrecht, Netherlands [Google Scholar]
- 34. Schirmer T., Keller T. A., Wang Y. F., Rosenbusch J. P. (1995) Structural basis for sugar translocation through maltoporin channels at 3.1 A resolution. Science 267, 512–514 [DOI] [PubMed] [Google Scholar]
- 35. Kumar A., Hajjar E., Ruggerone P., Ceccarelli M. (2010) Structural and dynamical properties of the porins OmpF and OmpC: insights from molecular simulations. J. Phys. Condens. Matter 22, 454125. [DOI] [PubMed] [Google Scholar]
- 36. Nestorovich E. M., Danelon C., Winterhalter M., Bezrukov S. M. (2002) Designed to penetrate: time-resolved interaction of single antibiotic molecules with bacterial pores. Proc. Natl. Acad. Sci. U.S.A. 99, 9789–9794 [DOI] [PMC free article] [PubMed] [Google Scholar]
- 37. Hajjar E., Bessonov A., Molitor A., Kumar A., Mahendran K. R., Winterhalter M., Pagès J. M., Ruggerone P., Ceccarelli M. (2010) Toward screening for antibiotics with enhanced permeation properties through bacterial porins. Biochemistry 49, 6928–6935 [DOI] [PubMed] [Google Scholar]
- 38. Pratt L. A., Hsing W., Gibson K. E., Silhavy T. J. (1996) From acids to osmZ: multiple factors influence synthesis of the OmpF and OmpC porins in Escherichia coli. Mol. Microbiol. 20, 911–917 [DOI] [PubMed] [Google Scholar]
- 39. Nikaido H., Vaara M. (1985) Molecular basis of bacterial outer membrane permeability. Microbiol. Rev. 49, 1–32 [DOI] [PMC free article] [PubMed] [Google Scholar]


