

Background: Loss of NF1 gene function predisposes individuals to develop NF1-associated tumors, for which there are no known biomarkers/therapeutic targets.
Results: TCTP was up-regulated in NF1-associated tumors and enhanced their growth via its positive feedback to the mTOR signaling, which was inhibited by artesunate/rapamycin.
Conclusion: TCTP is a novel target functionally implicated in NF1 tumorigenesis.
Significance: TCTP could serve as a biomarker/therapeutic target for NF1-associated tumors.
Keywords: Neurofibromatosis Type 1 (NF1), Translationally Controlled Tumor Protein (TCTP), Neurofibroma, Malignant Peripheral Nerve Sheath Tumors (MPNST), Proteomics, Tumor Therapy, Tumor Marker, Tumor Suppressor Gene, mTOR
Abstract
Neurofibromatosis type 1 (NF1) is an autosomal dominant disease that predisposes individuals to develop benign neurofibromas and malignant peripheral nerve sheath tumors (MPNSTs). Due to the lack of information on the molecular mechanism of NF1-associated tumor pathogenesis or biomarkers/therapeutic targets, an effective treatment for NF1 tumors has not been established. In this study, the novel NF1-associated protein, translationally controlled tumor protein (TCTP), was identified by integrated proteomics and found to be up-regulated via activated MAPK/PI3K-AKT signaling in response to growth factors in NF1-deficient Schwann cells. Immunohistochemical analysis of NF1-associated tumors revealed that the TCTP expression level correlated with tumorigenicity. In NF1-deficient MPNST cells, TCTP protein but not mRNA was down-regulated by NF1 GTPase-activating protein-related domain or MAPK/PI3K inhibitors, and this correlated with suppression of mammalian target of rapamycin (mTOR) signaling. mTOR inhibition by rapamycin also down-regulated TCTP protein expression, whereas knockdown or overexpression of TCTP suppressed or activated mTOR signaling, respectively, and affected cell viability. These results suggest that a positive feedback loop between TCTP and mTOR contributes to NF1-associated tumor formation. Last, the anti-tumor effect of artesunate, which binds to and degrades TCTP, was evaluated. Artesunate significantly suppressed the viability of MPNST cells but not normal Schwann cells, and the TCTP level inversely correlated with artesunate sensitivity. Moreover, combinational use of artesunate and rapamycin enhanced the cytotoxic effect on MPNST cells. These findings suggest that TCTP is functionally implicated in the progression of NF1-associated tumors and could serve as a biological target for their therapy.
Introduction
Neurofibromatosis type 1 (NF1)2 is an autosomal, dominantly inherited disorder with an estimated prevalence of 1 in 3,500 people (1). Its hallmarks include development of benign tumors of the peripheral nervous system and an increased risk of malignant transformation. The highly variable NF1 phenotypes affect several organ systems, including the bones, skin, irises, and central and peripheral nervous systems, manifesting in the latter as neurofibromas, gliomas, and learning disabilities.
NF1 is located on chromosome 17q11.2 and encodes a protein of 2,818 amino acids, neurofibromin (2). Because the majority of NF1 mutations found in NF1 patients prevent expression of the intact protein, functional disruption of neurofibromin is potentially relevant in most NF1-related abnormalities (3). Despite the high frequency of NF1 mutations, no specific molecular mechanisms, biomarkers, or therapeutic targets directly related to NF1 pathogenesis have been identified. The treatment of phenotypes such as NF1-associated tumors thus presents considerable difficulty.
Previously, we used nerve growth factor (NGF)-stimulated PC12 cells as a model for neuronal cells and demonstrated a novel role for neurofibromin in neuronal differentiation as a regulator of Ras activity via its GTPase-activating protein (GAP)-related domain (NF1-GRD) (4). We also showed that the functional association of neurofibromin and CRMP-2 (collapsing response mediator protein-2) is essential for neuronal cell differentiation (5). In these studies, neurofibromin expression was suppressed using siRNA directed against NF1, and inhibition of neurofibromin caused neurite retraction via the regulation of Ras-MAPK-CDK5 (cyclin-dependent kinase 5)-GSK3 (glycogen synthase kinase 3)/ROCK (Rho kinase) activation in differentiated PC12 cells stimulated with NGF (5). These results indicated that the neurofibromin-deficient PC12 cell is a useful model for detailed molecular analysis of NF1-related pathology.
In our previous studies, using an integrated proteomics approach in neurofibromin-deficient PC12 cells (6), translationally controlled tumor protein (TCTP) was identified as an antiapoptotic factor uniquely regulated in response to NGF stimulation in PC12 cells (7). TCTP has been found in many eukaryotes, reported as multifunctional, and implicated in diverse processes, including growth, apoptosis, survival, development, protein synthesis, and transcription regulation (8). Interestingly, Tuynder et al. (9) and Telerman et al. (10) reported that TCTP has a functional role in tumor reversion, defined as the process by which cancer cells lose their malignant phenotype. The authors found that TCTP mRNA was down-regulated in human leukemia and breast cancer cell lines infected with H1 parvovirus as a model of tumor reversion. Although the inhibition of colony formation and tumor cell growth was observed, the molecular mechanism of TCTP function in this system has not been clearly delineated (10). Because our previous findings clearly identified TCTP as an NF1-related factor, we hypothesized that TCTP may also functionally relate to NF1-associated tumor formation.
Here, we demonstrate that TCTP may have a functional role in tumor reversion and may be a pathological biomarker of NF1-associated malignant tumors. Our findings also suggest that TCTP could be a novel therapeutic target for neurofibromas and malignant peripheral nerve sheath tumors (MPNSTs).
EXPERIMENTAL PROCEDURES
Cell Culture, Preparation of Cell Lysate, and Evaluation of Cell Viability
PC12 cells obtained from the American Type Culture Collection (ATCC) were cultured under 5% CO2 at 37 °C in Dulbecco's modified Eagle's medium (DMEM) supplemented with 10% horse serum and 5% fetal bovine serum (FBS). Rat S16 Schwann cells from the ATCC were cultured under 5% CO2 at 37 °C in DMEM supplemented with 10% FBS, on poly-l-lysine-coated culture dishes (Iwaki). The human MPNST cell line sNF96.2 from the ATCC and mouse IMS32 Schwann cells isolated as previously reported (11) were cultured under 5% CO2 at 37 °C in DMEM supplemented with 10% FBS on tissue culture dishes (Falcon). Normal human Schwann cells (HSCs) were purchased from ScienCell Research Laboratories and cultured according to the vendor's recommendations. IMS32 cells and HSCs as well as S16 cells are not transformed but are immortalized cell lines that have previously been characterized and established as normal Schwann cells. The doubling time of S16 cells, IMS32 cells, and HSCs is ∼40 h. For preparation of cell lysate, cells were solubilized with a lysis buffer containing 8 m urea, 2% CHAPS, 2 mm Na3VO4, 10 mm NaF, 1 μm okadaic acid, and 1% (v/v) protease inhibitor mixture (Sigma) and passed through a 25-gauge syringe 15 times. Lysates were centrifuged at 13,000 × g for 20 min at 4 °C, and the protein concentration of the supernatants was determined using the Bio-Rad protein assay. Cell viability was assayed using the Cell Counting Kit-8 (CCK-8; Dojindo) per the manufacturer's instructions.
Growth Factors, Inhibitors, and Artesunate Treatment
For NGF stimulation, PC12 cells were cultured on collagen-coated dishes (Iwaki) and stimulated with 50 ng/ml 2.5S NGF (Wako). For serum, platelet-derived growth factor (PDGF), or insulin stimulation, cells were cultured in serum-free DMEM for 16 h and stimulated with 1% (v/v) FBS, 20 ng/ml PDGF-BB (Wako), or 200 nm insulin (Sigma). U0126 (20 μm), LY294002 (30 or 10 μm), and rapamycin (100 nm) were purchased from Calbiochem/EMD Millipore and used for the inhibition of MEK, PI3K, and mTOR, respectively. For artesunate (Sigma) treatment, 3,000 each of sNF96.2, HSC, and IMS32 cells were cultured on a 96-well plate for 24 h and then treated with artesunate (1–100 μg/ml). 1 μm MG132 (Sigma) was used to inhibit proteasomal degradation.
Isolation of Neurofibroma-derived Primary Cells
Neurofibroma tissue was collected at the time of initial surgery at Kumamoto University Hospital. The samples were obtained after informed consent allowing use in this study, as approved by the Institutional Review Board of Kumamoto University and the Ministry of Health and Welfare of Japan. The skin covering the dermal neurofibroma was removed, and the tumor tissue was cut into small pieces and put into preincubation medium consisting of DMEM with 10% FBS and incubated under 5% CO2 at 37 °C. The growing cells were digested with trypsin and further cultured under the same conditions until use.
Immunohistochemistry of Tissue Sections
Human tissue samples obtained from surgical procedures at Saitama Medical School Hospital and Kumamoto University Hospital were routinely fixed in formalin and embedded in paraffin. Use of these archival tissues for research was approved by the Institutional Review Board/Ethics Committee. The slides were deparaffinized with xylene twice for 5 min and rehydrated in descending grades (100, 80, and 70%) of ethanol. Antigen retrieval was performed by incubating the slides in Target Retrieval Solution (pH 9; Nichirei) in a decloaking chamber. After cooling and washing in PBS, slides were first blocked with 5% normal goat serum and then incubated with primary antibody overnight at 4 °C. Following washes in PBS, slides were incubated with secondary antibody (Nichirei) and visualized with DAB solution. Primary antibodies used were rabbit anti-TCTP (1:2,000; Abcam), rabbit anti-S100 (1:400; clone Z0311, Dako), and mouse anti-Ki-67 (1:100; clone M7240, Dako). Two independent investigators evaluated all slides. TCTP expression was scored according to staining intensity (0, faint; 1, weak; 2, moderate; 3, strong).
Vectors
To obtain TCTP cDNA, total RNA was extracted from normal HSCs using the Qiagen RNeasy minikit, and reverse transcription of first-strand cDNA was performed with SuperScript II reverse transcriptase (Invitrogen) using the total RNA as a template. The forward and reverse primers were 5′-AGATCTATGATTATCTACCGGGACCTC-3′ and 5′-AAGCTTACATTTTTCCATTTCTAAACCATCC-3′, respectively. RT-PCR was performed using an Applied Biosystems 9700 thermal cycler, as follows: 55 °C for 30 min and 94 °C for 2 min; 35 cycles of 94 °C for 15 s, 55 °C for 30 s, and 72 °C for 1 min; and final extension at 72 °C for 10 min. The PCR product was cloned into the pGEM-T easy vector and sequenced. The cDNA was cloned into the pIRES-EGFP vector (Clontech), and the constructed TCTP overexpression vector was used for the transfection of cultured cells. The mammalian expression plasmid for NF1-GRD (pcDNA3-FLAG-GRD) was prepared as described previously (4).
Transfection of Cultured Cells with siRNA and Expression Vectors
Transfection of PC12, S16, IMS32, and neurofibroma-derived primary cells with siRNA was performed using Lipofectamine 2000 (Invitrogen) according to the manufacturer's protocol. Target sequences for NF1 and TCTP siRNA were designed as follows. 21-oligonucleotide siRNA duplexes were designed as recommended elsewhere (5, 7) and synthesized by Gene Link to target the NF1 sequences 5′-249CAAGGAGTGTCTGATCAACTT-3′ (for NF1 siRNA 1 and for the Cy3-labeled NF1 siRNA) and 5′-611GGTTACAGGAGTTGACTGTTT-3′ (for NF1 siRNA 2), and the TCTP sequences 5′-212AACCATCATCACTTACAAGTT-3′ (for TCTP siRNA 1) and 5′-357AAGCACATCCTTGCTAATTTT-3′ (for TCTP siRNA 2). The silencer negative control siRNA 1 (Ambion) was used as a control siRNA. Transfection of sNF96.2 cells with siRNA or expression vectors was performed using the Neon Transfection System (Invitrogen) according to the manufacturer's protocol.
RT-PCR
Total RNA was extracted using the Qiagen RNeasy minikit, and reverse transcription of first-strand cDNA was performed with SuperScript II reverse transcriptase using the total RNA as a template. The forward and reverse primers for TCTP were 5′-ATGATTATCTACCGGGACCTC-3′ and 5′-TACATTTTTCCATTTCTAAACCATCC-3′, respectively. The forward and reverse primers for β-actin were 5′-GCGAGAAGATGACCCAGATC-3′ and 5′-CCAGTGGTACGGCCAGAGG-3′, respectively. A PCR mixture containing 2× reaction buffer, 2 μm forward and reverse primers, 500 pg of total RNA, and water was amplified using an Applied Biosystems 9700 thermal cycler. The RT-PCR was performed with the following thermal cycling parameters: 55 °C for 30 min and 94 °C for 2 min; 35 cycles of 94 °C for 15 s, 55 °C for 30 s, and 72 °C for 1 min; and final extension at 72 °C for 10 min. PCR products were resolved on a 2% (v/v) agarose gel and visualized using ethidium bromide under UV light. The band intensities were measured using ProGenesis Work Station version 2005 (PerkinElmer Life Sciences).
Immunoblotting
Cell lysate samples containing 20 μg of total protein were electrophoresed on SDS-polyacrylamide gels, transferred onto PVDF membranes by electroblotting, and subjected to immunoblotting with the indicated antibodies. Membranes were probed with different primary antibodies, followed by horseradish peroxidase-conjugated anti-mouse and anti-rabbit secondary antibodies (GE Healthcare). The images were visualized with ECL (GE Healthcare). The following primary antibodies were used: neurofibromin, tubulin, and p120GAP (Santa Cruz Biotechnology, Inc.); TCTP (Abcam); β-actin (Sigma); and phospho-ERK (Thr-202/Tyr-204), total ERK, phospho-AKT (Ser-473), total AKT, phospho-S6 (Ser-235/Ser-236), and total S6 (Cell Signaling). For quantitative analysis, the films were scanned using LabScan version 5.0 (GE Healthcare) under transparent mode at a resolution of 300 dots/inch. The band intensities were measured using ProGenesis Work Station version 2005.
Immunofluorescence Analysis
PC12 cells, sNF96.2 cells, and neurofibroma-derived primary cells were fixed with 4% paraformaldehyde in PBS for 15 min at room temperature and then permeabilized with 0.1% Triton X-100 in PBS on ice for 15 min. After washing with PBS, cells were incubated with primary antibodies diluted in PBS containing 5% bovine serum albumin, followed by anti-mouse or anti-rabbit Alexa Fluor 488-conjugated secondary antibodies (Molecular Probes/Invitrogen) for 60 min at room temperature. After cells were washed with PBS, analysis was performed with a 20 × 1.6 Olympus IX71 fluorescence microscope using Olympus DPController and DPManager software. For the staining of cellular F-actin and nuclei, cells were incubated for 10 min at room temperature with rhodamine-phalloidin (Invitrogen) and with 20 μg/ml Hoechst33342 (Invitrogen).
Measurement of Forward Scatter and the Sub-G1 Population
Cells were harvested, washed with PBS, and fixed with 70% ethanol at −20 °C overnight. The fixed cells were collected, and the forward scatter was measured using a FACSCalibur flow cytometer (BD Bioscience). For detection of the sub-G1 population, the fixed cells were treated with PBS containing 5 μg/ml propidium iodide and 5 μg/ml RNase A, and propidium iodide staining was measured using a FACSCalibur. The cells exhibiting less than 2n diploid DNA content were designated sub-G1 cells. The number of sub-G1 cells was expressed as a percentage of the total number of cells present.
Time Lapse Video Analysis
Cells were cultured on a 6-well glass-bottom plate (Iwaki). The plate was maintained at 37 °C under 5% CO2 in a chamber set under the camera during observation. Images were obtained using a ×20 UPlan SApo objective (Olympus IX81). The camera, shutters, and filter wheel were controlled by MetaMorph imaging software (Molecular Devices), and the images were collected every 10 min with an exposure time of 50 ms.
Statistical Analysis
All values are expressed as the mean with the ± S.D. or S.E., and significant differences between groups were assessed using Student's t test.
RESULTS
Identification of the Novel NF1-associated Protein TCTP in Neurofibromin-deficient PC12 Cells Stimulated with NGF Using an Integrated Proteomic Analysis
As we reported previously (6), to identify novel proteins associated with NF1 pathology, neurofibromin-deficient PC12 cells were established as an NF1 pathological model using NF1 siRNA (5) and subjected to proteomic differential expression analyses. TCTP was specifically up-regulated, as shown by both isobaric tags for relative and absolute quantification (iTRAQ; Fig. 1, A and B) and a two-dimensional difference in gel electrophoresis analysis (Fig. 1, C and D). We had already identified TCTP as a novel NGF-inducible protein related to neuronal differentiation and survival in PC12 cells (7). However, because no studies have been published on its role in NF1 pathology, this potential relationship was tested using NF1 gene knockdown (NF1-KD) in PC12 cells. Neurofibromin depletion caused significant up-regulation of TCTP (Fig. 2A), which was further evaluated by Cy3-conjugated NF1 siRNA treatment and immunocytochemistry. Cy3-positive cells (Fig. 2B, red) showed specific inhibition of neurite outgrowth even after NGF stimulation. Furthermore, TCTP expression (Fig. 2B, green) was higher in Cy3-positive cells than in Cy3-negative cells (Fig. 2B). These results clearly show that TCTP expression is up-regulated in NF1-KD PC12 cells and is associated with a specific inhibition of neurite outgrowth. The TCTP knockdown with siRNA in NF1-KD cells rescued the NGF-induced neurite outgrowth formation (Fig. 2, C and D). This led us to hypothesize that TCTP could be a reversion target for NF1 pathology.
FIGURE 1.

Quantitative time course analysis of TCTP expression in NF1-deficient PC12 cells stimulated with NGF by the integrated proteomics. A, overview of iTRAQ analysis. The cells were transfected with NF1 or control siRNA, cultured for 24 h, and then stimulated with NGF. Cell lysates were prepared at different time points, as indicated, and digested with trypsin. The tryptic peptides were labeled with 8-plex iTRAQ, and the iTRAQ method was applied. B, quantitative analysis of TCTP expression determined by iTRAQ. The ratios were calculated by the intensities of 8-plex iTRAQ ions obtained from spectra of TCTP-derived peptides. The intensities at 0 h (before NGF stimulation) in control cells were used as the standard (ratio = 1). Error bars, S.E. C, a representative image of a two-dimensional polyacrylamide gel of pH range 4–7 and a close-up view of TCTP protein spots (arrowheads). D, quantitative TCTP expression data from two-dimensional difference in gel electrophoresis analysis. The data show the average ratios calculated using the intensities of four TCTP protein spots. For all four spots, TCTP was significantly up-regulated by NF1 knockdown (6). The mean of the intensities at 0 h (before NGF stimulation) in control cells was used as the standard (ratio = 1). Error bars, S.E. The materials and methods were described in our previous report (6).
FIGURE 2.

TCTP is up-regulated in NF1-deficient PC12 cells stimulated with NGF. PC12 cells were transfected with NF1 or control siRNA for 24 h and then treated with NGF for 48 h. A, cell lysates were analyzed by immunoblot to assess TCTP expression. Actin expression was assessed to ensure equal loading. The representative images reflect three independent experiments. C, control siRNA; NF1, NF1 siRNA-1. The TCTP expression levels in control siRNA-treated versus NF1 siRNA-treated PC12 cells from three separate experiments are shown in the histogram. The average ratio of the expression level in control siRNA-treated cells was used as the standard (ratio = 1). Error bars, S.D. *, p < 0.01 versus control siRNA treatment (Student's t test). B, cells treated with Cy3-labeled NF1 siRNA were fixed and exposed to antibodies directed against the indicated proteins, followed by detection with Alexa Fluor 488-labeled secondary antibodies. The differential interference contrast (DIC), Cy3, DIC + Cy3, DIC + TCTP, TCTP + Cy3, and merged images in the same field of PC12 cells are shown. C and D, knockdown of up-regulated TCTP recovered neurite formation in NF1-deficient PC12 cells stimulated with NGF. Cells were transfected with Cy3-labeled NF1 siRNA or Cy3-labeled control siRNA and one of two TCTP siRNAs for 24 h and then treated with NGF for 72 h. C, cell lysates were analyzed by immunoblot to assess the knockdown of TCTP expression. D, the merged DIC and Cy3 images show the phenotypes of PC12 cells treated with the indicated siRNAs. Yellow arrows, Cy3-positive cells; white arrows, neurites in NF1-deficient PC12 cells treated with TCTP siRNAs.
TCTP Is Up-regulated in Response to Growth Factor Stimulation in Neurofibromin-deficient Schwann Cells
NF1-associated neurofibromas arise in Schwann cells after loss of NF1 function (12). Neurofibromin was knocked down with siRNA in two Schwann cell lines, rat S16 cells and mouse IMS32 cells. The efficiency of NF1 knockdown was 92.8% for siRNA NF1 (Fig. 3C). Cells in which NF1 was knocked down proliferated faster and appeared to have a wider morphology (Fig. 3, A and B), and TCTP expression and ERK phosphorylation were up-regulated (Fig. 3C). Because TCTP expression has been shown to be up-regulated by growth factors, such as NGF in PC12 cells (7), we tested whether it also responds to mitogenic factors in Schwann cells in a manner influenced by NF1 gene deficiency. TCTP expression was indeed markedly increased in a time-dependent manner in response to PDGF in NF1-KD S16 cells (Fig. 3D) and also in response to serum stimulation in NF1-KD IMS32 cells (data not shown). Next, the involvement of Ras-MAPK and PI3K-AKT signaling in the up-regulation of TCTP was examined because these pathways are regulated by the Ras-GAP function of neurofibromin. In NF1-KD S16 cells, in response to PDGF, ERK, and AKT, phosphorylation levels increased (Fig. 3D). TCTP was also up-regulated, but this was markedly suppressed when MAPK or PI3K-AKT signaling was inhibited using the MEK inhibitor U0126 or the PI3K inhibitor LY294002, respectively (Fig. 3E). Similar results were obtained by stimulating S16 cells with insulin (Fig. 3F) and IMS32 cells with PDGF (data not shown). Whereas PDGF stimulation activated both MAPK and PI3K-AKT signaling (Fig. 3, D and E), insulin preferentially activated PI3K-AKT signaling (Fig. 3F). Despite the differences in the level of the activation of Ras-MAPK and Ras-PI3K signaling, inhibitors of MEK or PI3K equally suppressed TCTP expression. Therefore, both ERK and AKT activation seem to contribute equally to TCTP up-regulation. Collectively, these data suggest that the up-regulation of TCTP was enhanced by the activation of MAPK and PI3K-AKT in response to NF1 deficiency.
FIGURE 3.

TCTP is up-regulated in response to growth factor stimulation in NF1-deficient cultured Schwann cells. A–C, rat S16 Schwann cells were transfected with NF1 or control siRNA and then cultured for 48 h. A, images of cells transfected with control siRNA and NF1 siRNA 1. The arrow shows the representative phenotype of S16 cells treated with NF1 siRNA. B, the viability of cells transfected with NF1 siRNA 1 was evaluated. The average viability of cells transfected with control siRNA was used as the standard (100%). The data are expressed as the means and S.D. (error bars) of three independent experiments (n = 3). *, p < 0.01 versus control siRNA treatment (Student's t test). C, cell lysates were analyzed by immunoblot to assess neurofibromin and TCTP expression levels and ERK phosphorylation status. Actin and p120GAP expression were assessed as loading controls for TCTP and neurofibromin expression, respectively. C, control siRNA; NF1, NF1 siRNA 1. D, rat S16 Schwann cells were transfected with NF1 or control siRNA and then cultured for 48 h. The cells were serum-starved for 16 h and stimulated with 20 ng/ml PDGF. Cell lysates were prepared at different time points, as indicated, and analyzed by immunoblot for TCTP expression and ERK and AKT phosphorylation status. The upper and lower arrows indicate the phosphorylated forms of p44 and p42 ERK, respectively. C, control siRNA; NF1, NF1 siRNA 1. E and F, rat S16 Schwann cells were transfected with NF1 or control siRNA and then cultured for 48 h. The cells were serum-starved for 16 h and then treated with the MEK inhibitor U0126 (U; 20 μm) or the PI3K inhibitor LY294002 (LY; 30 μm) for 30 min prior to stimulation with 20 ng/ml PDGF (E) and 200 nm insulin (F). Cell lysates were prepared at 6 h after PDGF or insulin stimulation, as indicated, and analyzed by immunoblot to assess TCTP expression. The representative images reflect three reproducible experiments. The black upper and lower arrowheads indicate the phosphorylated forms of p44 and p42 ERK, respectively. The white upper and lower arrowheads indicate the inhibition of the phosphorylation of p44 and p42 ERK by U0126. C, control siRNA; NF1, NF1 siRNA 1. The asterisk indicates nonspecific bands.
Next, two types of primary cultured cells, fibroblast-like and spindle-like, were isolated from the neurofibroma tissue of an NF1 patient. Their levels of neurofibromin were equivalent but low compared with levels in fibroblasts from non-NF1 human tissue (Fig. 4A). However, the induction of ERK in response to serum starvation in the spindle-like cells was clearly higher than in the fibroblast-like cells (Fig. 4B), suggesting that the spindle-like cells, which are the core constituents of neurofibroma, have a distinct MAPK activation mechanism, as was shown in a previous study (13). The TCTP expression of the spindle-like cells was also much higher than that of the fibroblast-like cells (Fig. 4, C and D). These results show that TCTP expression is specifically up-regulated in neurofibroma spindle-like cells.
FIGURE 4.
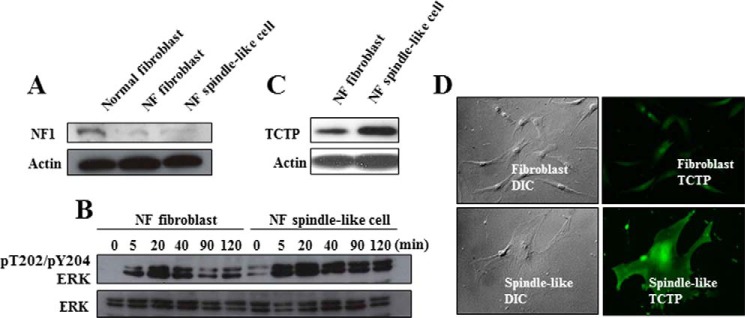
TCTP is up-regulated in neurofibroma-derived primary spindle-like tumor cells. Fibroblast-like cells and spindle-like cells were isolated from dermal neurofibroma. A, the expression level of neurofibromin was assessed by immunoblot analysis. Lysate from primary fibroblasts from the abdominal dermis of a non-NF1 patient was used as a positive control. B, the fibroblast-like and spindle-like cells were serum-starved for 16 h and then stimulated with 1% FBS. The ERK phosphorylation status was analyzed by immunoblot. C and D, TCTP expression in the two cell types was analyzed by immunoblotting and immunocytochemistry.
TCTP Expression Correlates with the Malignant Potential of NF1-associated Tumors
Immunohistochemistry was used to survey TCTP levels and patterns in various types of NF1-associated neurofibroma tissue, including dermal and plexiform neurofibroma and MPNST. Dermal and plexiform neurofibromas are benign tumors. However, dermal neurofibromas have no malignant potential, whereas 10% of plexiform neurofibromas have the potential for malignant transformation to MPNST, which is an aggressive sarcoma with a poor prognosis (12). The expression of TCTP was markedly higher in plexiform than in dermal neurofibroma and strongest in NF1-associated MPNST (Fig. 5A). TCTP expression was faint or weak in all dermal neurofibromas (n = 8), weak or moderate in plexiform neurofibroma (n = 4), and moderate or strong in NF1-associated MPNST (n = 3) (Fig. 5B). Moreover, the levels of TCTP varied in sporadic MPNST (n = 5) (Fig. 5B). Notably, TCTP expression correlated with the Ki-67 index in NF1-associated and sporadic MPNST cases (Fig. 5B). These results reveal that up-regulation of TCTP is associated with the malignancy of NF1-associated neurofibromas and MPNST (both NF1-associated and sporadic) and suggest that TCTP may be a useful diagnostic marker for various types of neurofibroma.
FIGURE 5.
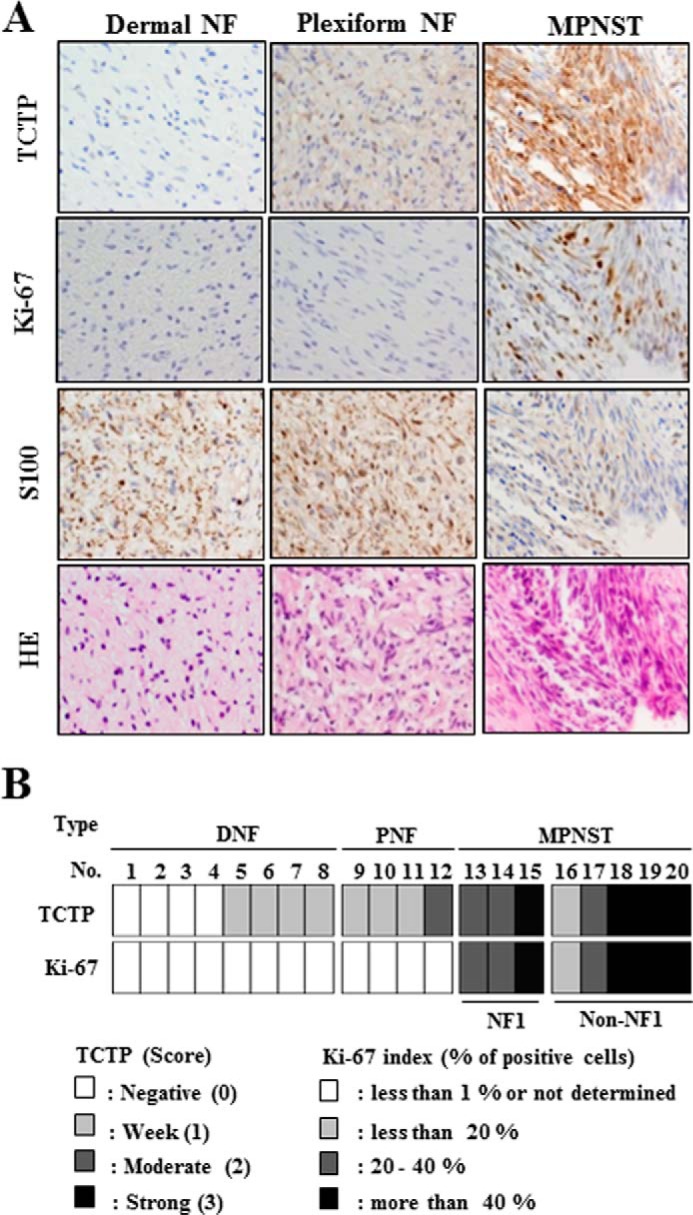
TCTP expression correlates with the malignancy of NF1-associated neurofibromas. A, representative images show the H&E staining and S100, TCTP, and Ki-67 immunostaining of NF1-associated dermal neurofibroma, plexiform neurofibroma, and MPNST at ×400 magnification. The dermal neurofibroma, plexiform neurofibroma, and MPNST tissues correspond to tissue sample numbers 1, 10, and 15 in B. B, immunohistochemical analysis in various types of neurofibroma. DNF, dermal neurofibroma; PNF, plexiform neurofibroma. TCTP expression was scored according to staining intensity (0, faint; 1, weak; 2, moderate; 3, strong).
mTOR Signaling Controls TCTP Expression in MPNST Cells
Because TCTP was strongly expressed in MPNST tissue, the mechanism of its induction in MPNST cells was examined. TCTP protein but not mRNA was down-regulated, and MAPK and AKT-mTOR signaling were suppressed in response to overexpression of NF1-GRD in NF1-deficient MPNST (sNF96.2) cells (Fig. 6, A and B). These results suggest that the cellular Ras-GAP activity of NF1 down-regulates TCTP protein expression. The effect of MAPK and PI3K inhibitors on TCTP expression was next examined. Treatment with the MEK inhibitor U0126 or the PI3K-AKT signaling inhibitor LY294002 markedly down-regulated TCTP protein but not mRNA expression (Fig. 6, C and D) and inhibited the phosphorylation of S6 downstream of mTORC1 (Fig. 6, A and C). The effect of mTOR activity on the expression of TCTP was next evaluated. TCTP was down-regulated at the protein but not the mRNA level by treatment with the mTOR inhibitor rapamycin (Fig. 6, E and F). TCTP was up-regulated by treatment with the proteasome inhibitor MG132 (Fig. 6G), suggesting that the stability of cellular TCTP is regulated by the proteasomal machinery, suggesting that the stability of cellular TCTP is regulated by the proteasomal machinery. However, even when the proteasome was inhibited by treatment with MG132, TCTP was down-regulated by rapamycin (Fig. 6G), strongly suggesting that the TCTP protein level is controlled by mTOR-dependent translational regulation but not by mRNA or protein stability. These results suggest that mTOR promotes TCTP translation/synthesis in NF1-deficient MPNST cells.
FIGURE 6.

Suppression of mTOR signaling down-regulates TCTP expression in MPNST cells. A and B, overexpression of NF1-GRD down-regulates TCTP expression at the protein level in an MPNST cell line. A, immunoblot images taken after treatment with NF1-GRD for 24 h. Down-regulation of TCTP and phosphorylated ERK, AKT, and ribosomal S6 protein was observed. B, RT-PCR analysis reveals that TCTP mRNA was not down-regulated in sNF96.2 cells transfected with the NF1-GRD vector. C and D, sNF96.2 cells were cultured for 16 h and then treated with the MEK inhibitor U0126 (20 μm) or the PI3K inhibitor LY294002 (10 μm). At 12 h after inhibitor treatment, cell lysates were prepared and analyzed by immunoblot to assess TCTP expression. The representative images reflect three reproducible experiments. D, RT-PCR analysis reveals that TCTP mRNA was not down-regulated in sNF96.2 cells treated with U0126 or LY294002. E, sNF96.2 cells were cultured for 24 h and then treated with 100 nm rapamycin. Cell lysates were prepared at different time points, as indicated, and analyzed by immunoblot to assess TCTP expression. F, RT-PCR analysis reveals that TCTP mRNA was not down-regulated in sNF96.2 cells treated with 100 nm rapamycin. G, down-regulation of TCTP by suppression of mTOR signaling is not due to proteasomal degradation. sNF96.2 cells were cultured for 24 h and then treated with 100 nm rapamycin and 1 μm MG132 for 8 h. Cell lysates were analyzed by immunoblot to assess TCTP expression.
The Role of TCTP in NF1-associated Tumors
TCTP was discovered in Ehrlich ascites tumor cells (14, 15) and identified as a target for tumor reversion (9). In NF1-KD PC12 cells, the inhibition of NGF-induced neurite outgrowth formation was rescued by TCTP knockdown (Fig. 2, C and D), prompting us to hypothesize that TCTP could be a reversion target for NF1-associated tumors. To test this hypothesis, TCTP function was studied in neurofibroma-derived cells and MPNST cells from NF1 patients using TCTP siRNA or a TCTP overexpression vector, and cellular phenotypic changes were noted. Knockdown of TCTP led to marked suppression of cell growth in sNF96.2 MPNST cells, whereas TCTP overexpression had the opposite effect (Fig. 7, A and B). Because TCTP knockdown did not affect the growth of cultured Schwann cells from normal nerve tissue, such as S16 and IMS32 cells (data not shown), it appears to be specific for neurofibroma and MPNST cells. MPNST cells have wider dimensions than normal Schwann cells. However, after knockdown of TCTP, cells were observed to exhibit marked suppression of cellular dimension and alterations in the actin cytoskeleton (Fig. 7C and supplemental Movies S1 and S2). sNF96.2 cells treated with TCTP siRNA were also smaller, as shown by measurement of the forward scatter (FSC) signal by flow cytometry (Fig. 7D). Primary cultured spindle-like cells from neurofibroma tissue were also observed to exhibit marked suppression of cellular viability and dimension after TCTP knockdown (data not shown). Next, the function of TCTP was examined in MPNST cells. Because the mTOR pathway controls cell size in normal and tumor tissue (16), is activated in neurofibroma (17), and is activated by TCTP in Drosophila (18), the activation of mTOR by TCTP in NF1 tumor cells was examined. Down- or up-regulation of TCTP using siRNA or an overexpression vector led to a decrease or increase, respectively, in the phosphorylation of ribosomal protein S6, which lies downstream of mTOR (Fig. 7, E and F). These results indicate that TCTP positively controls the viability, size, and mTOR activity of NF1 tumor cells. Taken together with the results in Fig. 5, it is likely that a positive feedback loop between TCTP and mTOR contributes to NF1-associated tumor formation.
FIGURE 7.

TCTP positively regulates viability and mTOR activity in MPNST cells. A and C–E, knockdown of TCTP using siRNA suppresses the viability of an MPNST cell line. sNF96.2 MPNST cells were transfected with TCTP or control siRNA. A, the viability of cells transfected with TCTP siRNA was evaluated by a CCK-8 assay. The average viability of cells transfected with control siRNA for 24 h was used as the standard (100%). *, p < 0.05; ***, p < 0.001 versus control siRNA treatment (Student's t test). C, sNF96.2 cells were transfected with TCTP siRNA and cultured for 72 h. The cells were fixed, permeabilized, and immunostained with a TCTP antibody. Then F-actin and cell nuclei were stained with rhodamine-phalloidin and Hoechst 33342, respectively. Bars, 20 μm. D, measurement of the forward scatter (FSC) of sNF96.2 cells transfected with TCTP or control siRNA. The blue and red lines indicate the mean forward scatter in the M1 region in control siRNA-treated cells and in TCTP siRNA-treated cells, respectively (786.06 in control siRNA-treated cells and 744.60 in TCTP siRNA-treated cells) (left). The data in the bar graph represent the mean and S.D. (error bars) of measurements from three independent experiments (n = 3). *, p < 0.01 versus control siRNA treatment (Student's t test). E, immunoblot analysis after treatment with TCTP siRNA for 24 h. Down-regulation of TCTP was confirmed, and phosphorylated ribosomal S6 protein was also found to be down-regulated. B and F, overexpression of TCTP enhanced the viability of the MPNST cell line (B). The viability of cells transfected with the TCTP overexpression vector was evaluated by CCK-8 assay. The average viability of cells transfected with the mock vector for 24 h was used as the standard (100%). F, immunoblot analysis after treatment with the TCTP overexpression vector for 48 h. Up-regulation of TCTP was confirmed, and phosphorylated ribosomal S6 protein was found to be up-regulated.
The Use of Artesunate for the Therapy of NF1-associated Tumors
The use of artesunate, a derivative of artemisinin, which forms adducts with TCTP (19), was tested as a therapy for NF1-associated neurofibromas. Artesunate down-regulated TCTP protein in sNF96.2 (MPNST) cells, and this was rescued by treatment with the proteasome inhibitor MG132 (Fig. 8A), indicating that cellular TCTP had been degraded by association with artesunate. Artesunate suppressed the viability of sNF96.2 cells more effectively than human primary Schwann cells and IMS32 cells (Fig. 8B) (IC50: sNF96.2 cells, 8.0 μg/ml; human primary Schwann cells, 30.1 μg/ml; IMS32 cells, 20.2 μg/ml). Next, the relationship between TCTP expression levels and the anticancer activity of artesunate was assessed. The knockdown or overexpression of TCTP increased or decreased, respectively, the artesunate sensitivity of sNF96.2 cells (Fig. 8, C and D) (decreases in viability in cells treated with 5 μg/ml artesunate: control siRNA, 30.1%; TCTP siRNA, 52.1%; mock vector, 39.8%; and TCTP overexpression vector, 31.5%; decreases in viability in cells treated with 10 μg/ml artesunate: control siRNA, 68.7%; TCTP siRNA, 90.4%; mock vector, 74.1%; and TCTP overexpression vector, 70.9%). Sub-G1 analyses also showed that the knockdown of TCTP increased the cytotoxicity of artesunate on sNF96.2 cells (Fig. 8E) (sub-G1 population: control siRNA, 48.2%; TCTP siRNA, 62.7%, in cells treated with 10 μg/ml artesunate). By contrast, knockdown of TCTP did not affect the sensitivity of IMS32 cells to artesunate (data not shown). These results suggest that artesunate is cytotoxic to MPNST cells, an effect that is attenuated or enhanced, respectively, by up-regulation or down-regulation of TCTP. Collectively, these results suggest that artesunate could be useful for the therapy of neurofibromas and that its anti-tumor activity could be enhanced by suppressing TCTP. Because rapamycin also down-regulates TCTP (Fig. 6E), we hypothesized that the use of artesunate in combination with rapamycin would enhance the cytotoxicity of artesunate on MPNST cells. Indeed, treatment with both artesunate and rapamycin had a greater effect on sNF96.2 cell viability than treatment with either agent alone (Fig. 8F) (mean cell viability: 1 μg/ml artesunate, 76.46%; 10 μg/ml artesunate, 26.84%; 0.1 nm rapamycin, 68.10%; 1 nm rapamycin, 38.99%; 1 μg/ml artesunate + 0.1 nm rapamycin, 54.94%; 10 μg/ml artesunate + 1 nm rapamycin, 13.92%). These results suggest that the down-regulation of TCTP using combined treatment with artesunate and rapamycin could be an effective strategy for the therapy of MPNSTs.
FIGURE 8.

Treatment with artesunate for the induction of MPNST cell death. A, immunoblot analysis after treatment with artesunate and proteasomal inhibitor MG132. The sNF96.2 cells were cultured for 24 h and then treated with artesunate (0, 5, or 10 μg/ml) with/without MG132 (1 μm) for 48 h. Cell lysates were prepared and analyzed by immunoblot to assess TCTP expression. B, comparison of viability of sNF96.2 and human and mouse normal Schwann cells (HSC and IMS32) treated with artesunate. Cell viability was evaluated by a CCK-8 assay. The average viability of cells treated with DMSO was used as the standard (100%). The data are expressed as the mean and S.D. (error bars) of four independent experiments (n = 4). C and D, evaluation of viability of TCTP-depleted or -overexpressing MPNST cells treated with artesunate. sNF96.2 cells were transfected with TCTP siRNA (C) or the TCTP overexpression vector (D) for 24 h and then treated with artesunate for 48 h. The average viability of DMSO-treated cells transfected with control siRNA (C) or the mock expression vector (D) was used as the standard (100%). The data are expressed as the mean and S.D. of four independent experiments (n = 4). The decreases in viability in response to artesunate are indicated (control siRNA, 30.1%; TCTP siRNA, 52.1%; mock vector, 39.8%; and TCTP vector, 31.5% in cells treated with 5 μg/ml artesunate; control siRNA, 68.7%; TCTP siRNA, 90.4%; mock vector, 74.1%; and TCTP vector, 70.9% in cells treated with 10 μg/ml artesunate). E, measurement of the sub-G1 population in TCTP-depleted MPNST cells treated with artesunate. sNF96.2 cells were transfected with TCTP siRNA and then treated with artesunate for 48 h. Sub-G1 cells were quantified by flow cytometry. The data are expressed as the means and S.D. of two independent experiments (n = 2). F, evaluation of the viability of MPNST cells treated with artesunate in combination with rapamycin. sNF96.2 cells were cultured for 24 h and then treated with artesunate (1 and 10 μg/ml), rapamycin (0.1 and 1 nm), 1 μg/ml artesunate plus 0.1 nm rapamycin, or 10 μg/ml artesunate plus 1 nm rapamycin for 48 h. The data are expressed as the means and S.D. of four independent experiments (n = 4). *, p < 0.01 versus control siRNA treatment (Student's t test).
DISCUSSION
In this study, we identified a novel NF1-associated protein, TCTP, using integrated proteomics. We observed that TCTP was up-regulated in neurofibromin-deficient Schwann cells via deregulated Ras-MAPK and PI3K-AKT signaling in response to growth factors. The expression of TCTP correlated with the malignancy of NF1-associated tumors. In NF1-deficient MPNST cells, TCTP expression was translationally controlled by mTOR signaling, whereas TCTP positively controlled mTOR activity, suggesting that a positive feedback loop between TCTP and mTOR contributes to NF1-associated tumor formation. The inhibition of TCTP also suppressed the viability of MPNST and neurofibroma-derived cells. Our findings suggest the potential for TCTP as a diagnostic biomarker and therapeutic target for neurofibromas and MPNSTs.
TCTP was discovered in Ehrlich ascites tumor cells (14, 15) and was found to control the release of histamine (20). Highly conserved across species, it regulates cytoskeletal proteins, such as tubulin (21, 22), and inhibits apoptosis by interacting with the Bcl2 family (23–26). Although TCTP is known as a multifunctional protein, a great deal of research has focused on TCTP as a positive regulator of protein synthesis via interactions with eEF1A and eEF1Bβ (27) and/or as a GDP-GTP exchange factor for Rheb, which positively regulates the mTORC1 pathway (18). We previously reported that TCTP is an NGF-inducible protein that regulates neurite outgrowth and apoptosis in differentiating PC12 cells (7). Here, we report the up-regulation of TCTP in neurofibromin-deficient PC12 cells and Schwann cells and its regulation of cellular viability. Interestingly, our proteomic data also revealed that eEF1A and eEF1Bβ were up-regulated in neurofibromin-deficient PC12 cells after NGF stimulation (6). Because major components of the translational machinery are frequently up-regulated in human tumors, including neurofibromatosis-associated tumors (17), it is reasonable to assume that the up-regulation of both TCTP and eEF1A/Bβ contributes to the hyperactivation of protein synthesis in neurofibromas.
Growth factors induced significant up-regulation of TCTP, especially in NF1-deficient Schwann cells, via Ras-MAPK and PI3K/AKT signaling (Fig. 3). TCTP expression was also specifically up-regulated in neurofibroma spindle-like cells (Fig. 4, C and D). These data indicate that NF1 depletion leads to TCTP up-regulation in Schwann cells via receptor tyrosine kinase-Ras signaling. Notably, aberrant activation of upstream molecules of Ras, such as ERBB2, c-Met, hepatocyte growth factor, EGF receptor, and PDGF receptor, were found in NF1-associated neurofibromas (12). Neurofibroma spindle-like cells may utilize a specific mechanism for the activation of Ras-MAPK signaling, distinct from that of NF1 fibroblasts (Fig. 4B). The specific activation of Ras signaling and the depletion of NF1 could contribute to the up-regulation of TCTP in neurofibroma spindle-like cells.
Importantly, immunohistochemical analyses of NF1-associated neurofibromas revealed that TCTP expression correlates with tumor malignancy (Fig. 5), which suggests that TCTP could be a prognostic marker for NF1-associated tumors. We also observed variable expression of TCTP in sporadic MPNST, which correlated with the Ki-67 index (Fig. 5). These results indicate that TCTP expression levels correlate with tumor malignancy not only in NF1-associated neurofibromas but also in sporadic MPNST. In another study, somatic NF1 mutations were found in 41% of sporadic MPNSTs (28). The varied TCTP expression levels in sporadic MPNSTs may therefore reflect the heterogeneity of NF1 mutations.
The weakness of TCTP staining in many dermal neurofibromas (Fig. 5) suggests that the specific activation of receptor tyrosine kinase-Ras signaling in dermal neurofibroma may be lower than in plexiform neurofibroma and MPNSTs. Although TCTP may have a potential as a malignancy marker in neurofibroma, questions remain regarding the biological basis for the differing malignant potentials of neurofibroma subtypes and the nature of the growth factor-induced signaling events affecting TCTP.
Because our results clearly showed that TCTP expression correlated with the malignancy of neurofibromas and MPNSTs, we addressed the mechanism through which TCTP was up-regulated in MPNST cells. TCTP protein but not mRNA expression was down-regulated by NF1-GRD and MAPK/PI3K inhibitors, which correlated with suppression of mTOR signaling (Fig. 6, A–D). These results suggested that mTOR regulates TCTP expression at the translational level. Previous studies have shown that some mRNAs translationally regulated by mTOR signaling, mostly those involved in protein synthesis, contain a 5′-terminal oligopyrimidine region (29). TCTP mRNA also contains a putative 5′-terminal oligopyrimidine, as was shown in a global profiling study of ribosomes associated with mTORC1 (30, 31). Indeed, TCTP was down-regulated at the protein level but not at the mRNA level in MPNST cells after they were treated with rapamycin (Fig. 6, E and F), suggesting that the mTOR signaling up-regulates TCTP protein translation but not mRNA transcription.
The role of TCTP as a biological target for the treatment of NF1-associated tumors was also investigated. TCTP was inhibited or activated using siRNA or an overexpression vector, which increased or decreased the viability, size, and mTOR activity of NF1-associated tumor cells (Fig. 7). It has been reported that TCTP has guanine nucleotide exchange factor-like activity and facilitates the exchange of GDP-Rheb (the inactive form) to GTP-Rheb (the active form), which up-regulates mTOR signaling in vitro (18). It has also been reported that TCTP depletion leads to the down-regulation of mTOR/S6K/S6 signaling in Drosophila (18), in diabetic glomeruli and cultured podocytes (32), and in mouse pancreatic beta cells (33), consistent with our observations. These previous reports support our finding that TCTP positively regulates mTOR signaling in MPNST cells, although the precise mechanism remains under investigation.
Here, we demonstrate the specific mechanism of NF1-associated tumor activation caused by the TCTP-mTOR activation loop (i.e. mTOR up-regulates TCTP translation, and TCTP activates mTOR signaling). These observations suggest that the positive feedback loop between TCTP induction and mTOR activation is a characteristic of NF1-associated tumors and may promote tumorigenesis (Fig. 9). These findings are consistent with a promising recent study on the therapy of NF1-associated neurofibromas using rapamycin (34), an inhibitor of mTOR activation, which has been postulated as a downstream target of TCTP (18), although the mechanism has not been fully clarified.
FIGURE 9.
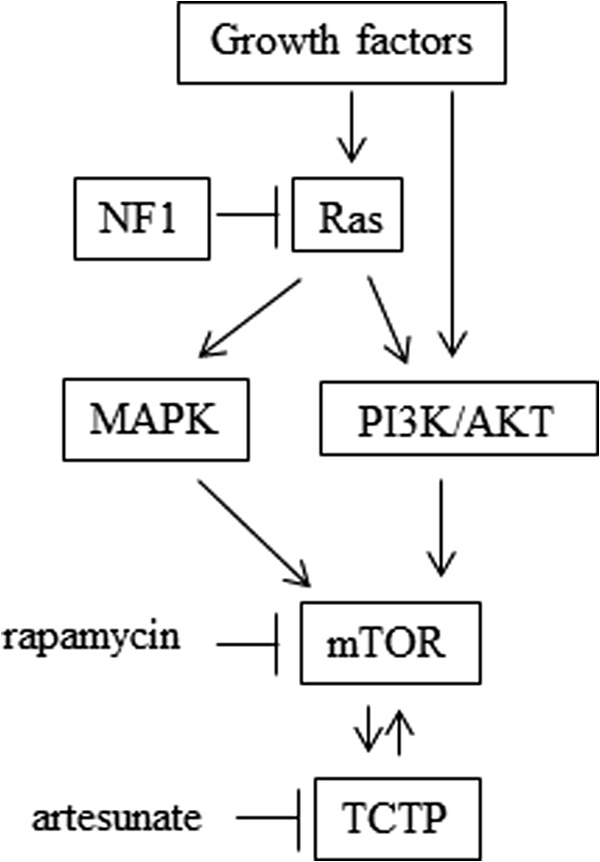
The possible mechanism of TCTP induction and mTOR activation in NF1-associated tumors. In NF1-deficient MPNST cells or tissues, up-regulation of the TCTP protein was observed (Fig. 5), whereas when NF1-GRD was overexpressed to compensate for NF1 RAS-GAP function in the NF1-deficient MPNST cells, TCTP expression was down-regulated at the protein level but not at the mRNA level (Fig. 6, A and B). TCTP protein (but not mRNA) was also down-regulated by MAPK/PI3K inhibitors (Fig. 6, C and D) as well as by the mTOR inhibitor rapamycin (Fig. 6, E and F). Importantly, mTOR inhibition seemed to down-regulate TCTP translation in MPNST cells, because rapamycin had no effect on the expression of TCTP mRNA but down-regulated TCTP protein (Fig. 6, E and F). This effect may not be mediated by proteasomal degradation of TCTP (Fig. 6G). Conversely, TCTP knockdown suppressed mTOR/S6K/S6 signaling (Fig. 7E), which is activated by overexpression of TCTP (Fig. 7F). Taken together, these results indicate a positive feedback loop between TCTP induction and mTOR activation caused by NF1 deficiency in NF1-associated tumors. Therefore, combinational use of the TCTP inhibitor artesunate, which significantly degrades TCTP protein (Fig. 8A), and the mTOR inhibitor rapamycin, which down-regulates TCTP translation (Fig. 6, E–G), could be effective at inhibiting the proliferation of NF1-associated tumors (Fig. 8F).
As a novel strategy for the therapy of neurofibromas via TCTP targeting, we used artesunate, a semisynthetic derivative of the antimalarial drug artemisinin, a natural compound isolated from Artemisia annua TCTP was identified in malaria plasmodia as the most abundant protein bound to an artemisinin derivative (dihydroartemisinin) in plasmodia-infected erythrocytes (19). Although neither the detailed mechanism of their interaction nor its effects on TCTP function have yet been clarified, it is thought that artemisinin derivatives bind to TCTP and alter its structural dynamics and function (19). It has also been reported that the active chemical moiety of artemisinins has an endoperoxide bridge, which is cleaved in the presence of ferrous iron by a Fenton-type reaction (35). This leads to the generation of reactive oxygen species, which may be regulated via TCTP binding in plasmodia (36). These drugs also exert potent anticancer activity in glioma (37) and lung cancer (38), but they have not been used to treat neurofibromas or MPNST. We found that treatment with artesunate down-regulated TCTP expression (Fig. 8A) and was more cytotoxic to MPNST cells than to Schwann cells derived from normal peripheral nerves (Fig. 8B). Because down-regulating TCTP reduced the viability of MPNST cells (Fig. 7), we expected that down-regulating TCTP by combinational treatment with rapamycin, an inhibitor of mTOR-dependent TCTP translation, and artesunate, which induces TCTP protein degradation, would have an increased effect on cell viability. Indeed, treatment with both artesunate and rapamycin induced sNF96.2 cell cytotoxicity more than treatment with artesunate or rapamycin alone (Fig. 8F). The combinatorial effect of artesunate and rapamycin on the viability of MPSNT cells may result from two mechanisms of TCTP reduction: 1) rapamycin can reduce mTOR-dependent TCTP translation, and 2) artesunate can reduce TCTP protein levels via proteasomal degradation. Thus, both inhibitors functionally cooperate to reduce TCTP expression and enhance MPNST cell cytotoxicity via the mTOR-TCTP positive feedback loop (Fig. 9).
Knockdown or overexpression of TCTP increased or decreased the artesunate sensitivity of sNF96.2 cells, respectively (Fig. 8, C and D). However, the knockdown of TCTP did not influence the viability or artesunate sensitivity of normal Schwann cells (data not shown). These results demonstrate that neurofibroma and MPNST tumor cells have a significant TCTP dependence, which can be attributed to the up-regulation of the TCTP-mTOR activation loop via NF1 deficiency (Fig. 9). This may explain why the reduction in cellular TCTP caused by combinational treatment using rapamycin, an inhibitor of mTOR-dependent TCTP translation, and artesunate, an effective agent of TCTP protein degradation, substantially suppresses the growth of NF1 tumor cells.
NF1-associated tumors are frequently observed in NF1 patients, and they are not amenable to surgical resection. Therefore, information concerning the molecular pathogenesis of NF1 and the identification of biomarkers or therapeutic targets for these tumors has been keenly anticipated. This study used integrated proteomics applied to models of NF1 pathology, including NF1-deficient neural cells, to shed light on the molecular mechanisms of NF1 pathogenesis. Our findings, which indicate the functional importance of the TCTP protein in the genesis and progression of NF1 tumors, suggest that agents targeting TCTP could represent an effective and novel therapeutic approach for NF1-associated tumors.
Supplementary Material
Acknowledgments
We thank the staff of the Department of Tumor Genetics and Biology at Kumamoto University, particularly T. Morikawa, A. Wilson, N. Tsubota, U. Midorikawa, A. Nambu-Niibori, M. Nagayama, and M. Nagai, for providing technical support. We also thank M. Morikawa, M. Shimono, C. Midorikawa, M. Nakamura, and K. Tanoue for secretarial support. We are also grateful to the staff of the Proteomic Analysis Core System at the General Research Core Laboratory, Kumamoto University Medical School.
This work was supported by grants from the Ministry of Health, Labor, and Welfare of Japan (to N. A.); by Grant-in-Aid for Scientific Research (B) 25293312 and 22390281 (to N. A.), Grant-in-Aid for Exploratory Research 25640068 (to N. A.), and Grant-in-Aid for Young Scientists (B) 24700981 and 26830097 (to D. K.) from the Ministry of Education, Culture, Sports, Science, and Technology (MEXT) of Japan/Japan Society for the Promotion of Science (JSPS); and by the Centers of Excellence Project B of Kumamoto University for proteomic research and education (to N. A.).

This article contains supplemental Movies S1 and S2.
- NF1
- neurofibromatosis type 1
- GAP
- GTPase-activating protein
- GRD
- GAP-related domain
- TCTP
- translationally controlled tumor protein
- MPNST
- malignant peripheral nerve sheath tumor
- HSC
- human Schwann cell
- CCK-8
- Cell Counting Kit-8
- mTOR
- mammalian target of rapamycin
- KD
- knockdown.
REFERENCES
- 1. Stephens K., Riccardi V. M., Rising M., Ng S., Green P., Collins F. S., Rediker K. S., Powers J. A., Parker C., Donis-Keller H. (1987) Linkage studies with chromosome 17 DNA markers in 45 neurofibromatosis 1 families. Genomics 1, 353–357 [DOI] [PubMed] [Google Scholar]
- 2. Cawthon R. M., Weiss R., Xu G. F., Viskochil D., Culver M., Stevens J., Robertson M., Dunn D., Gesteland R., O'Connell P. (1990) A major segment of the neurofibromatosis type 1 gene: cDNA sequence, genomic structure, and point mutations. Cell 62, 193–201 [DOI] [PubMed] [Google Scholar]
- 3. Costa R. M., Federov N. B., Kogan J. H., Murphy G. G., Stern J., Ohno M., Kucherlapati R., Jacks T., Silva A. J. (2002) Mechanism for the learning deficits in a mouse model of neurofibromatosis type 1. Nature 415, 526–530 [DOI] [PubMed] [Google Scholar]
- 4. Yunoue S., Tokuo H., Fukunaga K., Feng L., Ozawa T., Nishi T., Kikuchi A., Hattori S., Kuratsu J., Saya H., Araki N. (2003) Neurofibromatosis type I tumor suppressor neurofibromin regulates neuronal differentiation via its GTPase-activating protein function toward Ras. J. Biol. Chem. 278, 26958–26969 [DOI] [PubMed] [Google Scholar]
- 5. Patrakitkomjorn S., Kobayashi D., Morikawa T., Wilson M. M., Tsubota N., Irie A., Ozawa T., Aoki M., Arimura N., Kaibuchi K., Saya H., Araki N. (2008) Neurofibromatosis type 1 (NF1) tumor suppressor, neurofibromin, regulates the neuronal differentiation of PC12 cells via its associating protein, CRMP-2. J. Biol. Chem. 283, 9399–9413 [DOI] [PubMed] [Google Scholar]
- 6. Hirayama M., Kobayashi D., Mizuguchi S., Morikawa T., Nagayama M., Midorikawa U., Wilson M. M., Nambu A. N., Yoshizawa A. C., Kawano S., Araki N. (2013) Integrated proteomics identified novel activation of dynein IC2-GR-COX-1 signaling in neurofibromatosis type I (NF1) disease model cells. Mol. Cell Proteomics 12, 1377–1394 [DOI] [PMC free article] [PubMed] [Google Scholar]
- 7. Kobayashi D., Kumagai J., Morikawa T., Wilson-Morifuji M., Wilson A., Irie A., Araki N. (2009) An integrated approach of differential mass spectrometry and gene ontology analysis identified novel proteins regulating neuronal differentiation and survival. Mol. Cell Proteomics 8, 2350–2367 [DOI] [PMC free article] [PubMed] [Google Scholar]
- 8. Bommer U. A., Thiele B. J. (2004) The translationally controlled tumour protein (TCTP). Int. J. Biochem. Cell Biol. 36, 379–385 [DOI] [PubMed] [Google Scholar]
- 9. Tuynder M., Susini L., Prieur S., Besse S., Fiucci G., Amson R., Telerman A. (2002) Biological models and genes of tumor reversion: cellular reprogramming through tpt1/TCTP and SIAH-1. Proc. Natl. Acad. Sci. U.S.A. 99, 14976–14981 [DOI] [PMC free article] [PubMed] [Google Scholar]
- 10. Telerman A., Amson R. (2009) The molecular programme of tumour reversion: the steps beyond malignant transformation. Nat. Rev. Cancer 9, 206–216 [DOI] [PubMed] [Google Scholar]
- 11. Watabe K., Sakamoto T., Kawazoe Y., Michikawa M., Miyamoto K., Yamamura T., Saya H., Araki N. (2003) Tissue culture methods to study neurological disorders: establishment of immortalized Schwann cells from murine disease models. Neuropathology 23, 68–78 [DOI] [PubMed] [Google Scholar]
- 12. Carroll S. L., Ratner N. (2008) How does the Schwann cell lineage form tumors in NF1? Glia 56, 1590–1605 [DOI] [PMC free article] [PubMed] [Google Scholar]
- 13. Sherman L. S., Atit R., Rosenbaum T., Cox A. D., Ratner N. (2000) Single cell Ras-GTP analysis reveals altered Ras activity in a subpopulation of neurofibroma Schwann cells but not fibroblasts. J. Biol. Chem. 275, 30740–30745 [DOI] [PMC free article] [PubMed] [Google Scholar]
- 14. Yenofsky R., Bergmann I., Brawerman G. (1982) Messenger RNA species partially in a repressed state in mouse sarcoma ascites cells. Proc. Natl. Acad. Sci. U.S.A. 79, 5876–5880 [DOI] [PMC free article] [PubMed] [Google Scholar]
- 15. Böhm H., Benndorf R., Gaestel M., Gross B., Nürnberg P., Kraft R., Otto A., Bielka H. (1989) The growth-related protein P23 of the Ehrlich ascites tumor: translational control, cloning and primary structure. Biochem. Int. 19, 277–286 [PubMed] [Google Scholar]
- 16. Fingar D. C., Blenis J. (2004) Target of rapamycin (TOR): an integrator of nutrient and growth factor signals and coordinator of cell growth and cell cycle progression. Oncogene 23, 3151–3171 [DOI] [PubMed] [Google Scholar]
- 17. Dasgupta B., Yi Y., Chen D. Y., Weber J. D., Gutmann D. H. (2005) Proteomic analysis reveals hyperactivation of the mammalian target of rapamycin pathway in neurofibromatosis 1-associated human and mouse brain tumors. Cancer Res. 65, 2755–2760 [DOI] [PubMed] [Google Scholar]
- 18. Hsu Y. C., Chern J. J., Cai Y., Liu M., Choi K. W. (2007) Drosophila TCTP is essential for growth and proliferation through regulation of dRheb GTPase. Nature 445, 785–788 [DOI] [PubMed] [Google Scholar]
- 19. Bhisutthibhan J., Pan X. Q., Hossler P. A., Walker D. J., Yowell C. A., Carlton J., Dame J. B., Meshnick S. R. (1998) The Plasmodium falciparum translationally controlled tumor protein homolog and its reaction with the antimalarial drug artemisinin. J. Biol. Chem. 273, 16192–16198 [DOI] [PubMed] [Google Scholar]
- 20. MacDonald S. M., Rafnar T., Langdon J., Lichtenstein L. M. (1995) Molecular identification of an IgE-dependent histamine-releasing factor. Science 269, 688–690 [DOI] [PubMed] [Google Scholar]
- 21. Gachet Y., Tournier S., Lee M., Lazaris-Karatzas A., Poulton T., Bommer U. A. (1999) The growth-related, translationally controlled protein P23 has properties of a tubulin binding protein and associates transiently with microtubules during the cell cycle. J. Cell Sci. 112, 1257–1271 [DOI] [PubMed] [Google Scholar]
- 22. Burgess A., Labbé J. C., Vigneron S., Bonneaud N., Strub J. M., Van Dorsselaer A., Lorca T., Castro A. (2008) Chfr interacts and colocalizes with TCTP to the mitotic spindle. Oncogene 27, 5554–5566 [DOI] [PubMed] [Google Scholar]
- 23. Li F., Zhang D., Fujise K. (2001) Characterization of fortilin, a novel antiapoptotic protein. J. Biol. Chem. 276, 47542–47549 [DOI] [PubMed] [Google Scholar]
- 24. Liu H., Peng H. W., Cheng Y. S., Yuan H. S., Yang-Yen H. F. (2005) Stabilization and enhancement of the antiapoptotic activity of mcl-1 by TCTP. Mol. Cell Biol. 25, 3117–3126 [DOI] [PMC free article] [PubMed] [Google Scholar]
- 25. Rinnerthaler M., Jarolim S., Heeren G., Palle E., Perju S., Klinger H., Bogengruber E., Madeo F., Braun R. J., Breitenbach-Koller L., Breitenbach M., Laun P. (2006) MMI1 (YKL056c, TMA19), the yeast orthologue of the translationally controlled tumor protein (TCTP) has apoptotic functions and interacts with both microtubules and mitochondria. Biochim. Biophys. Acta 1757, 631–638 [DOI] [PubMed] [Google Scholar]
- 26. Susini L., Besse S., Duflaut D., Lespagnol A., Beekman C., Fiucci G., Atkinson A. R., Busso D., Poussin P., Marine J. C., Martinou J. C., Cavarelli J., Moras D., Amson R., Telerman A. (2008) TCTP protects from apoptotic cell death by antagonizing bax function. Cell Death Differ. 15, 1211–1220 [DOI] [PubMed] [Google Scholar]
- 27. Cans C., Passer B. J., Shalak V., Nancy-Portebois V., Crible V., Amzallag N., Allanic D., Tufino R., Argentini M., Moras D., Fiucci G., Goud B., Mirande M., Amson R., Telerman A. (2003) Translationally controlled tumor protein acts as a guanine nucleotide dissociation inhibitor on the translation elongation factor eEF1A. Proc. Natl. Acad. Sci. U.S.A. 100, 13892–13897 [DOI] [PMC free article] [PubMed] [Google Scholar]
- 28. Bottillo I., Ahlquist T., Brekke H., Danielsen S. A., van den Berg E., Mertens F., Lothe R. A., Dallapiccola B. (2009) Germline and somatic NF1 mutations in sporadic and NF1-associated malignant peripheral nerve sheath tumours. J. Pathol. 217, 693–701 [DOI] [PubMed] [Google Scholar]
- 29. Ruvinsky I., Meyuhas O. (2006) Ribosomal protein S6 phosphorylation: from protein synthesis to cell size. Trends Biochem. Sci. 31, 342–348 [DOI] [PubMed] [Google Scholar]
- 30. Thoreen C. C., Chantranupong L., Keys H. R., Wang T., Gray N. S., Sabatini D. M. (2012) A unifying model for mTORC1-mediated regulation of mRNA translation. Nature 485, 109–113 [DOI] [PMC free article] [PubMed] [Google Scholar]
- 31. Hsieh A. C., Liu Y., Edlind M. P., Ingolia N. T., Janes M. R., Sher A., Shi E. Y., Stumpf C. R., Christensen C., Bonham M. J., Wang S., Ren P., Martin M., Jessen K., Feldman M. E., Weissman J. S., Shokat K. M., Rommel C., Ruggero D. (2012) The translational landscape of mTOR signalling steers cancer initiation and metastasis. Nature 485, 55–61 [DOI] [PMC free article] [PubMed] [Google Scholar]
- 32. Kim D. K., Nam B. Y., Li J. J., Park J. T., Lee S. H., Kim D. H., Kim J. Y., Kang H. Y., Han S. H., Yoo T. H., Han D. S., Kang S. W. (2012) Translationally controlled tumour protein is associated with podocyte hypertrophy in a mouse model of type 1 diabetes. Diabetologia 55, 1205–1217 [DOI] [PubMed] [Google Scholar]
- 33. Tsai M. J., Yang-Yen H. F., Chiang M. K., Wang M. J., Wu S. S., Chen S. H. (2014) TCTP is essential for beta-cell proliferation and mass expansion during development and beta-cell adaptation in response to insulin resistance. Endocrinology 155, 392–404 [DOI] [PubMed] [Google Scholar]
- 34. Johannessen C. M., Johnson B. W., Williams S. M., Chan A. W., Reczek E. E., Lynch R. C., Rioth M. J., McClatchey A., Ryeom S., Cichowski K. (2008) TORC1 is essential for NF1-associated malignancies. Curr. Biol. 18, 56–62 [DOI] [PubMed] [Google Scholar]
- 35. Meshnick S. R., Thomas A., Ranz A., Xu C. M., Pan H. Z. (1991) Artemisinin (qinghaosu): the role of intracellular hemin in its mechanism of antimalarial action. Mol. Biochem. Parasitol. 49, 181–189 [DOI] [PubMed] [Google Scholar]
- 36. Chae J., Choi I., Kim C. (2006) Homology modeling and molecular docking study of translationally controlled tumor protein and artemisinin. Arch. Pharm. Res. 29, 50–58 [DOI] [PubMed] [Google Scholar]
- 37. Berdelle N., Nikolova T., Quiros S., Efferth T., Kaina B. (2011) Artesunate induces oxidative DNA damage, sustained DNA double-strand breaks, and the ATM/ATR damage response in cancer cells. Mol. Cancer Ther. 10, 2224–2233 [DOI] [PubMed] [Google Scholar]
- 38. Rasheed S. A., Efferth T., Asangani I. A., Allgayer H. (2010) First evidence that the antimalarial drug artesunate inhibits invasion and in vivo metastasis in lung cancer by targeting essential extracellular proteases. Int. J. Cancer 127, 1475–1485 [DOI] [PubMed] [Google Scholar]
Associated Data
This section collects any data citations, data availability statements, or supplementary materials included in this article.