

Background: The physiological roles of mucin-type O-glycosylation in proteoglycans are completely unknown.
Results: Overexpression of Galnt3 (UDP-N-acetyl-α-d-galactosamine:polypeptide N-acetylgalactosaminyltransferase 3) in chondrocytes reduced aggrecan and caused dwarfism.
Conclusion: N-acetylgalactosamine (GalNAc)-transferases increase mucin type O-glycans but reduce glycosaminoglycans leading to the reduction of aggrecan probably through competition with xylosyltransferases.
Significance: GalNAc-transferases regulate chondrocyte proliferation and maturation by modifying the glycosylation of aggrecan.
Keywords: Chondrocyte, Glycosaminoglycan, Glycosyltransferase, Mucin, Proteoglycan, Aggrecan, Galnt3, Mucin-type O-Glycan
Abstract
Galnt3, UDP-N-acetyl-α-d-galactosamine:polypeptide N-acetylgalactosaminyltransferase 3, transfers N-acetyl-d-galactosamine to serine and threonine residues, initiating mucin type O-glycosylation of proteins. We searched the target genes of Runx2, which is an essential transcription factor for chondrocyte maturation, in chondrocytes and found that Galnt3 expression was up-regulated by Runx2 and severely reduced in Runx2−/− cartilaginous skeletons. To investigate the function of Galnt3 in chondrocytes, we generated Galnt3−/− mice and chondrocyte-specific Galnt3 transgenic mice under the control of the Col2a1 promoter-enhancer. Galnt3−/− mice showed a delay in endochondral ossification and shortened limbs at embryonic day 16.5, suggesting that Galnt3 is involved in chondrocyte maturation. Galnt3 transgenic mice presented dwarfism, the chondrocyte maturation was retarded, the cell cycle in chondrocytes was accelerated, premature chondrocyte apoptosis occurred, and the growth plates were disorganized. The binding of Vicia villosa agglutinin, which recognizes the Tn antigen (GalNAc-O-Ser/Thr), was drastically increased in chondrocytes, and aggrecan (Acan) was highly enriched with Tn antigen. However, safranin O staining, which recognizes glycosaminoglycans (GAGs), and Acan were severely reduced. Chondroitin sulfate was reduced in amount, but the elongation of chondroitin sulfate chains had not been severely disturbed in the isolated GAGs. These findings indicate that overexpression of Galnt3 in chondrocytes caused dwarfism due to the increase of mucin-type O-glycans and the reduction of GAGs, probably through competition with xylosyltransferases, which initiate GAG chains by attaching O-linked xylose to serine residues, suggesting a negative effect of Galnt family proteins on Acan deposition in addition to the positive effect of Galnt3 on chondrocyte maturation.
Introduction
In the cartilage anlage, chondrocytes lay an exclusive extracellular matrix and proceed to sequential phases of proliferation, prehypertrophy, and hypertrophy. Hypertrophic cells then mineralize the extracellular matrix surrounding them and die through apoptosis (1, 2). This differentiation process results in the formation of a cartilaginous growth plate responsible for elongation of the bone. Finally, blood vessels, together with osteoblast and osteoclast progenitors, invade the anlage through the mineralized hypertrophic region, degrade the cartilage, and replace it with bone.
The extracellular matrix produced by growth plate chondrocytes is rich in collagens and proteoglycans (3). Proteoglycans are made of a core protein to which disaccharide chains called sulfated glycosaminoglycans (GAGs)4 composed of repeating disaccharide units, including chondroitin sulfate, dermatan sulfate, keratan sulfate, and heparan sulfate, are covalently bound (4). The acidic GAGs have the capacity to hold water, which makes the cartilage resilient (5). Moreover, proteoglycans in cartilage regulate the diffusion of growth factors and bind different functional proteins like fibroblast growth factors and hedgehog proteins, regulating cell signaling pathways (6–8). The importance of the cartilage extracellular matrix can be noted in the phenotypes of humans or mice carrying mutations in genes encoding extracellular matrix proteins (9, 10).
Mucin-type O-glycosylation, consisting of glycans attached via O-linked N-acetyl-d-galactosamine (GalNAc) to serine and threonine residues, is one of the most abundant forms of protein glycosylation in animals, and it is controlled by a large family of up to 20 homologous Galnt genes encoding UDP-GalNAc:polypeptide GalNAc-transferases (11). It is well known that Galnt3 regulates phosphate homeostasis through glycosylation of FGF23. Loss-of-function mutations in the GALNT3 gene result in underglycosylation and consequent protein degradation of FGF23, leading to hyperostosis-hyperphosphatemia syndrome or tumoral calcinosis (12–16).
We searched the target genes of Runx2, which is essential for chondrocyte maturation (17, 18), in chondrocytes, and found that Galnt3 expression is induced by Runx2 and is severely reduced in the cartilaginous tissues of Runx2−/− mice. To investigate the function of Galnt3 in chondrocytes, we generated Galnt3−/− mice and chondrocyte-specific Galnt3 transgenic mice. Although many Galnt family genes were expressed in cartilaginous tissues during embryogenesis, the process of endochondral ossification was retarded in Galnt3−/− mice at the embryonic stage. Galnt3 transgenic mice showed severely shortened endochondral bones, and the cartilage extracellular matrix contained very low amounts of aggrecan (Acan) proteoglycan. Increase of mucin-type O-glycosylation by Galnt3 reduced GAGs and resulted in a severe reduction of Acan in the cartilage extracellular matrix.
EXPERIMENTAL PROCEDURES
Cell Culture and Adenoviral Transfer
Primary chondrocytes were prepared from the skeletons of embryonic day 18.5 (E18.5) Runx2−/− embryos as described previously (19). Primary chondrocytes were infected with either green fluorescent protein (GFP)-expressing or Runx2- and GFP-expressing adenovirus as described previously (20).
Real-time RT-PCR Analysis
We prepared total RNA from cartilaginous tissues of wild-type, Runx2−/−, and Galnt3 transgenic embryos and from Runx2−/− primary chondrocytes. RNA samples were reverse transcribed using Moloney murine leukemia virus reverse transcriptase (Invitrogen). The cDNA was analyzed by real-time PCR using SYBR Green mix and the ABI7700 cycler (Applied Biosystems). Primers used for amplification were as follows: Runx2, CCGCACGACAACCGCACCAT and CGCTCCGGCCCACAAATCTC; Galnt3, ACACTATTTACCCGGAAGCG and AGCTCCTTCTGGATGTTGTG, Ihh, TTCAAGGACGAGGAGAACACG and TTCAGACGGTCCTTGCAGC; Pthlh, CAGTGGAGTGTCCTGGTATT and GATCTCCGCGATCAGATGGT; Pth1r, CAGGCGCAATGTGACAAGC and TTTCCCGGTGCCTTCTCTTTC; Bmp2, TAGATCTGTACCGCAGGCAC and CCCACTCATCTCTGGAAGTT. Primer sequences for other Galnt family members were described previously (21). Gapdh was used as an internal control.
Generation of Galnt3−/− Mice and Galnt3 Transgenic Mice
Galnt3−/− mice were generated as described previously (22). The background of Galnt3−/− mice was originally a mixed 129Ola/C57BL6 background. Galnt3−/− mice in a mixed 129Ola/C57BL6 background were backcrossed to C57BL/6 at least 14 generations prior to the analysis. To generate Galnt3 transgenic mice, a 1902-bp mouse Galnt3 cDNA fragment was cloned into the NotI site of a pNASSβ expression vector (Clontech), which contained the promoter and enhancer of the mouse Col2a1 gene (23–25). The construct was injected into the pronuclei of fertilized eggs from F1 hybrid mice (C57BL/6 × C3H). Mutant embryos were identified by genomic PCR. Transgene expression was measured by real-time RT-PCR using RNA purified from the vertebrae and ribs. Serum phosphate and calcium levels were examined using the Phopha-C-test kit (Wako, Osaka, Japan) and Calcium-E-test kit (Wako), respectively. Serum testosterone levels were examined by liquid chromatography-tandem mass spectrometry (ASKA Pharma Medical Co., Ltd). Prior to the study, all experiments were reviewed and approved by the Animal Care and Use Committee of the Nagasaki University Graduate School of Biomedical Sciences.
Skeletal Examination
To evaluate the morphology of the whole skeleton, after removal of skin and internal organs, embryos at E16.5 and E18.5 were fixed in 99% ethanol for 4 days. Then the skeletons were stained with 0.015% Alcian blue 8GX and then with 0.002% alizarin red-S as described previously (26). Finally, they were cleared in an aqueous KOH solution and glycerol.
Histological Analyses
Samples were fixed in 4% paraformaldehyde, 0.1 m phosphate buffer and embedded in paraffin. Sections (7 μm thick) were stained with hematoxylin and eosin (H&E) and the von Kossa method. For in situ hybridization, single-stranded RNA probes were labeled with digoxigenin-11-UTP using a DIG RNA labeling kit (Roche Applied Science) according to the manufacturer's instructions. Sections were hybridized using mouse Col2a1, Acan, Col10a1, and Spp1 antisense probes as described previously (17). To prepare Galnt3 probes, cDNA fragments were inserted in pBluescript (Stratagene). The 5′- and 3′-end sequences were as follows: ATGGCTCACCTTAAGCGACT/CAAGGGTACTACACAGCCGC; GAATTCAACAAGCCTTCTCC/TAAAAATTTTACCTGGTACC, and GGTACCTGAACACTATTTAC/TTTTTAGCCAAAATGAATAA. Safranin O staining was performed as follows. After deparaffinization and hydration of tissue sections, cellular staining was achieved with Weigert's acid iron chloride hematoxylin (1%) and 0.02% fast green FCF in 1% acetic acid. Finally, sulfated proteoglycans were stained with 0.1% safranin O in distilled water for 6 min. The sections were counterstained with methyl green. For PAS staining, tissue slices were oxidized in 1% periodic acid for 10 min and rinsed several times in deionized water. Then the slides were immersed in Schiff's reagent (Merck) at room temperature for 10 min and washed in tap water for 10 min. The sections were counterstained with hematoxylin. Acan immunohistochemistry was done using rabbit polyclonal anti-aggrecan antibody (AB 1031, Chemicon, Temecula, CA) after treatment with chondroitinase ABC (Sigma). Color visualization of the target was obtained with diaminobenzidine tetrahydrochloride substrate. The sections were counterstained with methyl green.
BrdU Incorporation Study and TUNEL Staining
For BrdU incorporation experiments, 18.5-day postcoitus pregnant mice were intraperitoneally injected with 50 μg of BrdU/g of body weight. One hour later, embryos were obtained by cesarean dissection. Mice at 3 weeks of age were injected intraperitoneally with 100 μg of BrdU/g of body weight and sacrificed 1 h later. BrdU incorporation by proliferating cells was detected by immunohistochemistry using monoclonal mouse anti-BrdU antibody (Dako). Visualization was achieved by the EnVision system (Dako) and DAB (3,3′-diaminobenzidine, tetrahydrochloride) substrate. Sections were counterstained with toluidine blue. Apoptotic cells were identified in tibia sections by TUNEL staining using the ApopTag peroxidase in situ apoptosis detection kit (Chemicon).
Lectin Histochemistry
After blocking endogenous peroxidase activity with 0.3% H2O2 in methanol, sections were treated with PBS, containing 1% bovine serum albumin and 0.05% Tween 20 for 30 min and incubated with biotinylated Vicia villosa agglutinin (VVA) (5 μg/ml) (Vector Laboratories Inc., Burlingame, CA) at room temperature for 1 h. Then they were rinsed with PBS, incubated with horseradish peroxidase-conjugated streptavidin (2.5 μg/ml) (Vector Labs) at room temperature for 1 h, and visualized as a brown reaction product by applying Histofine Simple Stain DAB solution (Nichirei). The sections were counterstained with methyl green. The following controls for specificity of lectin labeling were used: 1) preabsorption of lectins with inhibiting sugars, N-acetylgalactosamine (200 mm; Vector Labs) and 2) substitution of biotinylated lectins with PBS.
Western Blot Analysis
Whole-tissue lysates were prepared from the limb skeletons at E15.5 and the epiphyses of femurs and tibiae at postnatal day 10 in 50 mm Tris-HCl (pH 7.4), 50 mm sodium acetate containing protease inhibitors (Roche Applied Science). To detect VVA reactivity, lysates were digested with 0.25 units/ml chondroitinase ABC (Sigma) at 37 °C for 2 h. Membrane blots were incubated first with biotinylated VVA (0.4 μg/ml) and then with horseradish peroxidase-conjugated streptavidin (0.1 μg/ml). To detect Acan protein, lysates were digested with 0.25 units/ml chondroitinase ABC (Sigma) or with 0.25 units/ml chondroitinase ABC, 1 unit/ml neuraminidase (New England Biolabs), and 10 units/ml O-glycosidase (New England Biolabs) at 37 °C for 2 h with agitation (220 rpm). Sodium chloride (final concentration 150 mm) and Triton X-100 (final concentration 1%) were added, and the lysates were agitated at 37 °C for 1 h. After centrifugation, the supernatants were used for Western blot analysis. Membrane blots were incubated first with rabbit polyclonal antibody against Acan (Chemicon) or goat polyclonal antibody against actin (Santa Cruz Biotechnology, Inc.) and then with the corresponding secondary antibodies conjugated with horseradish peroxidase.
Immunoprecipitation Assay
Whole-tissue lysates were prepared from the limb skeletons at E15.5 in 50 mm Tris-HCl (pH 7.4), 50 mm sodium acetate containing protease inhibitors (Roche Applied Science). Lysates were digested with 0.25 units/ml chondroitinase ABC at 37 °C for 2 h. After centrifugation, the supernatants were incubated with anti-Acan (1 μg) antibody (AB 1031, Chemicon) and 50 μl of Dynabeads Protein G (Invitrogen) at 4 °C overnight with rotation. The beads were washed three times in washing buffer, and immunocomplexes were analyzed by Western blotting. Membrane blots were incubated first with biotinylated VVA (0.4 μg/ml) and then with horseradish peroxidase-conjugated streptavidin (0.1 μg/ml).
Isolation of GAGs
Cartilage samples were suspended in water and boiled at 100 °C for 10 min. Borate-NaOH and CaCl2 were added to a final concentration of 1 m and 10 mm, respectively. Samples were sequentially digested first with Pronase (2% (w/w) of the sample) at 60 °C for 24 h and then with actinase (1% (w/w) of the sample), which was added twice at a 24-h interval. After a total of 96 h of digestion, proteins were precipitated by adding trichloroacetic acid (TCA) at a concentration of 5%, and the mixtures were centrifuged. The precipitates were resuspended in 5% TCA and centrifuged again. The supernatants were pooled, and the excess TCA was removed by extraction with diethyl ether. GAGs were precipitated at 4 °C overnight by adding 4 volumes of 80% ethanol containing 5% sodium acetate. Finally, the precipitates were collected by centrifugation and dried.
Disaccharide Composition Analysis
An aliquot of each GAG preparation was digested with chondroitinase ABC, followed by labeling with a fluorophore, 2-aminobenzamide. Excess 2-aminobenzamide was removed with chloroform. Labeled disaccharides were diluted with 16 mm NaH2PO4 to a final volume of 100 μl, and an aliquot was analyzed by anion exchange HPLC on an amine-bound silica PA-03 column (YMC-Pack PA, Kyoto, Japan) by fluorescent detection (excitation and emission wavelengths at 330 and 420 nm, respectively).
Analysis of the Chain Length of Chondroitin Sulfate
The molecular mass of the chondroitin sulfate preparations was determined by gel filtration using a column of Superdex 200 calibrated with molecular mass markers, including dextran preparations (average mass, 18.1, 37.5, and 65.5 kDa) and heparan sulfate from bovine intestinal mucosa (average mass, 7.5 kDa). Two micrograms of chondroitin sulfate preparations were loaded onto the column and eluted with 0.2 m ammonium bicarbonate at a flow rate of 0.3 ml/min, and the fractions were collected at 3-min intervals, dried, and reconstituted in 50 μl of water. An aliquot (20 μl) from fraction 8 to fraction 24 was taken for chondroitin sulfate analysis using a PA-03 amine-bound silica column after chondroitinase ABC digestion followed by labeling with 2-aminobenzamide.
Statistical Analysis
Values are shown as mean ± S.D. Statistical analyses of two groups were performed by Student's t test, and those of three groups were performed by ANOVA and the Tukey-Kramer post hoc test. A p value of less than 0.05 was considered significant.
RESULTS
Involvement of Runx2 in Galnt3 Expression and the Expression of Galnt Family Genes during Skeletal Development
We searched Runx2 target genes by introducing Runx2 into primary Runx2−/− chondrocytes using a microarray. Galnt3 expression was induced 5 times by the infection of adenovirus expressing Runx2 and GFP compared with that expressing GFP. Real-time RT-PCR analysis confirmed the induction of Galnt3 expression by Runx2 (Fig. 1, A and B). Galnt3 expression in skeletal tissues was examined in wild-type mice at E12.5, E13.5, E16.5, and E18.5 and in Runx2−/− mice at E18.5. Galnt3 expression was highest at E13.5 in wild-type mice, and it was severely reduced in Runx2−/− mice at E18.5, when the skeletons are cartilaginous (Fig. 1C). The expression of Galnt family genes in skeletal tissues of wild-type mice was also examined (Fig. 1D). Many Galnt family genes, including Galnt1, Galnt2, Galnt4, Galnt5, Galnt8, Galnt10, Galnt11, and Galnt14, were also expressed at levels similar to or higher than that of Galnt3, with the highest level at E13.5, when the skeletons are cartilaginous. These findings indicate that Galnt3 expression is regulated by Runx2 in chondrocytes, but many Galnt family genes are redundantly expressed in cartilaginous tissues. To clarify the function of Galnt3 in chondrocytes, we generated Galnt3−/− mice and chondrocyte-specific Galnt3 transgenic mice.
FIGURE 1.

Real-time RT-PCR analysis. A and B, induction of Galnt3 expression by Runx2. Runx2−/− primary chondrocytes were infected with adenovirus expressing GFP (open columns) or expressing Runx2 and GFP (closed columns), and the expressions of Runx2 (A) and Galnt3 (B) were examined at 24 and 48 h after the infection. n = 3. C and D, Galnt3 expression in wild-type mice at E12.5, E13.5, E16.5, and E18.5 and Runx2−/− mice at E18.5 (C) and the expression of Galnt family genes in wild-type mice at E12.5, E13.5, E16.5, and E18.5 (D). n = 3–6. Gapdh was used as an internal control, and the value of Gapdh was set as 1000 and the relative levels are shown. Error bars, S.D.
Galnt3−/− Mice Showed a Delay in Endochondral Ossification at E16.5
We examined the skeletal development of Galnt3−/− embryos at E16.5. Galnt3−/− mice showed mild dwarfism, and the lengths of limb skeletons were shortened (Fig. 2, A–K). The lengths of mineralized area in the humeri of Galnt3−/− embryos were significantly shorter than those of wild-type and Galnt3+/− embryos (Fig. 2L), indicating that the process of endochondral ossification is retarded. At 3 weeks of age, the body weights of Galnt3−/− male mice but not Galnt3−/− female mice were significantly lower than those of wild-type and Galnt3+/− mice of the respective sex (Fig. 2, M and N). There was no significant difference in serum testosterone levels between wild-type and Galnt3−/− male mice (wild type, 20.9 ± 6.2 pg/ml, n = 18; Galnt3−/−, 16.6 ± 6.2 pg/ml, n = 7). The serum concentrations of calcium and phosphate were similar between wild-type and Galnt3−/− mice in both sexes (Fig. 2, O and P). The lengths of femurs and the lengths of proliferating chondrocyte layers and hypertrophic chondrocyte layers were similar between wild-type and Galnt3−/− male mice (Fig. 2, Q and S). Further, there was no difference in the frequencies of BrdU-positive cells between wild-type and Galnt3−/− male mice (Fig. 2, T–V). In order to examine the presence of mucin-type O-glycans in growth plates, the reactivity to VVA, which recognizes the Tn antigen (GalNAc-O-Ser/Thr) generated by GalNAc-transferase (27, 28), was examined. Lysates from wild-type and Galnt3−/− mice showed a similar level of VVA reactivity (Fig. 2W), probably due to the redundant expression of Galnt family genes in growth plates (Fig. 1D).
FIGURE 2.

Phenotypes of Galnt3−/− mice. A–L, skeletal examination at E16.5. Lateral views of whole embryos (A–C), forelimbs (D–F), and hind limbs (G–I) of wild-type (A, D, and G), Galnt3+/− (B, E, and H), and Galnt3−/− (C, F, and I) embryos. The lengths of femurs (J), humeri (K), and the mineralized area of humeri (L) in wild-type (n = 8), Galnt3+/− (n = 11), and Galnt3−/− (n = 6) embryos were measured. M–V, analyses of mice at 3 weeks of age. M, body weight of wild-type (n = 18), Galnt3+/− (n = 26), and Galnt3−/− (n = 11) male mice. N, body weight of wild-type (n = 10), Galnt3+/− (n = 24), and Galnt3−/− (n = 9) female mice. O and P, serum concentration of calcium (O) and phosphate (P) in wild-type (male, n = 11; female, n = 5) and Galnt3−/− (male, n = 3; female, n = 5) mice. Q–S, the lengths of femurs (Q) and lengths of proliferating (R) and hypertrophic (S) layers in wild-type (n = 10) and Galnt3−/− (n = 10) male mice. The lengths of proliferating and hypertrophic chondrocyte layers were measured using H&E-stained sections. T–V, BrdU staining of wild-type (T) and Galnt3−/− (U) male mice and the frequencies of BrdU-positive cells in the growth plates of femurs in wild-type (n = 5) and Galnt3−/− (n = 5) male mice (V). W, reactivity to VVA. Lysates, which were prepared from the epiphyses of femurs and tibiae at postnatal day 10, were treated with chondroitinase ABC. The membrane was reacted with VVA or exposed to anti-β-actin antibody. Similar results were obtained in four wild-type and four Galnt3−/− mice, and representative data are shown. *, p < 0.05; **, p < 0.01; ***, p < 0.001. Scale bars, 1 mm (A–I) and 100 μm (T and U). Error bars, S.D.
Galnt3 Overexpression in Cartilage Resulted in Skeletal Abnormalities
In wild-type mice, Galnt3 was expressed in resting, proliferating, and prehypertrophic chondrocytes (Fig. 3, A–C). To examine the function of Galnt3 in chondrocytes, we generated chondrocyte-specific Galnt3 transgenic mice under the control of the Col2a1 promoter-enhancer, which directs transgene expression to resting, proliferating, and prehypertrophic chondrocytes. In Galnt3 transgenic mice, Galnt3 was strongly detected in resting, proliferating, and prehypertrophic chondrocytes (Fig. 3D).
FIGURE 3.

In situ hybridization of Galnt3 mRNA. Shown is in situ hybridization of Galnt3 mRNA using sections of wild-type forelimb at E13.5 (A) and tibia at E14.5 (B) and E15.5 (C) and Galnt3 transgenic tibia at E16.5 (D). Scale bars, 100 μm.
Galnt3 transgenic mice survived until delivery but died just after birth. Therefore, we analyzed F0 transgenic mice at the embryonic stage (Table 1). Macroscopically, transgenic embryos displayed severe dwarfism, domed skulls, short limbs and mandible, protruding tongue, and cleft palate (Table 1) (Fig. 4, A and B). All of the Galnt3 transgenic embryos with dwarfism expressed the transgene in cartilage, and the levels of the transgene expression were correlated with the severity of dwarfism. Skeletal staining of embryos at E18.5 with alizarin red and Alcian blue revealed that Galnt3 transgenic mice had shorter or smaller endochondral bones than wild-type siblings. The small sternum and ribs resulted in bell-shaped thoracic cages (Fig. 4C). As expected, bones derived from intramembranous ossification were similarly mineralized in wild-type and Galnt3 transgenic mice (Fig. 4C).
TABLE 1.
Production frequency of transgenic mice
| Age | Obtained mice | Transgenic mice | Transgenic mice with dwarfism |
|---|---|---|---|
| E13.5 | 48 | 6 | Not distinguishable |
| E14.5 | 79 | 8 | 6 |
| E15.5 | 605 | 80 | 47 |
| E16.5 | 183 | 44 | 24 |
| E17.5 | 27 | 8 | 3 |
| E18.5 | 416 | 83 | 46 |
FIGURE 4.
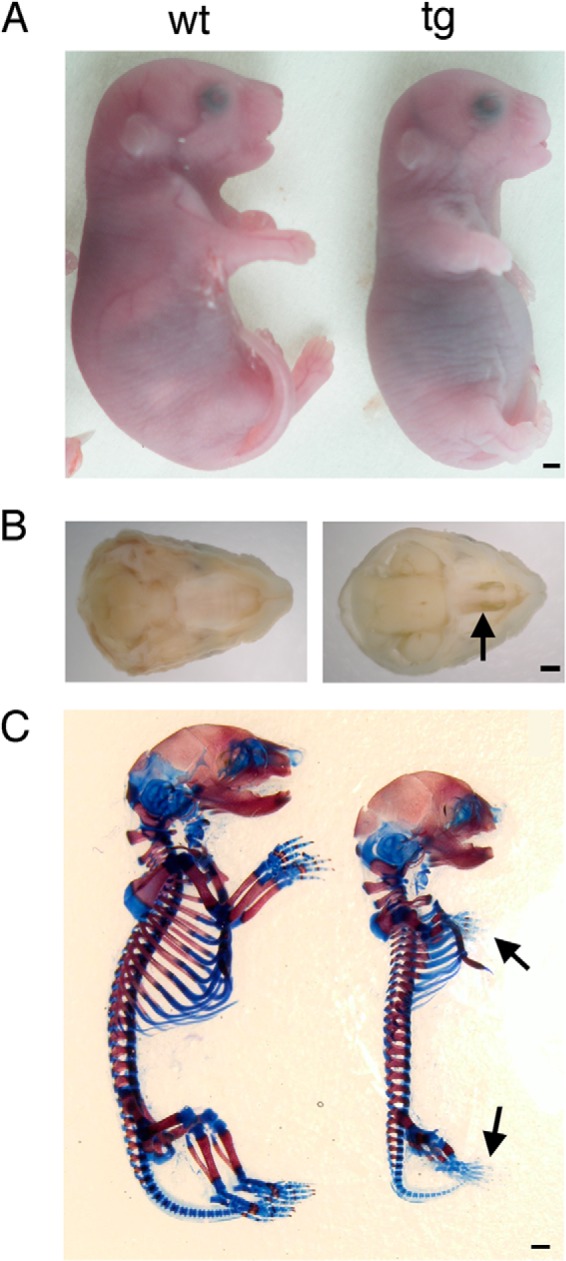
Appearance and skeletal system of Galnt3 transgenic embryos. A, macroscopic appearance of wild-type (wt) and Galnt3 transgenic (tg) embryos at E18.5. The abdomen in Galnt3 transgenic embryos was protruded because of the small thoracic cage. B, macroscopic views of the palates of wild-type (left) and Galnt3 transgenic (right) embryos at E18.5. A Galnt3 transgenic embryo presents cleft palate (arrow). C, skeletons of wild-type (left) and Galnt3 transgenic (right) embryos at E18.5 stained with alizarin red and Alcian blue. The arrows indicate the reduced Alcian blue staining and the lack of alizarin red staining in the bones of the hand and foot. Scale bars, 1 mm.
Galnt3 Transgenic Mice Displayed a Disorganized Growth Plate
Wild-type growth plates at E16.5 and E18.5 showed chondrocytes arranged in morphologically distinguishable layers: resting, proliferating, hypertrophic, and terminal hypertrophic chondrocyte layers (Fig. 5, A, C, E, and G). In the resting chondrocyte layer, chondrocytes were small, round, and uniformly scattered. In the proliferating chondrocyte layer, they became flattened and arranged themselves in groups of columns that were oriented parallel to the longitudinal axis of the bone. With further differentiation, the chondrocytes gradually increased in size and established the hypertrophic chondrocyte layer. Terminal differentiation resulted in mineralization of the extracellular matrix around the terminal hypertrophic chondrocytes (Fig. 5, A, C, E, and G).
FIGURE 5.
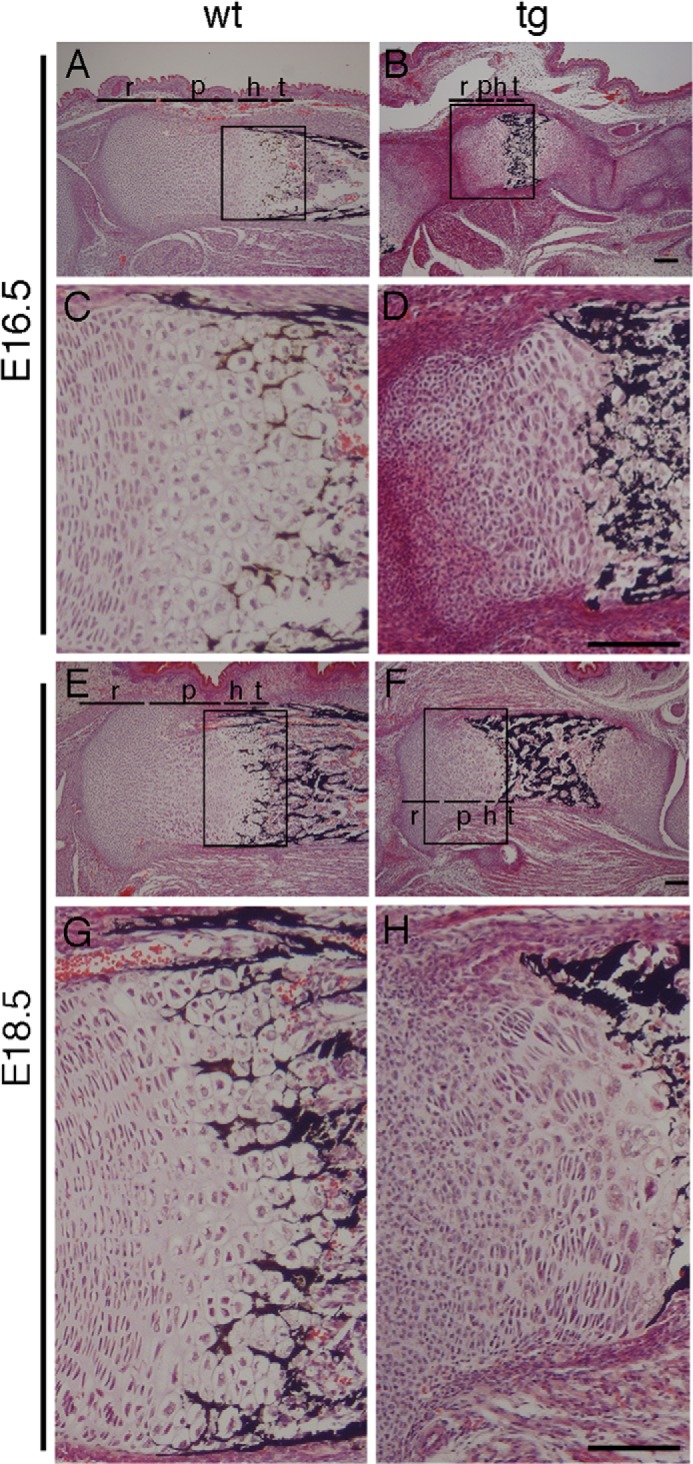
Histological analysis of growth plates. H&E and von Kossa staining of tibia sections at E16.5 (A–D) and E18.5 (E–H) from wild-type (A, C, E, and G) and Galnt3 transgenic mice (B, D, F, and H). Boxed regions in A, B, E, and F are magnified in C, D, G, and H, respectively. The layers of resting (r), proliferating (p), hypertrophic (h), and terminal hypertrophic (t) chondrocytes are shown in A, B, E, and F. Scale bars, 100 μm.
In contrast, Galnt3 transgenic mice with high transgene expression had disorganized growth plates. Each chondrocyte layer except the terminal hypertrophic chondrocyte layer was short compared with the respective layer in wild-type mice, and the separation between layers was not clear (Fig. 5, B, D, F, and H). In the resting chondrocyte layer, chondrocytes were present at a high density, surrounded by scarce extracellular matrix (Fig. 5, D and H). The proliferating chondrocyte layer contained round chondrocytes mixed with flattened chondrocytes, and the oriented columnar organization was disturbed (Fig. 5, D and H). The hypertrophic chondrocyte layer was extremely narrow (Fig. 5, B and F). The cell density was extremely high in the zone between the tibia and femur, and the boundary between joint connective tissue and the epiphyses was not clear at E16.5 (Fig. 5, B and D).
Chondrocyte Hypertrophy Was Delayed in Galnt3 Transgenic Mice
To further study the differentiation state of chondrocytes in Galnt3 transgenic mice, we assessed the expression of Col2a1, Acan, Col10a1, and Spp1 by in situ hybridization using metatarsal bone slices at E18.5. Col2a1 and Acan, which are strongly expressed in resting and proliferating chondrocytes, were detected in the epiphysis and metaphysis; Col10a1, which is expressed in hypertrophic chondrocytes, was detected in the metaphysis; and Spp1, which is expressed in terminal hypertrophic chondrocytes, was detected in the diaphysis in wild-type embryos (Fig. 6, A, C, E, and G). In Galnt3 transgenic mice, however, Col2a1 and Acan were detected in most parts of the metatarsal bones, and Col10a1 and Spp1 expression were restricted to the center of the diaphysis, indicating that chondrocyte hypertrophy was delayed in Galnt3 transgenic mice (Fig. 6, B, D, F, and H).
FIGURE 6.
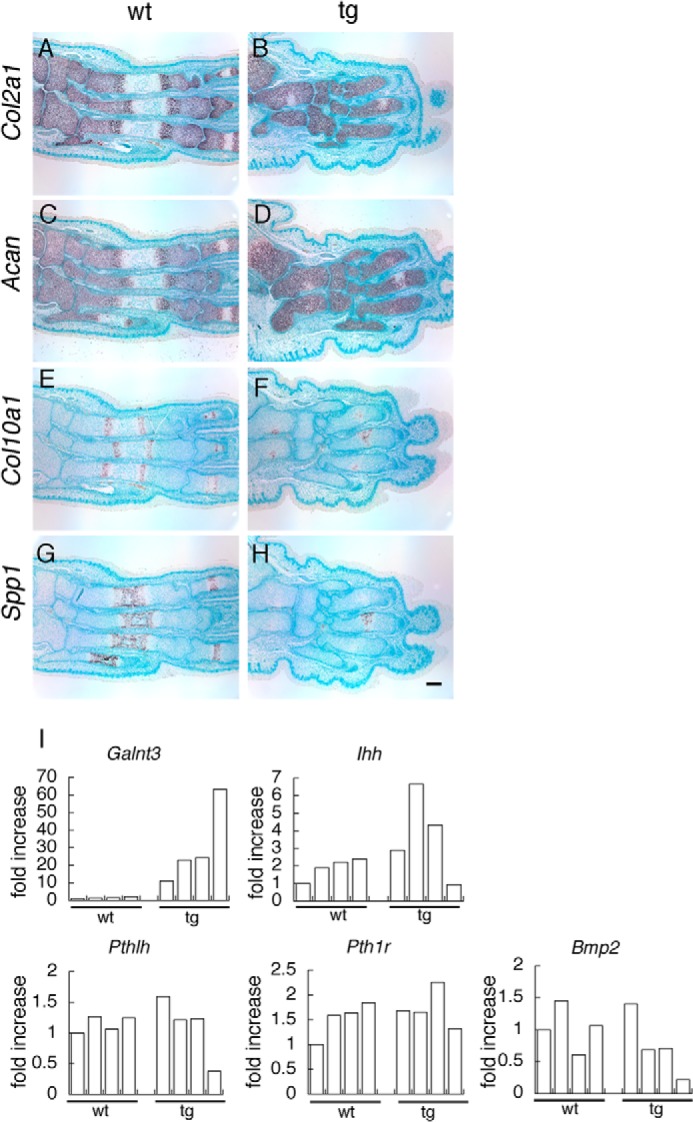
In situ hybridization and real-time RT-PCR analysis. Shown is in situ hybridization of sections of tarsal and metatarsal bones from wild-type (A, C, E, and G) and Galnt3 transgenic (B, D, F, and H) embryos at E18.5 using Col2a1 (A and B), Acan (C and D), Col10a1 (E and F), and Spp1 (G and H) antisense probes. We detected no signal using sense probes (data not shown). Scale bar, 100 μm. I, real-time RT-PCR analysis of Galnt3, Ihh, Pthlh, Pth1r, and Bmp2. RNA was extracted from the cartilaginous tissues of four wild-type and four F0 Galnt3 transgenic embryos at E15.5.
We examined the expression of Galnt3, Ihh, Pthlh, Pth1r, and Bmp2 by real-time RT-PCR using the RNA from cartilaginous tissues of four wild-type and four F0 Galnt3 transgenic embryos at E15.5 (Fig. 6I). Ihh expression was up-regulated in Galnt3 transgenic embryos with medial transgene expression but down-regulated in Galnt3 transgenic embryo with high transgene expression. Pthlh expression was down-regulated in Galnt3 transgenic embryo with high transgene expression. The levels of Bmp2 expression were inversely correlated with those of transgene expression.
Increased Proliferation and Apoptosis in Chondrocytes of Galnt3 Transgenic Mice
To understand whether abnormal cell proliferation and/or apoptosis contributed to the dwarfism in Galnt3 transgenic mice, we performed BrdU incorporation experiments and TUNEL staining using sections of tibias at E18.5. The growth plates in Galnt3 transgenic mice showed increased percentages of cells incorporating BrdU compared with wild-type mice (Fig. 7, A–C). On TUNEL staining, the growth plates in both wild-type and Galnt3 transgenic mice showed several apoptotic cells in the terminal hypertrophic chondrocyte layers (data not shown). However, the growth plates in Galnt3 transgenic mice also displayed abnormal apoptotic cells in the resting and proliferating layers (Fig. 7, D and E).
FIGURE 7.
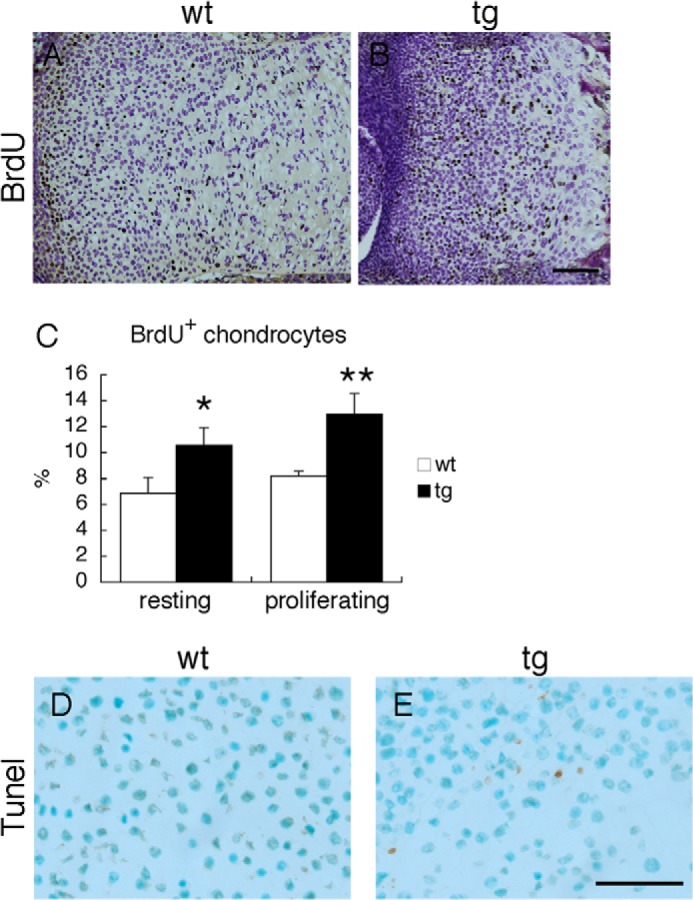
BrdU labeling and TUNEL staining. A and B, immunolocalization of incorporated BrdU on tibia slices from wild-type (A) and Galnt3 transgenic (B) embryos at E18.5. Scale bar, 100 μm. C, the percentage of BrdU-positive cells in wild-type (wt) and Galnt3 transgenic (tg) mice. The percentage was analyzed in the resting and proliferating layers. The cells in a minimum of three sections per embryo were counted, and three wild-type and three Galnt3 transgenic embryos were examined. *, p < 0.05; **, p < 0.001. D and E, TUNEL staining of resting chondrocyte layers from wild-type (D) and Galnt3 transgenic (E) embryos at E18.5. Scale bar, 50 μm. Error bars, S.D.
Increase in Tn Antigen and Enhanced PAS Staining but Decrease in GAGs in the Growth Plates of Galnt3 Transgenic Mice
VVA binding was detected in resting, proliferating, and prehypertrophic chondrocytes with strongest intensity in the proliferating chondrocytes in metatarsal bones of wild-type mice at E18.5, whereas it was more strongly detected in many of the chondrocytes in Galnt3 transgenic mice (Fig. 8, A and B). To evaluate the cartilage extracellular matrix, the serial sections were stained with safranin O, which detects sulfated GAGs. It stained cartilage extracellular matrix strongly and uniformly in the wild-type section, whereas it seemed to stain the extracellular matrix in a reciprocal manner with VVA in the Galnt3 transgenic section (Fig. 8, C and D). In the sections from tibiae of Galnt3 transgenic mice, safranin O failed to stain the periarticular region, and the staining was uneven and much weaker than in wild-type mice in the rest of the growth plates (Fig. 8, E–I). We observed the reduction in safranin O staining as early as E14.0 (data not shown).
FIGURE 8.
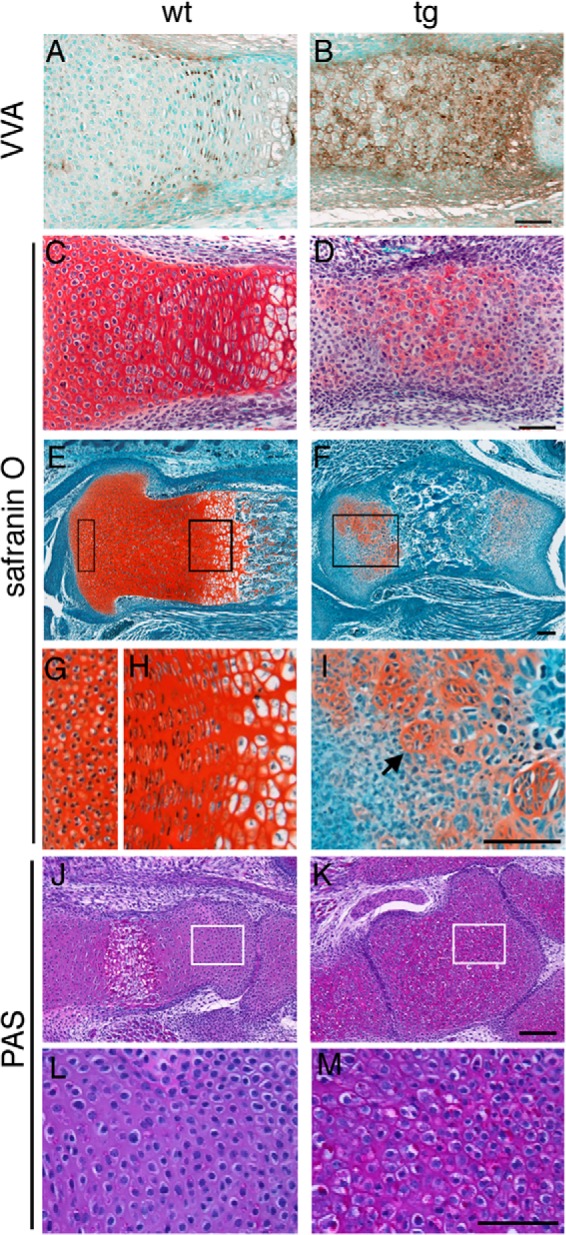
Lectin histochemistry and safranin O and PAS staining. A and B, VVA histochemistry. VVA-binding was examined using sections of metatarsal bones from wild-type (A) and Galnt3 transgenic (B) embryos at E18.5. C and D, the serial sections of A and B were stained with safranin O. E–I, safranin O staining of sections of tibiae from wild-type (E, G, and H) and Galnt3 transgenic (F and I) embryos at E18.5. The two boxed regions in E are magnified in G and H, and the boxed region in F is magnified in I. The arrow in I indicates a group of chondrocytes disposed in a round-shaped cluster instead of a columnar form. J–M, PAS staining of sections of calcanei from wild-type (J and L) and Galnt3 transgenic (K and M) embryos at E18.5. The boxed regions in J and K are magnified in L and M, respectively. Scale bars, 50 μm (A–D, L, and M) and 100 μm (E–K).
Oligosaccharides and molecules with carbohydrate glycol groups with neutral electrostatic charge, such as glycoproteins and glycolipids, but not acidic GAGs, which contain negatively charged disaccharides, are stained with standard periodic acid-Schiff (PAS) (29). Using the classic short time oxidation reaction, sections of calcanei at E18.5 were stained with PAS. The staining was detected in resting, proliferating, and hypertrophic chondrocytes with the strongest intensity in the hypertrophic chondrocytes, but the staining in the extracellular matrix was weak in wild-type mice. In Galnt3 transgenic mice, it was strongly detected in most of the chondrocytes and in the extracellular matrix (Fig. 8, J–M).
Aggrecan Protein but Not mRNA Was Severely Reduced in the Growth Plates of Galnt3 Transgenic Mice
Because GAGs were reduced in the growth plates of Galnt3 transgenic mice, we examined the mRNA and protein distribution of Acan, the most abundant proteoglycan, by in situ hybridization and immunohistochemistry, respectively. Acan mRNA was strongly expressed in the resting, proliferating, and prehypertrophic chondrocyte layers in the growth plates of wild-type and Galnt3 transgenic mice (Fig. 9, A and B). Acan protein was strongly detected in the resting, proliferating, prehypertrophic, and hypertrophic chondrocyte layers of wild-type mice, whereas it was only detected in a striped pattern and was virtually depleted in many areas in Galnt3 transgenic mice (Fig. 9, C–G). The degree of the reduction in Acan protein was dependent on the transgene expression level. In Galnt3 transgenic mice with high transgene expression, the reduction in Acan protein was extended to all chondrocyte layers (Fig. 9, C–G), whereas it was restricted to the resting chondrocyte layer in Galnt3 transgenic mice with low transgene expression (Fig. 9, H–J). The reverse relation of the levels of Acan protein and the transgene expression was also observed in the other five F0 transgenic mice, which were examined by immunohistochemistry (data not shown). To compare the amount of Acan protein, lysates were digested with chondroitinase ABC or with chondroitinase ABC, neuraminidase, and O-glycosidase and examined by Western blotting. In both methods, Acan protein was reduced in Galnt3 transgenic mice compared with wild-type mice in a manner dependent on the levels of transgene expression (Fig. 9, K and L). To examine the VVA reactivity in Acan protein, lysates treated with chondroitinase ABC were immunoprecipitated with Acan antibody, and the immunoprecipitated protein was reacted with VVA (Fig. 9M). VVA reactivity in Acan protein was greatly enhanced in Galnt3 transgenic mice compared with wild-type mice.
FIGURE 9.
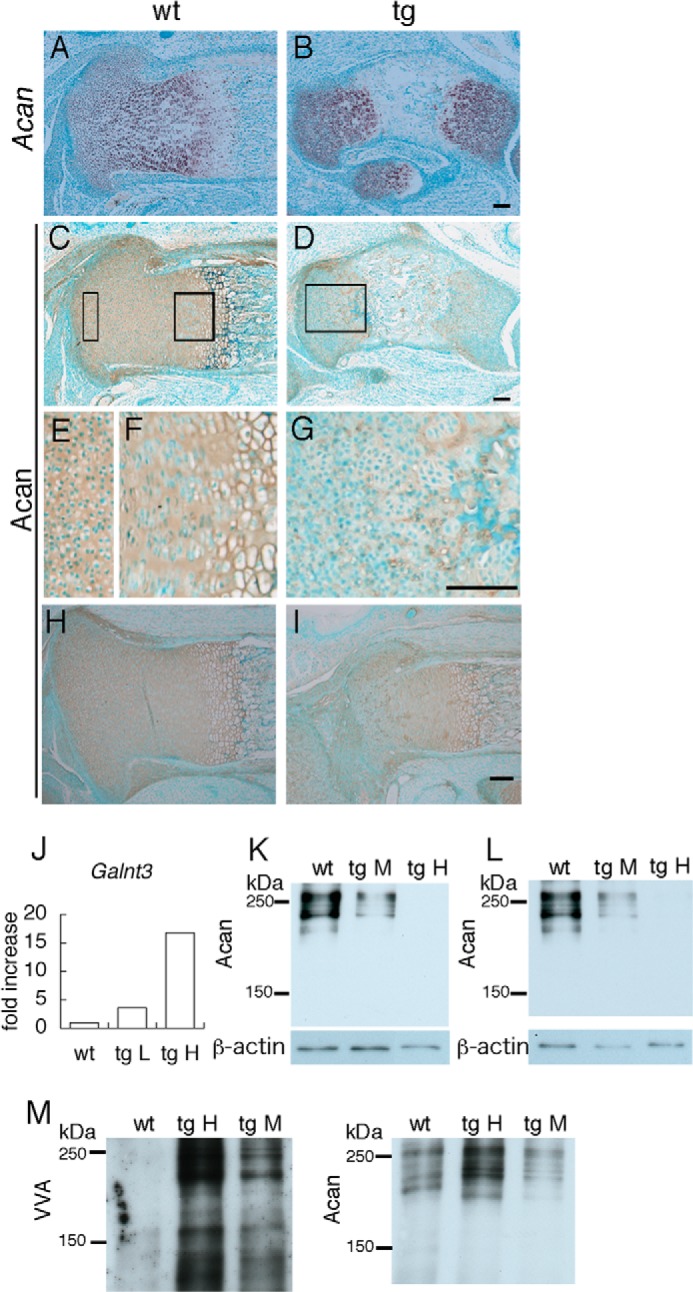
In situ hybridization, immunohistochemistry, Western blot, and immunoprecipitation. A and B, in situ hybridization of Acan mRNA in tibiae from wild-type (A) and Galnt3 transgenic (B) embryos at E18.5. C–I, Acan core protein immunostaining on tibia sections from wild-type (C, E, F, and H) and Galnt3 transgenic (D, G, and I) embryos at E18.5. The two boxed regions in C are magnified in E and F, and the boxed region in D is magnified in G. Scale bars, 100 μm. J, real-time RT-PCR analysis. Galnt3 expression in a wild-type mouse at E18.5, a Galnt3 transgenic mouse with low transgene expression shown in I (tg L), and a Galnt3 transgenic mouse with high transgene expression shown in B, D, and G (tg H) is shown. The value in the wild-type mouse was set as 1, and relative levels are shown. K and L, Western blots of proteins extracted from the cartilaginous skeletons of wild-type, Galnt3 transgenic embryo with medial transgene expression (tg M) and Galnt3 transgenic embryo with high transgene expression (tg H) at E15.5. Lysates were digested with chondroitinase ABC (K) or with chondroitinase ABC, neuraminidase, and O-glycosidase (L). Membranes were exposed to anti-Acan (top) and anti-actin (bottom) antibodies. M, VVA reactivity of Acan. Lysate treated with chondroitinase ABC was immunoprecipitated by anti-Acan antibody. The membrane was reacted with VVA or exposed to anti-Acan antibody.
Chondroitin Sulfate Was Reduced but the Elongation of Chondroitin Sulfate Repeats Was Not Severely Disturbed in the Cartilage of Galnt3 Transgenic Mice
Chondroitin sulfate is the predominant GAG attached to Acan. There are several types of chondroitin sulfate with sulfation at different positions. We quantified total chondroitin sulfate disaccharides, non-sulfated chondroitin disaccharides, chondroitin 4-sulfate disaccharides, and chondroitin 6-sulfate disaccharides in cartilage samples at E15.5. The levels of all of them were reduced in Galnt3 transgenic mice compared with wild-type mice (Fig. 10, A–D). Chondroitin sulfate disaccharides with sulfation at two positions were present at very low levels in both wild-type and Galnt3 transgenic mice (data not shown).
FIGURE 10.
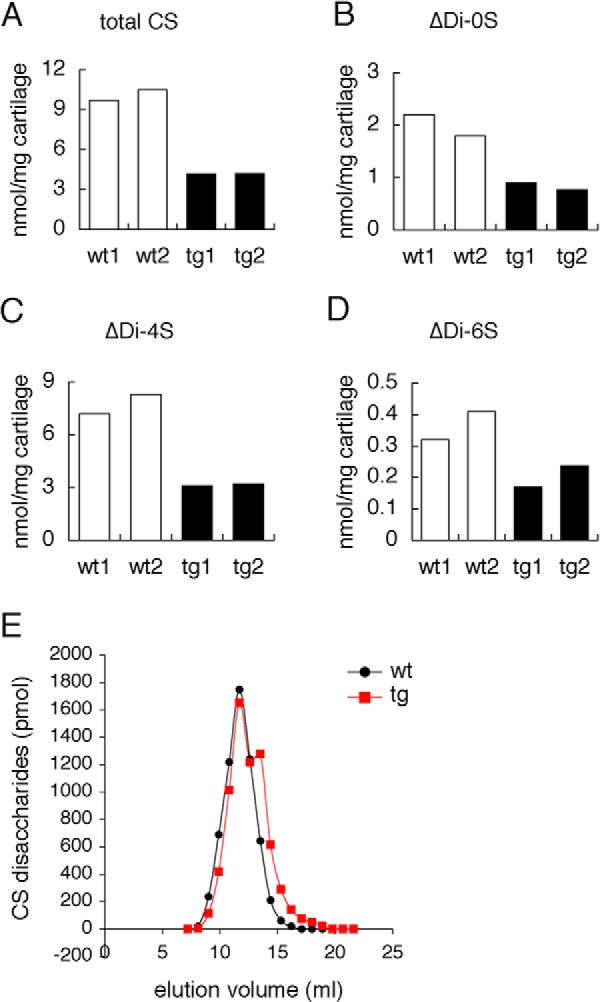
Quantification of chondroitin sulfate disaccharides in isolated GAGs from cartilaginous skeletons. A–D, chondroitin sulfate disaccharide content in isolated GAGs from cartilaginous skeletons of wild-type (wt1 and wt2) and Galnt3 transgenic (tg1 and tg2) embryos at E15.5. CS, chondroitin sulfate; ΔDi-0S, non-sulfated chondroitin; ΔDi-4S, chondroitin 4-sulfate; ΔDi-6S, chondroitin 6-sulfate. E, chondroitin sulfate chain length analysis. Chondroitin sulfate disaccharide content in the fractionated GAGs isolated from cartilaginous skeletons of wild-type (wt) and Galnt3 transgenic (tg) embryos at E15.5 was quantitated.
We quantitated chondroitin sulfate disaccharides after fractionation of GAGs, which had been isolated from cartilaginous skeletons at E15.5. The fractionated GAGs with higher molecular weight (fractions 10–12) contained lower amounts of chondroitin sulfate disaccharides, and the fractionated GAGs with lower molecular weight (fractions 15–19) contained higher amounts of chondroitin sulfate disaccharides in Galnt3 transgenic mice compared with the respective sample in wild-type mice. However, both samples from wild-type and Galnt3 transgenic mice showed the largest peak in the same fraction (fraction 13), which contained GAGs with a molecular mass of 47 kDa, and contained a similar amount of chondroitin sulfate disaccharides (Fig. 10E). These findings indicate that the elongation of chondroitin sulfate repeats was not severely disturbed in Galnt3 transgenic mice.
DISCUSSION
Runx2 is an essential transcription factor for chondrocyte maturation (17, 18). We found that Galnt3 is one of the downstream genes of Runx2 in chondrocytes. Although many Galnt family genes were expressed in cartilaginous tissues, Galnt3−/− mice showed dwarfism and had shortened limbs at E16.5. However, Galnt3−/− mice at 3 weeks of age had no apparent phenotypes in the growth plates, probably due to the rescue by the factors from bone marrow cells after invasion of blood vessels into the cartilage. Because the reduction in the length of mineralized area of the humeri at E16.5 indicates the retarded chondrocyte maturation, the delay in chondrocyte maturation is likely to be the reason for the shortened limbs at E16.5. Therefore, it is suggested that Galnt3 has a non-redundant function in chondrocyte maturation.
In Galnt3 transgenic mice, endochondral bones were shortened due to the deceleration of chondrocyte hypertrophy and reduced extracellular matrix, and the growth plates were disorganized. The cell cycle was accelerated, as shown by the increased BrdU uptake, but apoptosis was also increased. The level of Tn antigen was increased, and PAS staining of extracellular matrix was enhanced, but the amount of GAGs was reduced. Further, Tn antigen was increased, but GAGs were reduced in a major proteoglycan, Acan. The protein level of Acan was reduced, depending on the level of transgene expression, although Acan mRNA expression was not inhibited. These findings indicate that the phenotypes described above were caused, at least in part, by the increase of mucin-type O-glycans and the reduction of GAGs in Acan and also indicate that the enhanced mucin-type O-glycosylation reduced the amount of GAGs in Acan, leading to the reduction of Acan in the extracellular matrix.
Chondroitin sulfate chains are composed of sulfated disaccharide repeats of GalNAc and d-glucuronic acid (GlcUA). Chondroitin sulfate chains are attached to core proteins like Acan, through a tetrasaccharide linker. First, xylose is O-linked to a serine residue by a xylosyltransferase. Then two galactose residues and a glucuronic acid residue are added by the corresponding transferases to complete the linker. Synthesis of chondroitin sulfate starts with the transfer of a GalNAc residue to the tetrasaccharide linker. Chain elongation proceeds with the alternate addition of GlcUA and GalNAc residues in coordination with sulfation (4, 8). One possible mechanism behind the reduction of GAGs in Acan is that in the Golgi apparatus, where glycosylation by xylosyltransferases and Galnt3 occurs, Galnt3 competes with xylosyltransferases for serine residues on the core protein. As suggested by Gerlitz et al. (30), the addition of GalNAc to serine residues could prevent assemblage of the tetrasaccharide (GlcUAb1–3Galb1–3Galb1–4Xyl) linker and consequently the synthesis of chondroitin sulfate. This idea is also compatible with the finding that the level of chondroitin sulfate was reduced but the elongation of chondroitin sulfate chain was not severely impaired in Galn3 transgenic mice, because if the first step by xylosyltransferase is completed, the synthesis of chondroitin sulfate will proceed normally.
The secretion of Acan in Galnt3 transgenic mice could be compromised by the defective glycosylation, because the lack of chondroitin sulfate chain attachment to the core protein inhibits Acan secretion to the extracellular matrix (31, 32), and Acan core proteins that are insufficiently glycosylated may have accumulated in the smooth endoplasmic reticulum subcompartment, where they would undergo further degradation (33). Increased extracellular breakdown could also be the reason for the reduced amounts of Acan proteoglycan in the extracellular matrix. Indeed, mice deficient in CSGalNAcT1, an enzyme that participates in chondroitin sulfate synthesis, have reduced amounts of chondroitin sulfate and also reduced amounts of Acan core protein due to augmented degradation (34).
Galnt3 yields mucin-type O-glycosylated proteins, which are known to play important roles in cell adhesion (35), signal transduction (36, 37), protein trafficking (38, 39), and cell proliferation, apoptosis, and cancer (40–42). They also protect proteins from protease degradation (43–45). Therefore, the phenotype of Galnt3 transgenic mice should have been caused not only by the reduced amount of GAGs but also by the increased amount of mucin-type O-glycans. The expression of Ihh was increased in Galnt3 transgenic mice with medial transgene expression. It may have contributed to the increase of BrdU labeling in Galnt3 transgenic mice, because Ihh enhances chondrocyte proliferation (46). The decrease of Ihh expression in Galnt3 transgenic mouse with high transgene expression may be due to the severe inhibition of chondrocyte maturation, because Ihh is expressed in prehypertrophic chondrocytes. The reduction of Ihh expression may have reduced Pthlh expression, because Ihh regulates Prhlh expression (47). The levels of Bmp2 expression were inversely correlated with those of transgene expression. Therefore, the reduction of Bmp2 expression may have contributed to the delay in chondrocyte maturation in Galnt3 transgenic mice because Bmp2 plays a crucial role in chondrocyte maturation (48).
Overexpression of Galnt3 increased mucin-type O-glycosylation but reduced GAGs, probably due to competition with xylosyltransferases. Because many Galnt family proteins are expressed in chondrocytes, modification of protein glycosylation by competition of Galnt family proteins with xylosyltransferases may play an important role in the physiological functions of chondrocytes. Because keratan sulfate chains are added to mucin-type O-sugar chains (49), the mucin-type O-glycosylation will also increase keratan sulfate chains in Acan. Because many Galnt family genes showed a similar expression pattern with Galnt3 in cartilaginous tissues with the highest expression at E13.5, Galnt family proteins may modify Acan glycosylation during chondrocyte maturation. Galnt3 is also likely to regulate chondrocyte maturation, probably by specifically modifying the glycosylation of unknown proteins. Although the physiological meaning of mucin-type O-glycosylation of Acan has not been examined, our findings suggest that Galnt family proteins regulate chondrocyte proliferation and maturation by modifying the glycosylation of Acan.
This work was supported by a grant from the Ministry of Education, Culture, Sports, Science, and Technology, Japan, and the President's Discretionary Fund of Nagasaki University.
- GAG
- glycosaminoglycan
- Acan
- aggrecan
- VVA
- V. villosa agglutinin
- PAS
- periodic acid-Schiff
- En
- embryonic day n.
REFERENCES
- 1. Lefebvre V., Bhattaram P. (2010) Vertebrate skeletogenesis. Curr. Top. Dev. Biol. 90, 291–317 [DOI] [PMC free article] [PubMed] [Google Scholar]
- 2. Zhao Q., Eberspaecher H., Lefebvre V., De Crombrugghe B. (1997) Parallel expression of Sox9 and Col2a1 in cells undergoing chondrogenesis. Dev. Dyn. 209, 377–386 [DOI] [PubMed] [Google Scholar]
- 3. Gentili C., Cancedda R. (2009) Cartilage and bone extracellular matrix. Curr. Pharm. Des. 15, 1334–1348 [DOI] [PubMed] [Google Scholar]
- 4. Varki A., Cummings R. D., Esko J. D., Freeze H. H., Stanley P., Bertozzi C. R., Hart G. W., Etzler M. E. (eds) (2009) Essentials of Glycobiology, pp. 229–248, Cold Spring Harbor Laboratory Press, Cold Spring Harbor, NY: [PubMed] [Google Scholar]
- 5. Heinegård D. (2009) Proteoglycans and more from molecules to biology. Int. J. Exp. Pathol. 90, 575–586 [DOI] [PMC free article] [PubMed] [Google Scholar]
- 6. Chuang C. Y., Lord M. S., Melrose J., Rees M. D., Knox S. M., Freeman C., Iozzo R. V., Whitelock J. M. (2010) Heparan sulfate-dependent signaling of fibroblast growth factor 18 by chondrocyte-derived perlecan. Biochemistry 49, 5524–5532 [DOI] [PMC free article] [PubMed] [Google Scholar]
- 7. Cortes M., Baria A. T., Schwartz N. B. (2009) Sulfation of chondroitin sulfate proteoglycans is necessary for proper Indian hedgehog signaling in the developing growth plate. Development 136, 1697–1706 [DOI] [PMC free article] [PubMed] [Google Scholar]
- 8. Gandhi N. S., Mancera R. L. (2008) The structure of glycosaminoglycans and their interactions with proteins. Chem. Biol. Drug Des. 72, 455–482 [DOI] [PubMed] [Google Scholar]
- 9. Mundlos S., Olsen B. R. (1997) Heritable diseases of the skeleton. Part II: Molecular insights into skeletal development-matrix components and their homeostasis. FASEB J. 11, 227–233 [PubMed] [Google Scholar]
- 10. Schwartz N. B., Domowicz M. (2002) Chondrodysplasias due to proteoglycan defects. Glycobiology 12, 57R–68R [DOI] [PubMed] [Google Scholar]
- 11. Bennett E. P., Mandel U., Clausen H., Gerken T. A., Fritz T. A., Tabak L. A. (2012) Control of mucin-type O-glycosylation: a classification of the polypeptide GalNAc-transferase gene family. Glycobiology 22, 736–756 [DOI] [PMC free article] [PubMed] [Google Scholar]
- 12. Frishberg Y., Ito N., Rinat C., Yamazaki Y., Feinstein S., Urakawa I., Navon-Elkan P., Becker-Cohen R., Yamashita T., Araya K., Igarashi T., Fujita T., Fukumoto S. (2007) Hyperostosis-hyperphosphatemia syndrome: a congenital disorder of O-glycosylation associated with augmented processing of fibroblast growth factor 23. J. Bone Miner. Res. 22, 235–242 [DOI] [PubMed] [Google Scholar]
- 13. Ichikawa S., Guigonis V., Imel E. A., Courouble M., Heissat S., Henley J. D., Sorenson A. H., Petit B., Lienhardt A., Econs M. J. (2007) Novel GALNT3 mutations causing hyperostosis-hyperphosphatemia syndrome result in low intact fibroblast growth factor 23 concentrations. J. Clin. Endocrinol. Metab. 92, 1943–1947 [DOI] [PubMed] [Google Scholar]
- 14. Ichikawa S., Sorenson A. H., Austin A. M., Mackenzie D. S., Fritz T. A., Moh A., Hui S. L., Econs M. J. (2009) Ablation of the Galnt3 gene leads to low-circulating intact fibroblast growth factor 23 (Fgf23) concentrations and hyperphosphatemia despite increased Fgf23 expression. Endocrinology 150, 2543–2550 [DOI] [PMC free article] [PubMed] [Google Scholar]
- 15. Olauson H., Krajisnik T., Larsson C., Lindberg B., Larsson T. E. (2008) A novel missense mutation in GALNT3 causing hyperostosis-hyperphosphataemia syndrome. Eur. J. Endocrinol. 158, 929–934 [DOI] [PubMed] [Google Scholar]
- 16. Topaz O., Shurman D. L., Bergman R., Indelman M., Ratajczak P., Mizrachi M., Khamaysi Z., Behar D., Petronius D., Friedman V., Zelikovic I., Raimer S., Metzker A., Richard G., Sprecher E. (2004) Mutations in GALNT3, encoding a protein involved in O-linked glycosylation, cause familial tumoral calcinosis. Nat. Genet. 36, 579–581 [DOI] [PubMed] [Google Scholar]
- 17. Inada M., Yasui T., Nomura S., Miyake S., Deguchi K., Himeno M., Sato M., Yamagiwa H., Kimura T., Yasui N., Ochi T., Endo N., Kitamura Y., Kishimoto T., Komori T. (1999) Maturational disturbance of chondrocytes in Cbfa1-deficient mice. Dev. Dyn. 214, 279–290 [DOI] [PubMed] [Google Scholar]
- 18. Kim I. S., Otto F., Zabel B., Mundlos S. (1999) Regulation of chondrocyte differentiation by Cbfa1. Mech. Dev. 80, 159–170 [DOI] [PubMed] [Google Scholar]
- 19. Enomoto H., Furuichi T., Zanma A., Yamana K., Yoshida C., Sumitani S., Yamamoto H., Enomoto-Iwamoto M., Iwamoto M., Komori T. (2004) Runx2 deficiency in chondrocytes causes adipogenic changes in vitro. J. Cell Sci. 117, 417–425 [DOI] [PubMed] [Google Scholar]
- 20. Enomoto H., Shiojiri S., Hoshi K., Furuichi T., Fukuyama R., Yoshida C. A., Kanatani N., Nakamura R., Mizuno A., Zanma A., Yano K., Yasuda H., Higashio K., Takada K., Komori T. (2003) Induction of osteoclast differentiation by Runx2 through receptor activator of nuclear factor-κB ligand (RANKL) and osteoprotegerin regulation and partial rescue of osteoclastogenesis in Runx2−/− mice by RANKL transgene. J. Biol. Chem. 278, 23971–23977 [DOI] [PubMed] [Google Scholar]
- 21. Young W. W., Jr., Holcomb D. R., Ten Hagen K. G., Tabak L. A. (2003) Expression of UDP-GalNAc:polypeptide N-acetylgalactosaminyltransferase isoforms in murine tissues determined by real-time PCR: a new view of a large family. Glycobiology 13, 549–557 [DOI] [PubMed] [Google Scholar]
- 22. Miyazaki T., Mori M., Yoshida C. A., Ito C., Yamatoya K., Moriishi T., Kawai Y., Komori H., Kawane T., Izumi S. I., Toshimori K., Komori T. (2013) Galnt3 deficiency disrupts acrosome formation and leads to oligoasthenoteratozoospermia. Histochem. Cell Biol. 139, 339–354 [DOI] [PubMed] [Google Scholar]
- 23. Krebsbach P. H., Nakata K., Bernier S. M., Hatano O., Miyashita T., Rhodes C. S., Yamada Y. (1996) Identification of a minimum enhancer sequence for the type II collagen gene reveals several core sequence motifs in common with the link protein gene. J. Biol. Chem. 271, 4298–4303 [DOI] [PubMed] [Google Scholar]
- 24. Ueta C., Iwamoto M., Kanatani N., Yoshida C., Liu Y., Enomoto-Iwamoto M., Ohmori T., Enomoto H., Nakata K., Takada K., Kurisu K., Komori T. (2001) Skeletal malformations caused by overexpression of Cbfa1 or its dominant negative form in chondrocytes. J. Cell Biol. 153, 87–100 [DOI] [PMC free article] [PubMed] [Google Scholar]
- 25. Zhou G., Garofalo S., Mukhopadhyay K., Lefebvre V., Smith C. N., Eberspaecher H., de Crombrugghe B. (1995) A 182 bp fragment of the mouse pro α 1(II) collagen gene is sufficient to direct chondrocyte expression in transgenic mice. J. Cell Sci. 108, 3677–3684 [DOI] [PubMed] [Google Scholar]
- 26. Komori T., Yagi H., Nomura S., Yamaguchi A., Sasaki K., Deguchi K., Shimizu Y., Bronson R. T., Gao Y. H., Inada M., Sato M., Okamoto R., Kitamura Y., Yoshiki S., Kishimoto T. (1997) Targeted disruption of Cbfa1 results in a complete lack of bone formation owing to maturational arrest of osteoblasts. Cell 89, 755–764 [DOI] [PubMed] [Google Scholar]
- 27. Kato K., Takeuchi H., Ohki T., Waki M., Usami K., Hassan H., Clausen H., Irimura T. (2008) A lectin recognizes differential arrangements of O-glycans on mucin repeats. Biochem. Biophys. Res. Commun. 371, 698–701 [DOI] [PubMed] [Google Scholar]
- 28. Wu A. M., Sugii S. J., Herp A. (1988) A guide for carbohydrate specificities of lectins. Adv. Exp. Med. Biol. 228, 819–847 [DOI] [PubMed] [Google Scholar]
- 29. Kiviranta I., Tammi M., Jurvelin J., Säämänen A. M., Helminen H. J. (1985) Demonstration of chondroitin sulphate and glycoproteins in articular cartilage matrix using periodic acid-Schiff (PAS) method. Histochemistry 83, 303–306 [DOI] [PubMed] [Google Scholar]
- 30. Gerlitz B., Hassell T., Vlahos C. J., Parkinson J. F., Bang N. U., Grinnell B. W. (1993) Identification of the predominant glycosaminoglycan-attachment site in soluble recombinant human thrombomodulin: potential regulation of functionality by glycosyltransferase competition for serine 474. Biochem. J. 295, 131–140 [DOI] [PMC free article] [PubMed] [Google Scholar]
- 31. Chen L., Wu Y., Lee V., Kiani C., Adams M. E., Yao Y., Yang B. B. (2002) The folded modules of aggrecan G3 domain exert two separable functions in glycosaminoglycan modification and product secretion. J. Biol. Chem. 277, 2657–2665 [DOI] [PubMed] [Google Scholar]
- 32. Kiani C., Lee V., Cao L., Chen L., Wu Y., Zhang Y., Adams M. E., Yang B. B. (2001) Roles of aggrecan domains in biosynthesis, modification by glycosaminoglycans and product secretion. Biochem. J. 354, 199–207 [DOI] [PMC free article] [PubMed] [Google Scholar]
- 33. Alonso M., Hidalgo J., Hendricks L., Velasco A. (1996) Degradation of aggrecan precursors within a specialized subcompartment of the chicken chondrocyte endoplasmic reticulum. Biochem. J. 316, 487–495 [DOI] [PMC free article] [PubMed] [Google Scholar]
- 34. Sato T., Kudo T., Ikehara Y., Ogawa H., Hirano T., Kiyohara K., Hagiwara K., Togayachi A., Ema M., Takahashi S., Kimata K., Watanabe H., Narimatsu H. (2011) Chondroitin sulfate N-acetylgalactosaminyltransferase 1 is necessary for normal endochondral ossification and aggrecan metabolism. J. Biol. Chem. 286, 5803–5812 [DOI] [PMC free article] [PubMed] [Google Scholar]
- 35. Fukuda M. (2002) Roles of mucin-type O-glycans in cell adhesion. Biochim. Biophys. Acta 1573, 394–405 [DOI] [PubMed] [Google Scholar]
- 36. Carraway K. L., Ramsauer V. P., Haq B., Carothers Carraway C. A. (2003) Cell signaling through membrane mucins. BioEssays 25, 66–71 [DOI] [PubMed] [Google Scholar]
- 37. Singh P. K., Hollingsworth M. A. (2006) Cell surface-associated mucins in signal transduction. Trends Cell Biol. 16, 467–476 [DOI] [PubMed] [Google Scholar]
- 38. Breuza L., Garcia M., Delgrossi M. H., Le Bivic A. (2002) Role of the membrane-proximal O-glycosylation site in sorting of the human receptor for neurotrophins to the apical membrane of MDCK cells. Exp. Cell Res. 273, 178–186 [DOI] [PubMed] [Google Scholar]
- 39. Zheng X., Sadler J. E. (2002) Mucin-like domain of enteropeptidase directs apical targeting in Madin-Darby canine kidney cells. J. Biol. Chem. 277, 6858–6863 [DOI] [PubMed] [Google Scholar]
- 40. Patsos G., Robbe-Masselot C., Klein A., Hebbe-Viton V., Martin R. S., Masselot D., Graessmann M., Paraskeva C., Gallagher T., Corfield A. (2007) O-Glycan regulation of apoptosis and proliferation in colorectal cancer cell lines. Biochem. Soc. Trans. 35, 1372–1374 [DOI] [PubMed] [Google Scholar]
- 41. Taniuchi K., Cerny R. L., Tanouchi A., Kohno K., Kotani N., Honke K., Saibara T., Hollingsworth M. A. (2011) Overexpression of GalNAc-transferase GalNAc-T3 promotes pancreatic cancer cell growth. Oncogene 30, 4843–4854 [DOI] [PMC free article] [PubMed] [Google Scholar]
- 42. Wu Y. M., Liu C. H., Hu R. H., Huang M. J., Lee J. J., Chen C. H., Huang J., Lai H. S., Lee P. H., Hsu W. M., Huang H. C., Huang M. C. (2011) Mucin glycosylating enzyme GALNT2 regulates the malignant character of hepatocellular carcinoma by modifying the EGF receptor. Cancer Res. 71, 7270–7279 [DOI] [PubMed] [Google Scholar]
- 43. Garner B., Merry A. H., Royle L., Harvey D. J., Rudd P. M., Thillet J. (2001) Structural elucidation of the N- and O-glycans of human apolipoprotein(a): role of O-glycans in conferring protease resistance. J. Biol. Chem. 276, 22200–22208 [DOI] [PubMed] [Google Scholar]
- 44. Kato K., Jeanneau C., Tarp M. A., Benet-Pagès A., Lorenz-Depiereux B., Bennett E. P., Mandel U., Strom T. M., Clausen H. (2006) Polypeptide GalNAc-transferase T3 and familial tumoral calcinosis. Secretion of fibroblast growth factor 23 requires O-glycosylation. J. Biol. Chem. 281, 18370–18377 [DOI] [PubMed] [Google Scholar]
- 45. Schjoldager K. T., Clausen H. (2012) Site-specific protein O-glycosylation modulates proprotein processing: deciphering specific functions of the large polypeptide GalNAc-transferase gene family. Biochim. Biophys. Acta 1820, 2079–2094 [DOI] [PubMed] [Google Scholar]
- 46. St-Jacques B., Hammerschmidt M., McMahon A. P. (1999) Indian hedgehog signaling regulates proliferation and differentiation of chondrocytes and is essential for bone formation. Genes Dev. 13, 2072–2086 [DOI] [PMC free article] [PubMed] [Google Scholar]
- 47. Vortkamp A., Lee K., Lanske B., Segre G. V., Kronenberg H. M., Tabin C. J. (1996) Regulation of rate of cartilage differentiation by Indian hedgehog and PTH-related protein. Science 273, 613–622 [DOI] [PubMed] [Google Scholar]
- 48. Shu B., Zhang M., Xie R., Wang M., Jin H., Hou W., Tang D., Harris S. E., Mishina Y., O'Keefe R. J., Hilton M. J., Wang Y., Chen D. (2011) BMP2, but not BMP4, is crucial for chondrocyte proliferation and maturation during endochondral bone development. J. Cell Sci. 124, 3428–3440 [DOI] [PMC free article] [PubMed] [Google Scholar]
- 49. Lohmander L. S., De Luca S., Nilsson B., Hascall V. C., Caputo C. B., Kimura J. H., Heinegard D. (1980) Oligosaccharides on proteoglycans from the swarm rat chondrosarcoma. J. Biol. Chem. 255, 6084–6091 [PubMed] [Google Scholar]