Abstract
The early genes are a key group of ecdysone targets that function at the top of the signaling hierarchy. In the presence of ecdysone, early genes exhibit a highly characteristic rapid and powerful induction that represents a primary response. Multiple isoforms encoded by early genes then coordinate the activation of a larger group of late genes. While the general mechanism of ecdysone-dependent transcription is well characterized, it is not known whether a distinct mechanism governs the hormonal response of early genes. We previously found that one of the Drosophila early genes, E75, harbors multiple functional ecdysone response elements (EcREs). In this study we extended the analysis to Broad and E74 and found that EcRE multiplicity is a general feature of the early genes. Since most of the EcREs within early gene loci are situated distantly from promoters, we employed the chromosome conformation capture method to determine whether higher order chromatin structure facilitates hormonal activation. For each early gene we detected chromatin loops that juxtapose their promoters and multiple distant EcREs prior to ecdysone activation. Our findings suggest that higher order chromatin structure may serve as an important mechanism underlying the distinct response of early genes to ecdysone.
INTRODUCTION
Ecdysteroids are critical regulators of insect developmental transitions (1). In Drosophila, pulses of the steroid hormone 20-hydroxyecdysone (hereafter ecdysone) initiate a series of events that, during larval development, result in molting at the end of the first and second instars and metamorphosis at the end of the third instar.
Ecdysone operates at the level of gene expression, initiating a transcriptional cascade that has been extensively studied at the onset of metamorphosis. Ecdysone directly and immediately activates the expression of a small set of ‘early genes’ that include E75, Broad and E74. The early genes encode transcription factors that repress their own transcription and activate a large number of downstream effector genes (2). Consistent with their role at the top of the genetic hierarchy, the early genes are essential to development and null mutations lead to severe and lethal defects (2,3). Like other steroid hormones, ecdysone mediates gene activation through members of the nuclear receptor superfamily. A heterodimer composed of two nuclear receptor proteins, ecdysone receptor (EcR) and ultraspiracle (USP), binds to an ecdysone response element (EcRE) and with ecdysone bound in the ligand pocket of EcR recruits a variety of coactivators to stimulate transcription (2,3). Correspondingly, EcREs have been identified at the promoters of many ecdysone-responsive genes, typically within 1–3 kb of their transcription start site (TSS) (3).
Despite the wealth of information surrounding ecdysone regulation, the molecular basis for the activation of early genes has never been fully addressed, since until recently no EcREs had been identified at these genes (4). This represents a critical gap in our understanding of the ecdysone signaling pathway, not only because of the importance of early genes in the genetic cascade but also because of their distinct regulatory characteristics. Early genes exhibit considerably widespread activation in both larval and imaginal tissues (5). This feature is in contrast with hundreds of ecdysone-responsive genes that display a tissue-specific pattern of expression during metamorphosis (6). Early genes are also remarkably large (50–100 kb) and transcriptionally complex, encoding multiple isoforms through alternative promoter usage and/or alternative splicing (7–9). Finally, even with their size early genes exhibit a rapid and powerful response to ecdysone. In salivary glands, for example, the decondensation of actively transcribed chromatin—known as ‘puffing’—is visible at early gene loci within minutes of ecdysone application (10). Studies in tissue and cell culture have shown that ecdysone stimulates early gene transcript levels to rise several orders magnitude within 1–2 h (11,12). Because of these unique features, there is a strong possibility that studies of the early genes may uncover additional insights into ecdysone regulation.
Mammalian systems provide evidence that the 3D architecture of chromatin is critical to transcriptional regulation. Studies using chromosome conformation capture (3C) and related techniques have found that physical interactions between regulatory elements can occur at great distances, across hundreds of kilobases and even between different chromosomes (13). Genome-wide studies of mammalian nuclear receptors have found that the majority of binding sites are located far from any genes. Nevertheless, they are able to find their target promoters through the looping of chromatin, thereby enabling long-range physical interactions between binding sites and promoters (14,15). We previously demonstrated that the Drosophila E75 gene contains multiple EcREs located far from any of the E75 promoters (4). While this raises the possibility that ecdysone signaling may also involve chromatin looping, so far it is not known whether distal ecdsyone response elements can associate with target promoters through long-distance interactions.
In the current study, we extend our identification of EcREs to the Broad and E74 loci, demonstrating that in early genes the multiplicity of EcREs is a general feature. Importantly, we show for the first time that EcREs are involved in long-range interactions with the early gene target promoters, and that multiple elements may cooperate in vivo to regulate the activation of early gene transcription.
MATERIALS AND METHODS
Cell culture
Drosophila S2 cells were cultured in Schneider's medium (Gibco) supplemented with 10% fetal bovine serum at 25°C. For ecdysone induction experiments, 20-hydroxyecdysone (Sigma) dissolved in water was added to cells at a 1×10⁻⁶ M final concentration.
Identification of EcREs
Identification of conserved nucleotide sequences at the E75, Broad and E74 loci was performed as described previously (4,16). Briefly, composite alignments were generated using EvoPrinterHD (17) to identify sequences conserved among at least 11 Drosophila genomes, including Drosophila melanogaster. Pattern Locator (18) was used to screen for matches to the EcRE consensus sequence, taking into account the degeneracy of the response element as described previously (4). Candidate EcREs were those that matched the consensus and were conserved in at least 11 of the 12 nucleotides comprising the half-sites (conservation was not considered for the central spacing nucleotide), except in cases where particular species were excluded from analysis owing to gaps in the genomic sequence data.
Chromatin immunoprecipitation
A total of 3×10⁷ S2 cells were treated with aqueous solvent or 1×10⁻⁶ M ecdysone for 2 h. Chromatin immunoprecipitation was then performed as described previously (4) using monoclonal antibodies targeting EcR (DDA2.7, Developmental Studies Hybridoma Bank, University of Iowa). Enrichment was measured (immunoprecipitated versus input DNA) in three independent experiments by quantitative polymerase chain reaction (qPCR). Amplicon specificity was confirmed by separation of post-PCR samples on 2% agarose gel. Amplification primers are presented in Supplementary Table S1. Immunoprecipitation using non-specific immunoglobulin G showed negligible enrichment at each site studied (data not shown).
Chromosome conformation capture
3C procedure
S2 cells were grown to a density of 3×10⁷ and cross-linked with 2% formaldehyde in serum-free Schneider's Drosophila medium (Gibco) for 15 min at room temperature. For tissues, approximately 80 larvae were collected within 24 h after molting to the third instar (‘mid-third’) or 40 larvae during the wandering stage (‘late-third’). Tissues were dissected in 1 × phosphate buffered saline (PBS), and cross-linked with 2% formaldehyde in 1× PBS for 15 min at room temperature. Cross-linking was quenched by addition of glycine (0.125 M final concentration), followed by centrifugation (cells: 1600 revolutions per minute [rpm], 10 min, 4°C; tissues: 5000 rpm, 10 min, 4°C).
All samples were resuspended in lysis buffer (10 mM Tris-Cl pH 8.0, 10 mM NaCl, 0.2% Igepal and Roche Complete Mini protease inhibitors). Lysis was performed with 15 strokes using a Dounce homogenizer (tight pestle), followed by incubation on ice for 10 min, followed by an additional 15 strokes with the Dounce homogenizer. Lysed samples containing 1×10⁷ cell equivalents were centrifuged (5000 rpm, 5 min, 4°C), rinsed once with restriction buffer (Buffer #2 for HindIII, DpnII Buffer for DpnII; New England Biolabs), and suspended again in restriction buffer. Sodium dodecyl sulphate (SDS) was added to a final concentration of 0.2%, and incubation continued for 90 min at 37°C while shaking at 900 rpm. Triton X-100 was then added to 1.2% final concentration with 1× T4 ligase buffer (New England Biolabs), and incubation was continued (90 min, 37°C, 900 rpm). For this step, the 1× T4 ligase buffer was included to enhance restriction efficiency (19). Bovine serum albumin (BSA, 1× final) plus 500 U of HindIII or 1250 U of DpnII (New England Biolabs) were added and samples were incubated overnight at 37°C with continuous shaking at 900 rpm. The enzyme was inactivated by incubating with SDS (1.6% final) for 30 min at 37°C with shaking at 900 rpm. Samples were transferred to 8 ml ligation buffer (1× T4 ligase buffer, 1× BSA, 1% Triton X-100) and incubated for 90 min at 37°C with gentle shaking (175 rpm). Samples were then equilibrated at 16°C. Ligation was performed at 16°C for 5 h with 4000 U of T4 ligase (New England Biolabs), followed by 30 min at room temperature. After ligation, cross-linking was reversed at 65°C overnight in the presence of 500 U Proteinase K (New England Biolabs). DNA was purified by RNAse A treatment, phenol:chloroform extraction and ethanol precipitation, and dissolved in 250 μl of 10 mM Tris-Cl, pH 7.5. The yield was estimated on a 1% agarose gel.
Measurement of 3C interaction frequency
To measure cross-linking frequency, DNA templates prepared by the 3C procedure from at least three independent experiments were amplified by qPCR using FastStart SYBR green (Roche). Thermocycling (95°C 15 s, 60°C 1 min) was performed for 40 cycles using the Applied Biosystems 7300 Real-time PCR system. For each reaction, 5 ng of the 3C template was used. Cross-linking frequency between anchor-test pairs was measured relative to control template generated from restriction/ligation of BAC DNA clones RP98–17A14 (E75), RP98–33A8 (Broad) and RP98–44K7 (E74). All interactions were normalized to internal primers, not spanning any HindIII or DpnII sites, at the rp49 locus.
To identify significant interactions, the cross-linking frequency between the anchor fragment (containing the anchor primer) and each test fragment (containing the test primer) was compared by Student's t-test to the adjacent test fragments (statistical data not shown). Interactions were called only if the interaction between the anchor fragment and corresponding test fragment represented a statistically significant increase of cross-linking frequency. In cases where a local peak of cross-linking frequency is followed by a statistically insignificant change in the cross-linking frequency in the next fragment, both fragments were considered to interact with the anchor fragment.
3C controls
To validate the 3C analysis, several controls were performed (20,21). A no-formaldehyde control was used to confirm interactions were cross-linking-specific. Restriction efficiency of each sample was monitored on a 1% agarose gel and, for each restriction site analyzed, was calculated using aliquots taken before and after restriction digest, using the formula [%R = 100 − 100/2∧((CtR − CtC)D − (CtR − CtC)UND)] as described in (21). In each sample restriction efficiency was greater than 70% for HindIII-based experiments and greater than 60% for all DpnII-based experiments, and all sites showed similar restriction efficiencies. Ligation efficiency was also monitored by agarose gel and by measuring control interactions at the Actin5C and rp49 loci. The control interactions at these two loci also indicated that there were no significant differences in cross-linking frequency in the presence/absence of ecdysone (S2 cells) or between different larval tissues, suggesting that there were no overall differences in ligation efficiency among the different sample preparations (data not shown). Finally, amplicon specificity was confirmed for all 3C interactions by separation of post-PCR products on a 2% agarose gel. Amplification primers for HindIII and DpnII analysis are presented in Supplementary Tables S2 and S3, respectively. Note that, for a given locus, all primers follow the same strand orientation.
RNA interference
RNA interference (RNAi) was performed in S2 cells as described previously (16). Briefly, dsRNA was made to target a 952 basepair region common to all EcR transcripts. Cells were incubated with dsRNA for 3 days, reaching a cell density of 3×10⁷. Primers used to construct pGEMt plasmids for generation of EcR dsRNA are as follows: 5′-ATG AGA ACG AGA GCC AAA CGG-3′ and 5′-AGC TGT GGC TGT GGT TGA ATC-3′.
RNA preparation and qRT-PCR
Purification of total RNA from S2 cells was performed as described previously (16). Transcript abundance was measured relative to the untreated control sample and normalized to the rp49 transcript, using the comparative Ct method (22). Amplicon specificity was confirmed by separation of post-PCR samples on 2% agarose gel. Primers were designed to target individual isoforms for the E75 and E74 genes. For Broad, primers were designed to target a sequence in the core region. Primer sequences are available upon request.
Identification of promoter–EcRE interactions in Kc cells
Interactions in Kc cells between promoters of ecdysone-inducible genes and EcREs were calculated from publicly available data, using the genome-wide distribution of EcR binding sites in Kc cells identified by the DamID method (25; GEO accession GSE9156), ecdysone-inducible transcripts identified by microarray (25; GEO accession GSE11625) and the genome-wide interactome derived from Hi-C (26; GEO accession GSE38468).
Aligned, paired reads taken from the HindIII-based Hi-C analysis (performed in Kc cells under hormone-free conditions) were used to determine significant genome-wide interactions in Kc cells at a 4 kb resolution using HOMER (23). This resolution was chosen because the median restriction fragment length for HindIII in the Drosophila genome is 3.6 kb, and because the EcR binding site distribution was determined at a 4 kb resolution (24). TSS coordinates were then collected from genes identified in microarray and arranged in four groups according to their ecdysone-mediated activation at 1, 3, 6, or 12 h of hormone treatment (24). In total, 330 TSSs were examined (51, 142, 31, and 106, respectively). Promoters participating in looping interactions under hormone-free conditions were identified through the intersection of each promoter coordinate (4 kb upstream and downstream from the TSS) with the Hi–C interaction coordinates using BEDtools (25). To identify interactions between each TSS and individual EcR binding sites, the coordinates of looping interactions containing TSS from ecdysone target genes were intersected with coordinates of EcR/USP binding sites. Promoters directly bound by EcR/USP were identified by intersecting TSS coordinates (4 kb upstream and downstream) with EcR/USP binding site coordinates.
RESULTS
Activation of early genes by ecdysone in S2 cells
At the onset of metamorphosis, ecdysone exerts a rapid and synchronous transcriptional activation of early genes (5). To confirm that in S2 cells the early genes exhibit a comparable response, cells were treated with ecdysone for 0, 1, 2, or 4 h, and the expression of three classic early genes—E75, Broad and E74—was examined by qRT-PCR. All three genes respond with strong activation within the first h of treatment, although the activation profile varies among different isoforms (Figure 1). For the E75 gene, E75A and E75C transcripts reach peak abundance by 1–2 h, while E75B continues to accumulate up to 4 h (Figure 1A). Broad transcripts reach peak by 2 h (Figure 1B). For the E74 gene, transcript E74B reaches peak abundance by 1 h, while the E74A transcript accumulates throughout the 4 h period (Figure 1C). Despite these differences in the profiles, all of the early gene transcripts (except E74A) exhibit a sharp, 10- to 50-fold increase in abundance within 1–2 h of ecdysone treatment (Supplementary Table S4). As a reference, we also examined the activation profile of the classic ecdysone target gene hsp27. Notably, while the hsp27 transcript responds to ecdysone within 1 h, its accumulation is very modest and gradual (Figure 1D). Overall, the findings confirm that the early genes display a rapid and synchronous activation by ecdysone in S2 cells, reminiscent of the in vivo response.
Figure 1.
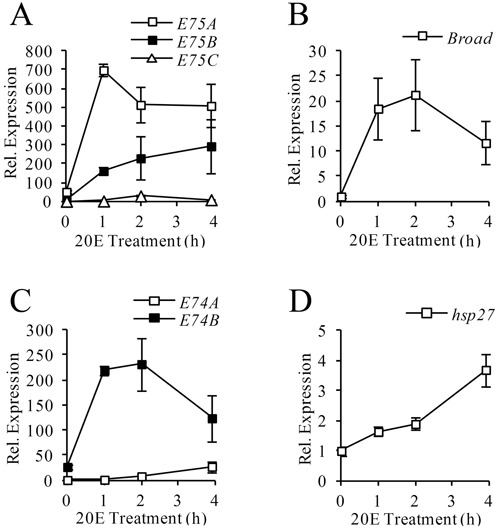
Transcriptional response to ecdysone in S2 cells. S2 Cells were treated with 1×10⁻⁶ M ecdysone for the time indicated (x-axis). Total RNA was extracted and transcript abundance was measured by qRT-PCR for E75(A), Broad(B), E74(C) and hsp27(D). Expression was normalized to the rp49 transcript and in each panel is shown relative to the 0-h sample with the lowest transcript abundance (y-axis). Bars indicate mean ± SEM from at least three independent experiments.
Multiple functional EcREs at early gene loci
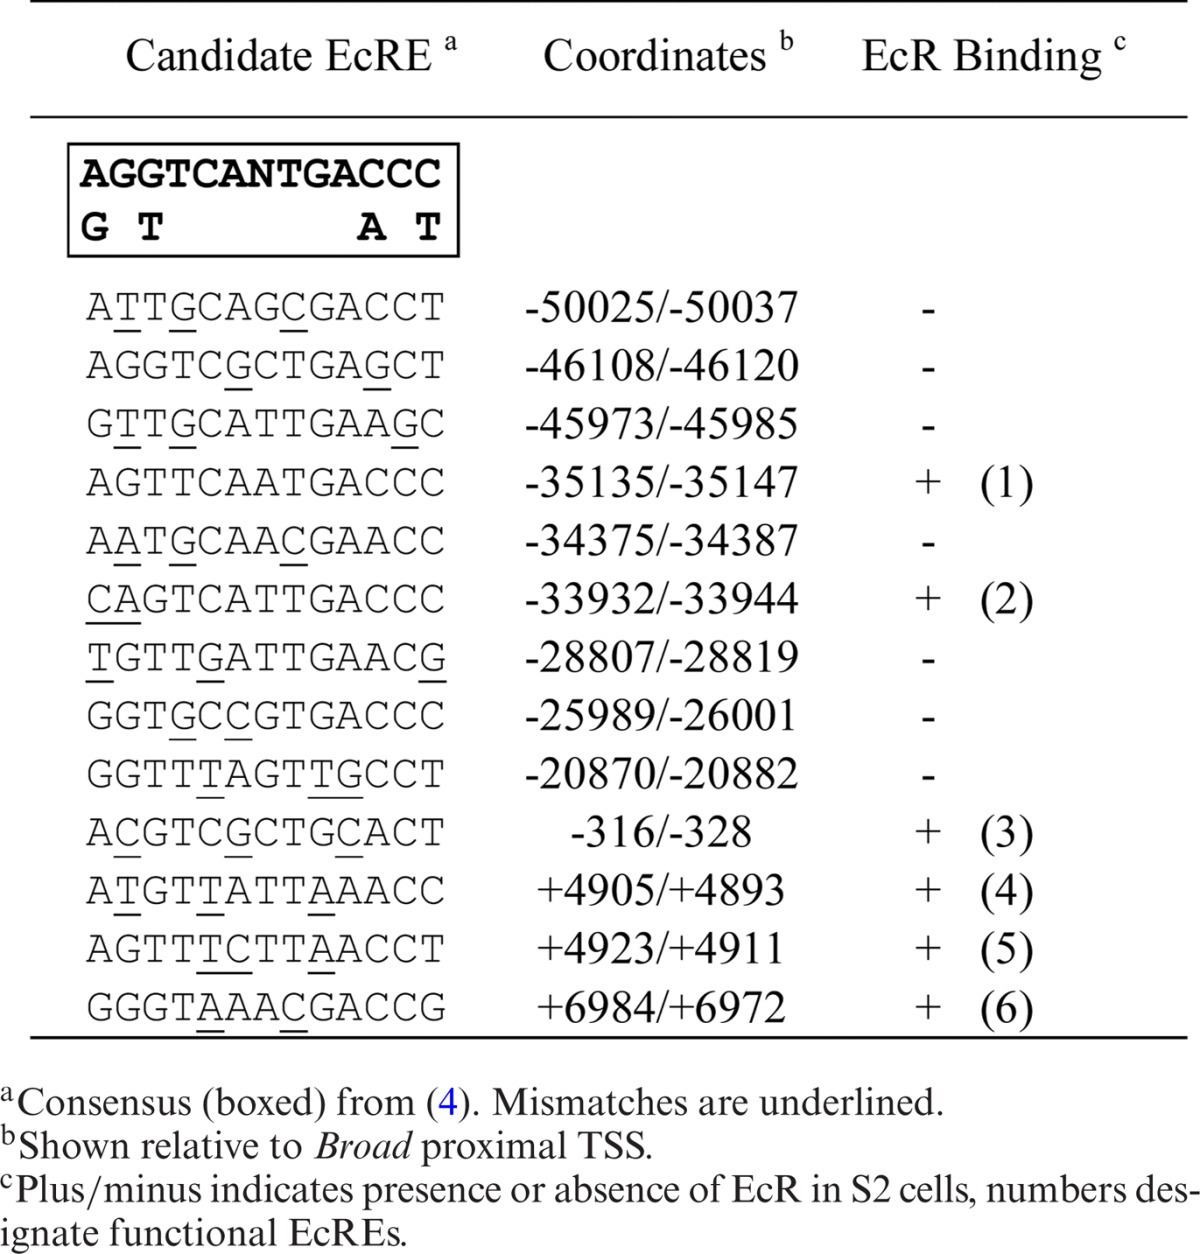
Previously, we found that the 60-kb intron between the E75A and E75C promoters contains multiple functional EcREs distributed among four enhancers (4). Since this was the first and only example of an early gene possessing multiple EcREs, we were interested to determine whether EcRE multiplicity is a general feature of the early genes. To accomplish this we first searched selected introns from each early gene (Figure 2) for highly conserved non-coding sequences using EvoPrinterHD (17) and then searched for potential EcREs using the degenerated consensus sequence (4). We focused our search on the intronic regions, since we previously found that E75 harbors functional EcREs in its introns and because most of the 5′ and 3′ ends of early genes are closely flanked by other genes (data not shown). Tables 1-3 list the candidate response elements identified for E75, Broad and E74, respectively. A total of 17 potential elements were identified in the introns between the E75A and E75B promoters, 10 and 3 in the introns upstream and downstream, respectively, from the Broad proximal promoter, and 15 between the E74B and E74A promoters.
Figure 2.
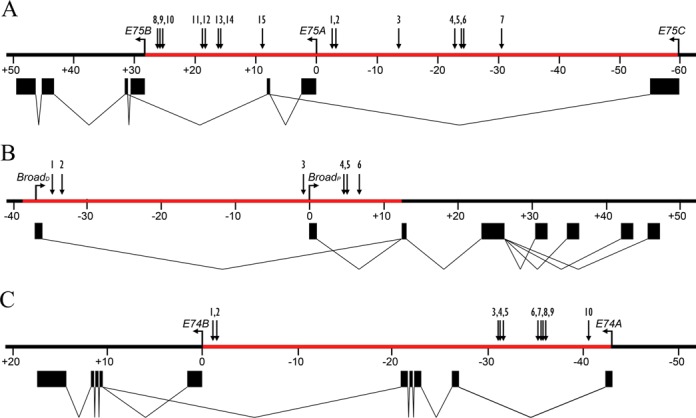
Structure of the E75 (A), Broad (B) and E74 (C) early genes. Black boxes indicate exons and TSS locations are indicated by horizontal arrows. Gene regions analyzed for EcREs are highlighted in red; numbered arrows indicate EcREs identified in this study and in (15).
Table 1.
E75 ecdysone response elements
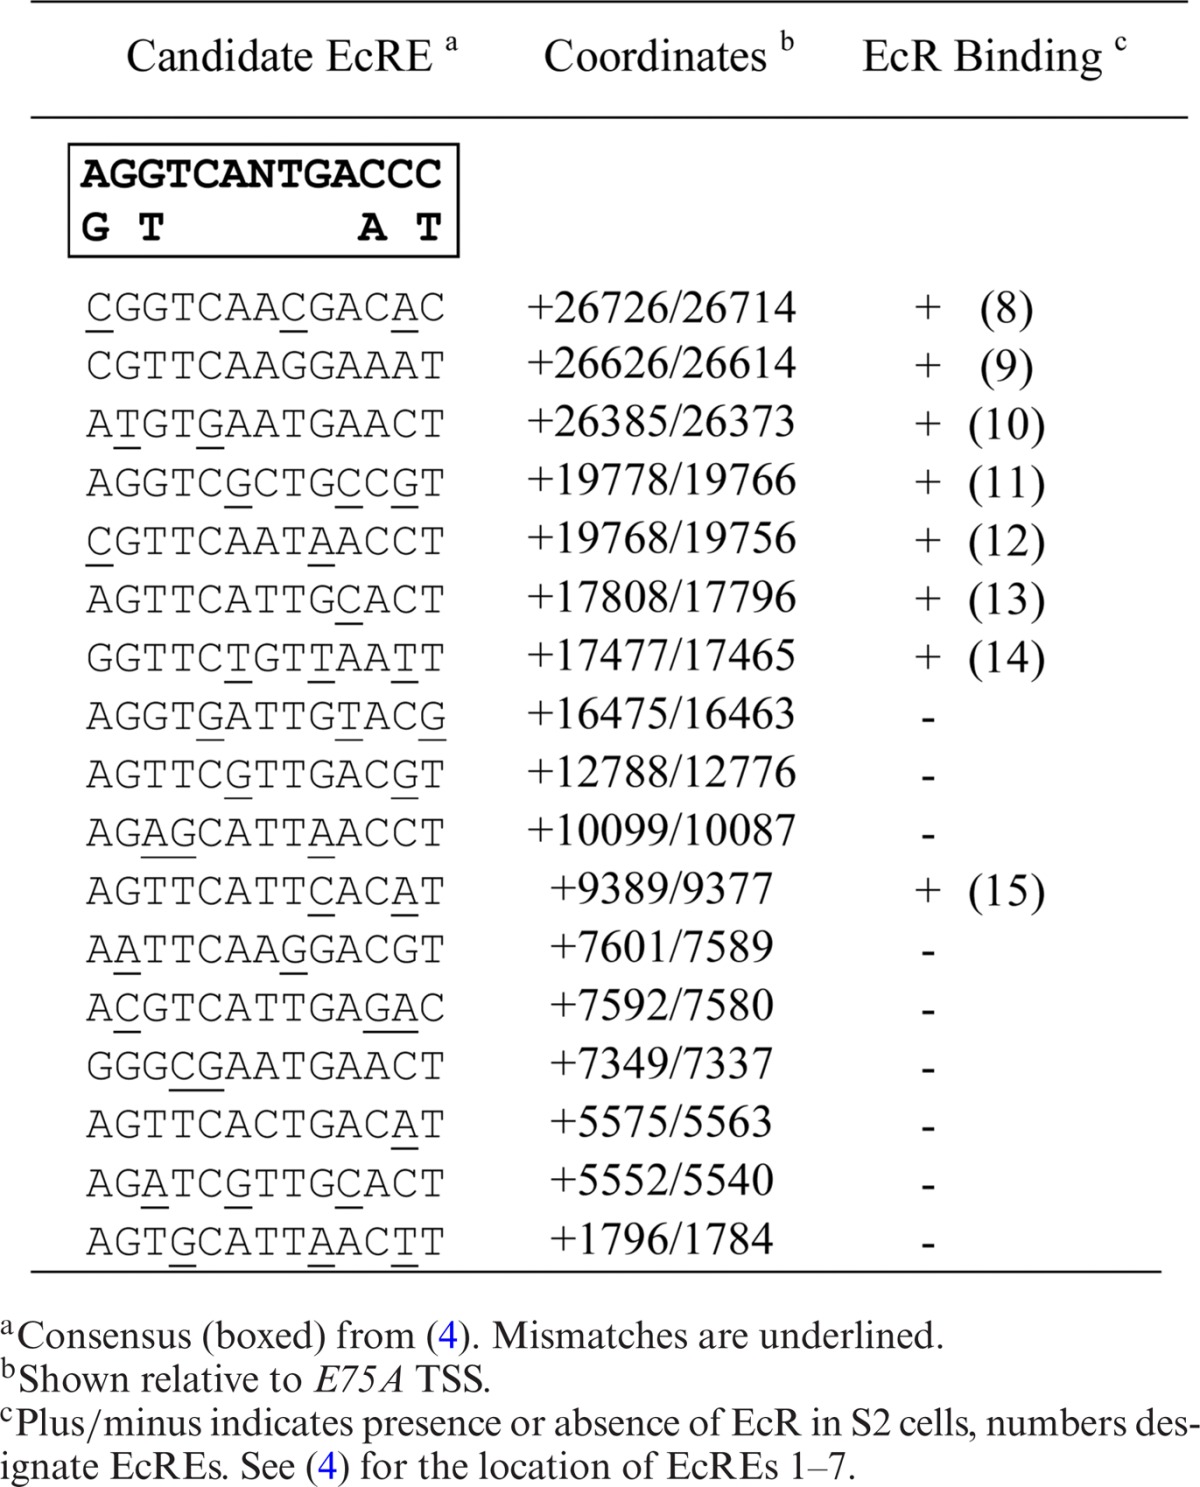
Table 3.
E74 ecdysone response elements
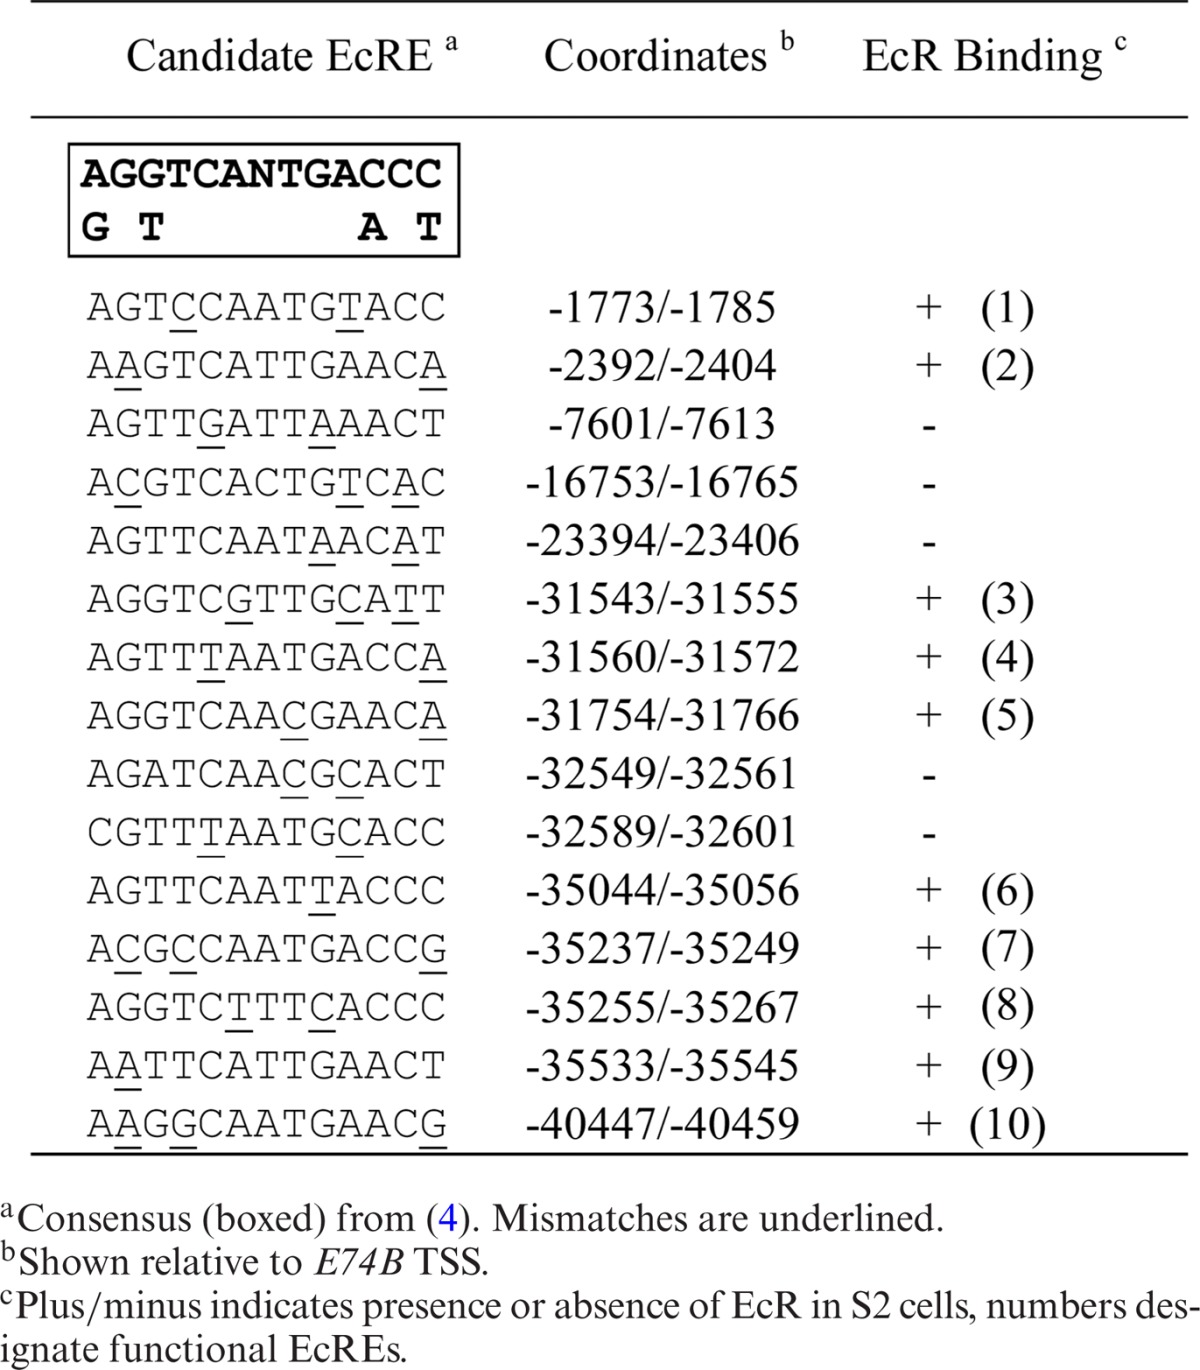
To determine which of these putative binding sites are functional, ChIP with anti-EcR antibodies was performed in S2 cells before and after treatment with ecdysone for 2 h. Enrichment over input was measured by qPCR using primer pairs targeting an individual or a cluster of predicted EcREs. Functional EcREs were then determined by the presence of statistically significant (P < 0.05) EcR binding relative to a control region lacking any EcRE. For E75 we identified six sites in the intron downstream from the E75A promoter with significant EcR enrichment in the presence of ecdysone (Figure 3A). For Broad we identified two binding sites in the intron downstream and three sites upstream from the promoter (Figure 3B). For E74 we identified seven binding sites upstream from the E74B promoter (Figure 3C). At each EcR binding site gene, binding was observed to be ecdysone-dependent. Interestingly, we observed that all of the EcR binding sites identified at E75, three at Broad and one at E74 also exhibit significant binding by EcR in the absence of ecdysone. Based on the presence of conserved EcRE sequences and binding by EcR we identified a total of 15 functional EcREs in the E75 gene, 6 in the Broad gene and 10 in the E74 gene (see Figure 2 for a schematic representation of their distribution). Thus, our findings indicate that EcRE multiplicity is a characteristic feature of the early genes.
Figure 3.
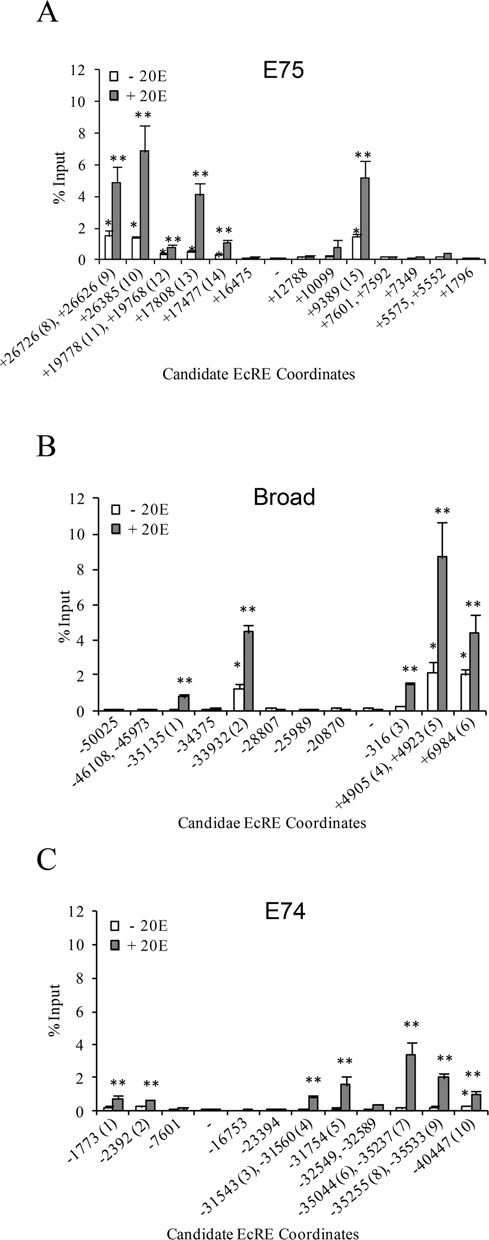
EcR Binding at early gene loci. Binding profiles for the E75(A), Broad(B) and E74(C) loci were generated by chromatin immunoprecipitation in S2 cells using antibodies targeting EcR in the absence or presence of ecdysone as indicated. Enrichment was measured by qPCR and is shown as percentage of input (y-axis). The 5′ coordinates of candidate EcREs at early genes are given on the x-axis relative to the E75A, E74B or Broad TSSs (see Supplemental Table S2 for amplicon coordinates). Negative control site is marked by (-). Asterisk (*) and double asterisk (**) indicate significant difference (Paired Student's t-test, P < 0.05) from control site in the absence and presence of ecdysone, respectively. Numerical designation of EcRE is given in parentheses on the x-axis. Bars indicate mean ± SEM from three independent experiments.
Long-range promoter interactions with EcREs
Many previous efforts to characterize ecdysone-responsive genes identified EcREs directly upstream from the TSS (3). While we also identified several proximal EcREs, we additionally found EcREs located many kilobases removed from the early gene promoters (Figure 2). We therefore asked whether and how multiple remote EcREs might be involved in early gene expression. Based on accumulating evidence that distal enhancers communicate with target promoters via higher-order spatial chromatin organization (13), we tested the possibility of long-distance interactions between EcR-bound elements and early gene promoters by performing 3C assays in S2 cells before and after 1-h treatment with ecdysone. The 3C technique is based on the principle that, due to random collisions between loci along a chromatin fiber, the frequency of cross-linking between non-functionally interacting loci will decrease as the distance between them increases. Thus, a functional interaction can be identified as a local increase of cross-linking frequency between the anchor and test fragments (20). Using HindIII fragments which each contain an early gene promoter as the anchor, we constructed interaction profiles for the E75, Broad and E74 loci by measuring the relative frequency of cross-linking between anchor and test fragments. A promoter was considered to interact with an EcRE only if the interaction with the corresponding test fragment (containing the test primer) represented a local increase of cross-linking frequency with the anchor fragment (containing the anchor primer). Figure 4 depicts the interaction profiles for E75. The E75B promoter interacts with four distal EcREs, located approximately 10 kb (#11, 12), 20 kb (#15) and 30 kb (#2) upstream from the promoter. E75A interacts with two distal EcREs (#13, 14) located 18 kb downstream from the promoter. Finally, E75C interacts with a distal EcRE (#7) located 30 kb downstream from the promoter. We also observed an interaction by all three promoters with a region approximately 20 kb upstream from the E75A promoter that does not contain any EcREs. Interestingly, all of the observed interactions with EcREs are already established before hormone treatment, suggesting that pre-existing chromatin loops may prime E75 for ecdysone-activated expression. The presence of ecdysone after 1 h produces a 40–50% increase in cross-linking frequency at some of these sites (with the exception of the interaction between E75B and EcREs 11 and 12, and 15), indicating more frequent long-distance interactions between selected EcREs and E75 promoters.
Figure 4.
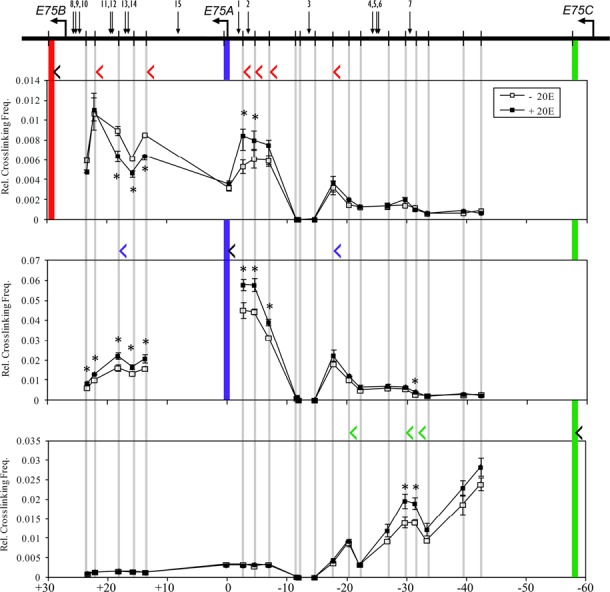
Long-distance 3C interactions at the E75 gene. Schematic of the E75 locus is shown at the top. Horizontal arrows indicate TSSs, vertical bars indicate HindIII sites and numbered arrows designate EcREs. Cross-linking frequencies (y-axis) between the fixed HindIII anchor for E75B (upper panel), E75A (middle panel), or E75C (lower panel) and the rest of the locus were measured in S2 cells in the absence or presence of ecdysone as indicated. Location of fixed anchor sites for E75B, E75A and E75C are marked by red, blue and green bars, respectively, and test sites are marked by gray bars. Black angle brackets (‘<’) above each interaction profile indicate the location and direction of anchor primers. Color-coded brackets indicate the location and direction of test primers in fragments that interact with the E75B (red), E75A (blue) and E75C (green) promoters, either in the presence or absence of ecdysone. Coordinates are given along the x-axis relative to the E75A TSS. Asterisk indicates significant difference between ecdysone and control samples (Paired Student's t-test, P < 0.05). Mean ± SEM is shown from three independent experiments.
Since several of the EcREs at the E75 gene are located relatively close to a promoter (e.g. EcREs 1, 2, 8, 9, 10) or are in locations with a limited distribution of HindIII sites (e.g. EcRE #15), we were interested to determine whether higher resolution profiles could identify additional interactions with EcREs. We therefore constructed 3C interaction profiles with DpnII, a four-base cutter commonly used for high-resolution analysis (21). With DpnII we detected additional interactions that were missed in the initial assay. For E75B, we identified interactions with three EcREs, located 20 kb (#15) and 30 kb (#1, 2) upstream from the promoter (Supplementary Figure S1, top panels). In addition, E75B interacts with a fragment 3 kb upstream from the promoter, bringing it into physical proximity with three EcREs (#8, 9, 10) that are located within an adjacent fragment. For E75A, we detected interactions with two EcREs, located 9 kb (#15) downstream and 2.5 kb (#2) upstream from the promoter (Supplementary Figure S1, middle panels). Finally, for E75C we detected an interaction with EcREs #4–6 located 37 kb downstream from the promoter (Supplementary Figure S1, bottom panel). Consistent with the observations in HindIII profiles, all of the interactions found in the DpnII analysis occur in the absence of hormone and most are strengthened by ecdysone (except for the interaction between E75B and EcRE #15, which at this higher resolution was only detectable in the presence of ecdysone). Based on the HindIII and DpnII interaction profiles collectively, we found that the E75B promoter is in close proximity with eight EcREs (#1, 2, 8, 9, 10, 11, 12, 15), E75A with four EcREs (#2, 13, 14, 15) and E75C with four EcREs (#4, 5, 6, 7). Thus, each of the promoters at the E75 gene appear to be physically associated with multiple EcREs.
We next analyzed the proximal promoter at the Broad locus using HindIII-based 3C (Figure 5). We found that the Broad promoter interacts with two EcREs (#1, 2) located 33 kb upstream and with one EcRE (#6) located 7 kb downstream from the promoter. In the absence of ecdysone, the upstream interaction occurs with the fragment adjacent to the EcREs while in the presence of ecdysone the promoter interacts directly with the EcRE-containing fragment. The downstream interaction occurs in the absence of ecdysone and is further strengthened by the hormone. As HindIII cuts relatively infrequently in the Broad promoter region, we repeated analysis of the downstream region containing EcREs #4, 5 and 6 with DpnII (Supplementary Figure S2). In the absence of hormone, the Broad promoter interacts with two fragments, at 4.3 and 7.4 kb, located approximately 500 bp from EcREs #4–5 and #6, respectively. In the presence of hormone the promoter directly interacts with the fragments containing the EcREs as well as with adjacent fragments, whose interaction becomes even stronger. The HindIII and DpnII data together show that pre-existing chromatin loops bring the Broad promoter in close physical proximity to five EcREs (#1–2, 4–6).
Figure 5.
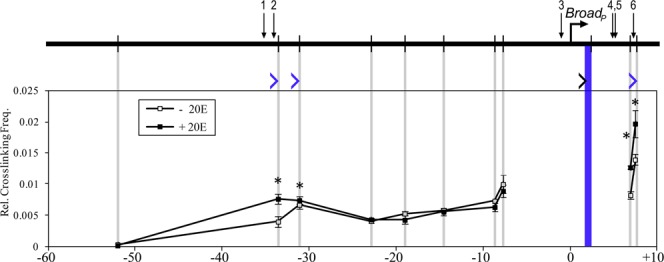
Long-distance 3C interactions at the Broad locus. Schematic of Broad is shown at the top. Horizontal arrow indicates the TSS, vertical bars indicate HindIII sites and numbered arrows designate EcREs. Cross-linking frequencies (y-axis) between the fixed HindIII anchor at the proximal promoter and the rest of the locus were measured in S2 cells in the absence or presence of ecdysone as indicated. Locations of the fixed anchor site and test sites are marked by blue and gray bars, respectively. Black angle bracket (‘>’) indicates the location and direction of the anchor primer. Blue brackets indicate the location and direction of test primers in fragments that interact with the Broad promoter, either in the presence or absence of ecdysone. Coordinates are given along the x-axis relative to the proximal TSS. Asterisk indicates significant difference between ecdysone and control samples (Paired Student's t-test, P < 0.05). Mean ± SEM is shown from three independent experiments.
For E74, the HindIII-based profiles yielded inconclusive data (Supplementary Figure S3) because of the poor distribution of restriction sites and the clustering of most EcREs within a single restriction fragment. With DpnII-based assays, we examined interaction profiles across regions spanning EcREs #1, 2 and 3–9. We found that E74B interacts with the two EcREs (#1, 2) located 2 kb upstream from the promoter (Figure 6), and treatment with ecdysone strengthens these pre-established interactions. The E74B promoter has two additional pre-established long-range interactions with upstream fragments at 33.5 and 36.5 kb, both of which are located within 1 kb of a cluster of four EcREs (#6–9). The relative frequency of cross-linking with these fragments, however, does not increase upon hormone treatment. The E74A promoter also interacts with the two fragments adjacent to the cluster of EcREs #6–9. One of these interactions, at 36 kb, becomes stronger in the presence of ecdysone. Our analysis indicates that the E74 promoters are in close physical proximity to several EcREs, six (#1–2, 6–9) for E74B and four (#6–9) for E74A.
Figure 6.
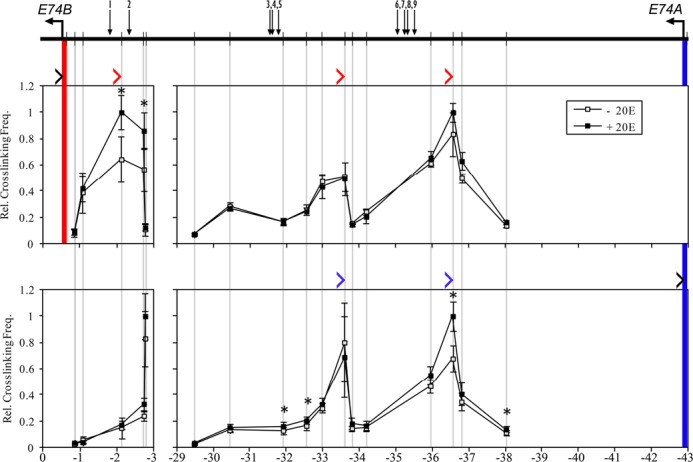
High-resolution 3C interaction profiles at the E74 locus. Schematic of E74 is shown at the top. Horizontal arrows indicate TSSs, vertical bars indicate DpnII sites and numbered arrows indicate EcREs. Cross-linking frequencies (y-axis) between the fixed DpnII anchor for E74B (upper panels) or E74A (lower panels) and the two EcRE-containing regions were measured in S2 cells in the absence or presence of ecdysone as indicated. Location of fixed anchor sites for E74B and E74A are marked by red and blue bars, respectively, and test sites are marked by gray bars. Black angle brackets (‘>’) above each interaction profile indicate the location and direction of anchor primers. Color-coded brackets indicate the location and direction of test primers in fragments that interact with the E74B (red) and E74A (blue) promoters, either in the presence or absence of ecdysone. Coordinates are given along the x-axis relative to the E74B TSS. Asterisk indicates significant difference between ecdysone and control samples (Paired Student's t-test, P < 0.05). Mean ± SEM is shown from three independent experiments.
Collectively, these results demonstrate that in S2 cells the early gene promoters interact with multiple EcREs over long distances (for a summary, see Supplementary Table S5). Importantly, most of interactions are established before hormonal activation, although the proximity of EcREs is further enhanced in the presence of ecdysone.
Role of EcR in chromatin loop formation
Since many of the early gene EcREs are bound by the EcR prior to gene expression, we were interested to determine whether EcR is required for the formation of chromatin loops that juxtapose long-range regulatory elements with target promoters. To address this issue we knocked down EcR in S2 cells with dsRNA (Supplementary Figure S4), and then examined the effect of EcR RNAi on chromatin architecture at the E75 and Broad loci.
For E75, we analyzed the interaction of E75B with the HindIII fragment containing EcRE-2, E75A with EcRE-13 and -14, and E75C with EcRE-7 (Figure 7). As expected, when EcR is present, the addition of ecdysone significantly (P < 0.05) increases the frequency of interaction with the corresponding E75 promoters. By contrast, when EcR is knocked down, ecdysone no longer generates any changes in chromatin conformation compared to hormone-free conditions. These observations are consistent with transcription from these promoters, whose strong ecdysone-dependent activation is substantially disrupted in RNAi cells (Figure 7A, inset). EcR knockdown also produced significant effects on pre-established EcRE-promoter loops in the absence of ecdysone. For E75C, the interaction with EcRE-7 was significantly (P < 0.05) reduced, by about 30%. Unexpectedly, we observed the opposite effect for E75B and E75A: the interactions with their respective EcREs were in fact significantly (P < 0.05) enhanced (10% and 30%, respectively) in RNAi cells. EcR knockdown did not produce new chromatin loops or affect those that do not contain EcREs (data not shown).
Figure 7.
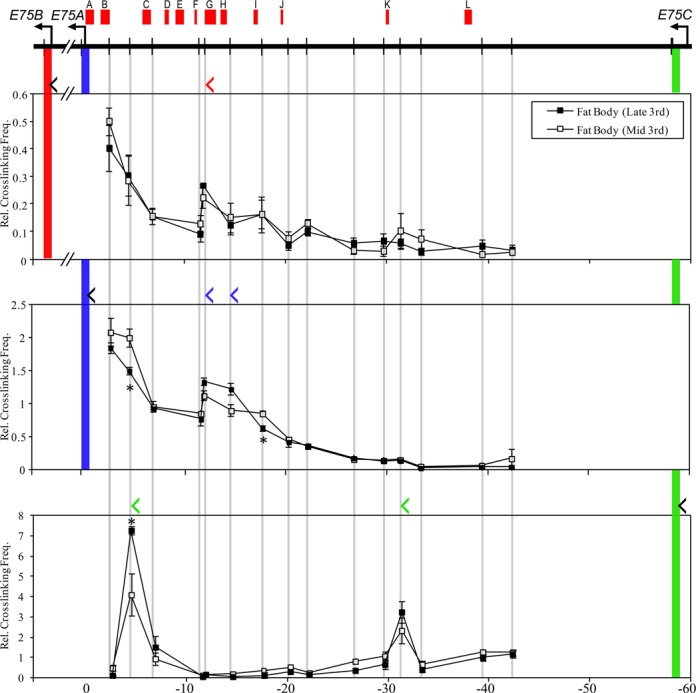
Effect of EcR knockdown on pre-existing promoter–EcRE interactions at the E75 and Broad loci. S2 cells were incubated for 3 days with or without dsRNA targeting EcR, then incubated with or without 1×10⁻⁶ M ecdysone as indicated. Each sample was divided and used in qRT-PCR and 3C analyses. HindIII-based 3C analysis was performed, and interactions were measured between the E75(A) or Broad(B) promoters and the EcRE(s) indicated (x-axis). Cross-linking frequencies (y-axis) are shown relative to the control sample. Bars indicate mean ± SEM from three independent experiments. Inset: total RNA was extracted and transcript abundance was measured by qRT-PCR for E75B, E75A, E75C and Broad core. Expression was normalized to the rp49 transcript and is shown relative to the control sample (y-axis). Bars indicate mean ± SEM from three independent experiments. Number above each bar indicates fold change relative to control sample.
When we examined EcRE–promoter interactions at the Broad locus, we observed similar changes in RNAi cells as for E75. The loss of EcR prevented the ecdysone-dependent increase in the interaction of the proximal Broad promoter with EcREs-1/2 and EcRE-6 that occurs in control cells (Figure 7B). On the other hand, knockdown of EcR significantly enhanced (P < 0.05) pre-established interactions with these regulatory elements by 40% and 60%, respectively, in the absence of ecdysone.
The results at the E75 and Broad loci collectively indicate that EcR is required for ecdysone-dependent stabilization of chromatin looping but (with the exception of the E75C–EcRE-7 interaction) is not required for the formation of the pre-established loops analyzed at these loci.
Long-range promoter interactions with EcREs in Kc cells
To further support our conclusion that multiple pre-established chromatin loops facilitate the rapid early gene transcriptional response to ecdysone, we took advantage of publicly available data derived from the Kc167 cell line. These data sets are (i) the genome-wide distribution of EcR binding sites measured by DamID, (ii) ecdysone-responsive transcripts identified by microarray (24) and (iii) the genome-wide interactome determined by Hi–C (26).
From the microarray data (GEO accession GSE11625) we assembled four groups of TSS for genes that exhibit significant upregulation after 1, 3, 6 or 12 h of ecdysone treatment in Kc cells (Supplementary Table S6). We found that the E75, Broad and E74 genes are among those activated within 1 h of ecdysone treatment, and reasoned that their promoters should therefore participate in pre-established looping interactions with at least some EcREs. To determine this we identified all interactions between EcR binding sites and promoters of ecdysone-responsive genes (see Materials and Methods). Consistent with our prediction, we observed that most of the early gene promoters mediate looping interactions with at least one, and as many as three, EcR binding sites (Supplementary Table S7). Given the comparatively low resolution of the EcR sites—with an average size of approximately 6 kb—it is likely that many of these binding sites contain more than one EcRE. Moreover, several EcR binding sites directly overlap early gene promoters and potentially represent looping interactions that cannot be detected at this resolution (defined as ‘direct’ type of interaction in Supplementary Table S7). Thus, our analysis confirms that in Kc cells the early gene promoters participate in pre-established long-distance interactions with regulatory elements within EcR binding sites, suggesting a chromatin architecture similar to that of S2 cells.
We noticed that, in addition to the early genes, long-range looping interactions between promoters and EcR binding sites in Kc cells occur at other loci that respond rapidly to ecdysone (Supplementary Figure S5A). There is a greater frequency of looping interactions for genes activated within 1 or 3 h (39.2% and 34.5% of TSS, respectively) compared to genes activated within 6 or 12 h (9.7% and 17.9%, respectively). Moreover, only genes in the 1 and 3 h categories exhibit significantly elevated frequency of loops between the promoter and EcR binding sites than expected from the population of all gene promoters (Fisher's exact test, P < 0.05). When EcR binding sites directly overlapping promoters are also considered, a majority of the 1 and 3 h responding genes (68.8% and 56.3%, respectively) are in contact with at least one EcR binding site, compared to much fewer of the late responding genes (25.8% and 33.0% for 6 and 12 h, respectively). A sizable number of the 1 and 3 h genes also form multiple interactions with EcR binding sites (Supplementary Figure S5B). A complete list of these genes is given in Supplementary Table S8. Interestingly, many of these genes possess a similar structure to early genes, with large loci and multiple promoters (data not shown).
Long-range promoter interactions with EcREs during metamorphosis
Since our analysis in cell culture suggested that EcREs act on early gene promoters through long-distance looping interactions, we were interested to determine whether similar interactions occur in vivo during metamorphosis. We first inspected the distribution of EcR binding sites (retrieved from the modENCODE, database; (27)) identified by ChIP-Seq in whole larvae at 0–0.5 h after puparium formation (APF), when the ecdysone titer is high and early genes are expressed (5). We observed that the EcR is bound at many sites throughout the early gene loci (Supplementary Table S9). For example, at the E75 locus there are 12 EcR binding sites between the E75A and E75C promoters, while at the Broad locus there are 5, 3 upstream and 2 downstream from the proximal promoter. At the E74 locus there are three EcR binding sites between the E74B and E74A promoters. While some of these binding sites were not observed in cell culture, several are located precisely where one or more EcREs were identified in S2 cells. Importantly, these in vivo observations confirm our conclusion that EcRE multiplicity is a feature of the early genes.
To determine whether any of the in vivo EcR binding sites interact with early gene promoters at the onset of metamorphosis, fat bodies and imaginal discs were collected from wandering third instar larvae, when ecdysone stimulates early gene transcription. Interaction profiles were generated for the E75 and Broad loci using HindIII-based 3C using the same restriction fragments as in S2 cells. In the late third instar fat body (Figure 8), the E75B and E75A promoters both interact with EcR binding sites G and H located within the HindIII fragment at about 12 kb upstream from the E75A promoter. In addition, E75A is juxtaposed with a third binding site I at approximately 18 kb upstream from the promoter. The E75C promoter is in proximity to two EcR binding sites, as it interacts with fragments at 55 kb downstream containing site C and at 30 kb downstream next to site K. In imaginal discs (Figure 9), we observed a similar pattern of interaction for all three promoters, except that E75B interacts with the same three EcR binding sites as E75A. Interestingly, we found in the larval tissues that none of the promoters interact with EcR binding sites in the downstream intron between E75A and E75B (data not shown). Importantly, these observations confirm that looping interactions between EcREs and the E75 promoters occur during metamorphosis.
Figure 8.
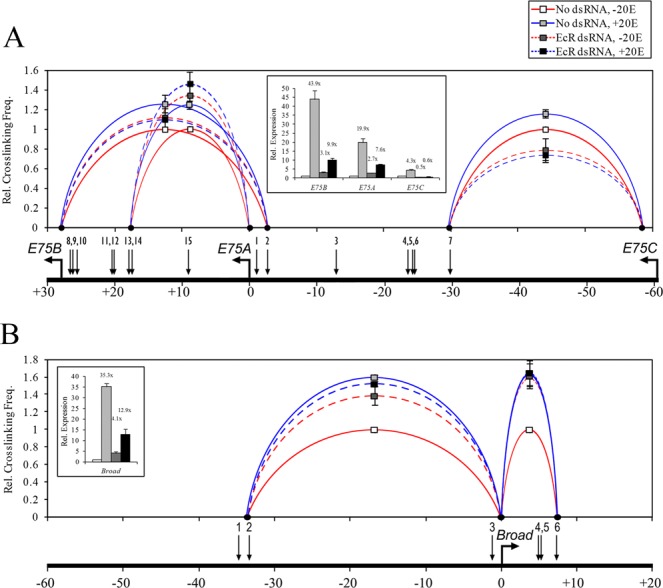
Long-distance interactions at the E75 gene in fat body. 3C analysis at the E75 locus was performed in the fat body using HindIII. Schematic of the E75 locus is shown at the top. Horizontal arrows indicate TSSs and vertical bars indicate HindIII sites. EcR binding peaks (A–L) from whole larvae at 0 APF, derived from the modENCODE database, are denoted by red boxes at the top of the diagram. Cross-linking frequencies (y-axis) between the fixed HindIII anchor for E75B (upper panel), E75A (middle panel) or E75C (lower panel) and the rest of the locus were measured in late third instar or mid-third instar fat bodies as indicated. Location of fixed anchor sites for E75B, E75A and E75C are marked by red, blue and green bars, respectively, and test sites are marked by gray bars. Black angle brackets (‘<’) above each interaction profile indicate the location and direction of anchor primers. Color-coded brackets indicate the location and direction of test primers in fragments that interact with the E75B (red), E75A (blue) and E75C (green) promoters, either in late or mid-third instar fat bodies. Coordinates are given along the x-axis relative to the E75A TSS. Asterisk indicates significant difference between late and mid-third instar fat bodies (Unpaired Student's t-test, P < 0.05). Mean ± SEM is shown from three independent experiments.
Figure 9.
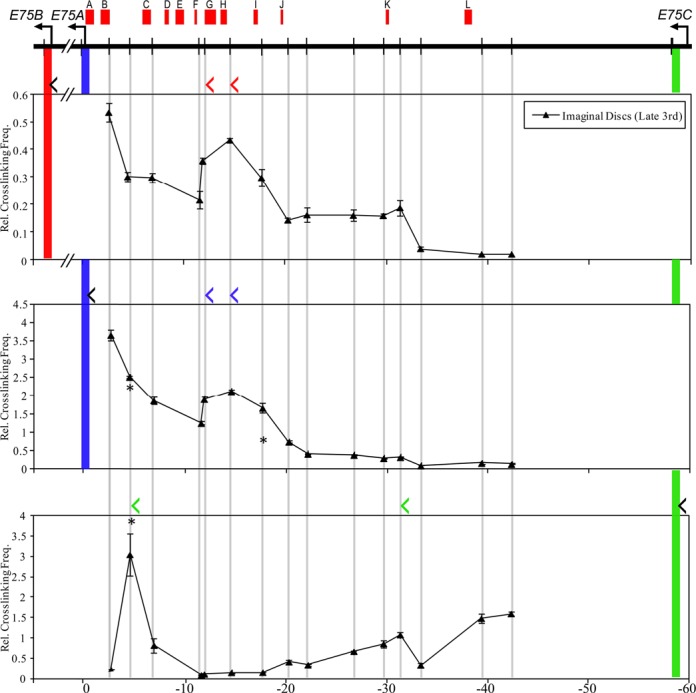
Long-distance interactions at the E75 gene in imaginal discs. 3C analysis at the E75 locus was performed in imaginal discs using HindIII. Schematic of the E75 locus is shown at the top. Horizontal arrows indicate TSSs and vertical bars indicate HindIII sites. EcR binding peaks (A–L) from whole larvae at 0 APF, derived from the modENCODE database, are denoted by red boxes at the top of the diagram. Cross-linking frequencies (y-axis) between the fixed HindIII anchor for E75B (upper panel), E75A (middle panel) or E75C (lower panel) and the rest of the locus were measured in late third instar imaginal discs. Location of fixed anchor sites for E75B, E75A and E75C are marked by red, blue and green bars, respectively, and test sites are marked by gray bars. Black angle brackets (‘<’) above each interaction profile indicate the location and direction of anchor primers. Color-coded brackets indicate the location and direction of test primers in fragments that interact with the E75B (red), E75A (blue) and E75C (green) promoters. Coordinates are given along the x-axis relative to the E75A TSS. Mean ± SEM is shown from three independent experiments.
The presence of pre-established promoter–EcRE interactions at early gene loci in S2 cells suggested that similar chromatin loops might exist in vivo prior to the metamorphic ecdysone response. To address this possibility, we examined interaction profiles at the E75 locus in fat bodies collected from mid-third instar larvae (24 h after the second larval molt), a period in which ecdysone titer is low and E75 transcription is absent (5). For each of the E75A, E75B and E75C promoters we found that most chromatin loops that exist in the late third instar are already present in the earlier developmental stage (Figure 8), suggesting that the formation of promoter–EcRE interactions in vivo occurs prior to the ecdysone transcriptional activation. Similar to the arrangement in S2 cells, the interactions are weaker in the mid-third instar and some become significantly (P < 0.05) more pronounced at the onset of metamorphosis, indicating more frequent association between the promoters and EcR binding sites in the presence of ecdysone.
At the Broad gene, we measured the interaction profile for the proximal promoter in cells of imaginal discs and fat body (Figure 10). In contrast to E75, we noted a tissue-specific difference in observed profiles: while the Broad promoter does not appear to interact at all with the upstream region in late third instar imaginal discs, in the fat body it interacts with two adjacent HindIII fragments located 30–35 kb upstream containing EcR binding sites A and B. In both tissues, however, Broad interacts with a fragment neighboring two EcR sites D and E at about 8 kb downstream from the promoter. Similar to E75, some of the chromatin loops are already present in the mid-third instar. Thus, the Broad promoter also appears to be arranged in a pre-existing interaction with distal EcREs prior to the late larval ecdysone response. Interestingly, nearly all of the EcR binding sites at the E75 and Broad loci observed at puparium formation are absent from earlier L3 larvae (Supplementary Table S9), despite the presence of pre-formed chromatin loops. Collectively, the results indicate that the early genes utilize in vivo looping interactions to bring promoters in contact with distantly located EcREs, and that these interactions exist in a poised state prior to the initiation of ecdysone-dependent gene activation.
Figure 10.
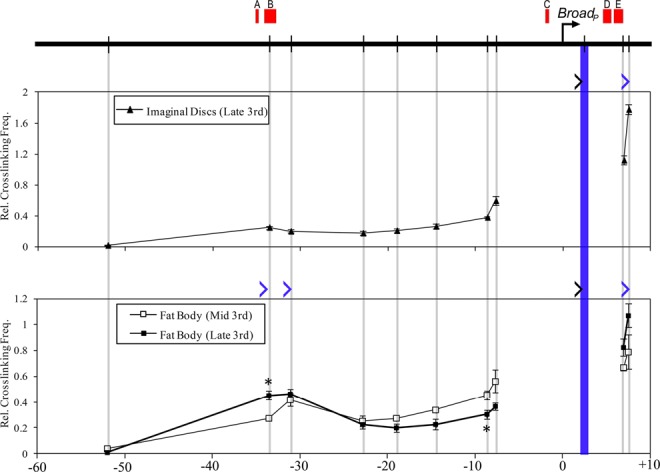
Long-distance interactions at the Broad locus in larval tissues. Schematic of Broad is shown at the top. Horizontal arrow indicates TSS and vertical bars indicate HindIII sites. EcR binding peaks (A–E) from whole larvae at 0 APF, derived from the modENCODE database, are denoted by red boxes at the top of the diagram. Cross-linking frequencies (y-axis) between the fixed HindIII anchor for Broad and the rest of the locus were measured in late third instar imaginal discs (upper panel) and in late and mid-third instar fat bodies (lower panel). Location of the fixed anchor site and test sites are marked by blue and gray bars, respectively. Black angle brackets (‘>’) indicate the location and direction of anchor primers. Blue brackets indicate the location and direction of test primers in fragments that interact with the Broad promoter. Coordinates are given along the x-axis relative to the proximal TSS. Asterisk indicates significant difference between late and mid-third instar fat bodies (Unpaired Student's t-test, P < 0.05). Mean ± SEM is shown from three independent experiments.
DISCUSSION
In this study, we combined ChIP and 3C techniques to examine the 3D architecture of the regulatory regions at the classic early gene loci targeted by ecdysone signaling in Drosophila. We found that while on the linear DNA the majority of EcR binding sites are far from any TSS, a higher order chromatin configuration brings distal EcRE into physical proximity with the early gene promoters. Our findings indicate that chromatin looping facilitates pre-formed, long-range interactions between multiple EcR complexes and the basal transcription machinery, thereby conferring rapid and powerful ecdysone inducibility on the early genes.
Chromatin looping enables multiple EcREs to contact ecdysone target promoters.
Transcriptional cooperativity among hormone response elements (HRE) is a common feature of many hormone receptors, and has been observed for the EcR (4) as well as the mammalian glucocorticoid (28), thyroid (29), androgen (30), estrogen (31) and retinoic acid receptors (32). Detailed studies of progesterone receptor (PR) binding dynamics at synthetic tandem response elements (33) and at the natural mouse mammary tumor virus (MMTV) promoter containing multiple progesterone response elements (34) have shown that the surplus of response elements synergistically enhances binding of PR and its coactivators. Consequently, the presence of multiple HREs promotes the recruitment of the basal transcriptional machinery through the formation of higher order receptor–promoter complexes and leads to rapid and strong transcriptional activation of hormone-responsive genes.
We previously reported that EcREs identified within the non-coding region upstream of the E75A promoter mediate sub-optimal ecdysone activation when neighboring EcREs are mutagenized (4). The finding suggested that rapidly responding ecdysone targets such as the early genes utilize transcriptional cooperativity to mediate their response to ecdysone. In this report we extended the identification of EcREs to three classic early genes: E75, Broad and E74. We found that all of them possess multiple EcREs distributed throughout their loci (Figure 2 and Tables 1–3). We note that while this study describes the identification and analysis of EcREs located within non-coding intragenic regions, highly conserved EcRE-like sequences are also present in adjacent regions outside of the gene body (data not shown), suggesting that additional putative EcREs may regulate these genes. Our findings here thus provide further evidence that the strong activation of early genes could be mediated through transcriptional cooperativity of an array of functional EcREs.
Table 2.
Broad ecdysone response elements
In contrast to previous studies, which focused on the identification of EcREs in close proximity to a TSS (3), our analysis identified EcREs located far from any of the early gene promoters. Using 3C we found in both S2 cells (Figures 4–6, Supplementary Figures S1–S3) and in vivo (Figures 8–10) that the early gene promoters are in physical contact with multiple EcREs, proximal and distal, through the formation of chromatin loops. Such looping organization of the regulatory region brings anywhere from four to eight EcREs to a given early gene basal promoter. Our findings suggest that a particular chromatin architecture at the early gene loci enables distantly located EcREs to act in concert with one another in facilitating EcR recruitment and thereby enhancing transcriptional activation. Cooperativity among distantly located EcREs could explain why early genes respond to ecdysone in such a powerful and rapid fashion both in cultured cells and in vivo. This view is consistent with the generally held notion that enhancer looping increases the local concentration of transcription factors at target promoters (35) and elevates transcriptional activity (36).
Pre-existing higher order chromatin structures potentiate ecdysone activation
While some 3C-based studies at individual gene loci initially suggested that ligand may be required for a hormone receptor complex to stimulate the formation of chromatin loops between distal binding sites and target promoters (37,38), accumulating evidence from large-scale interaction studies indicates that nuclear receptors and other ligand-dependent transcription factors generally act upon pre-formed chromatin loop structures (39–41). Using 4C, Hakim et al. (39) examined the genome-wide interaction profile of the Lcn2 promoter, a target of the glucorticoid receptor, before and after activation by dexamethasone. The majority of interacting regions, enriched for glucocorticoid receptor (GR) binding sites, exhibited pre-existing interactions with Lcn2, with dexamethasone largely serving to strengthen these associations. Osmanbeyoglu et al. (41) found that the estrogen receptor and Pol-II are colocalized at estrogen-responsive genes through pre-formed loops, leading the authors to conclude that estrogen stimulates gene expression by modifying pre-existing higher order complexes containing estrogen receptor (ER) rather than by facilitating complex assembly de novo. Our findings suggest that a similar mechanism may be functioning for the EcR at early genes, as nearly all looped chromatin configurations identified between early gene promoters and EcREs exist prior to the ecdysone response in S2 cells (Figures 4–6, Supplementary Figures S1–S3) and the onset of metamorphosis in vivo (Figures 8 and 10). Finally, our computational analysis of genome-wide data sets derived from the Kc167 cells suggests that the proposed mechanism is generally applicable to genes with rapid ecdysone activation, as their basal promoters display pre-established association with multiple EcR binding sites (Supplementary Figure S5 and Table S7).
Testing the hypothesis of whether nuclear receptors are essential to the formation of higher order chromatin domains, we found that disruption of EcR function with RNAi did not deter pre-established chromatin loops, with the exception of E75C (Figure 7). Curiously, loss of the EcR caused increased contact frequency between regulatory regions with EcREs and early gene promoters. As this increase correlates with a detectable elevation in the basal transcriptional activity (see insets in Figure 7), we interpret the inhibitory effect of unliganded EcR on chromatin loop formation as a display of its ability to act as a transcriptional repressor in the absence of ecdysone (42).
EcRE multiplicity may facilitate widespread ecdysone activation of early genes
It has long been accepted that enhancers play an important role in establishing tissue-specific gene expression through the assembly of complexes containing tissue-specific transcription factors (43). More recently, the 3D architecture of chromatin has also become understood as a major determinant in the specificity of transcription. Studies at individual gene loci (44,45) and genome wide (40,46) have shown that gene expression is highly correlated to chromatin loops between the gene promoters and tissue-specific transcription-factor-bound enhancers. In human fibroblasts, genes that are transcriptionally induced with Tumour necrosis factor alpha can be successfully identified based on pre-established promoter interactions with fibroblast-specific NF-κB binding sites (40). Such findings suggest that the tissue-specific distribution of transcription factor bound sites and enhancer–promoter interactions may have a critical role in defining gene expression across different cells and tissues.
Studies of ecdysone-dependent, but strictly tissue-specific, genes (e.g.Sgs4, Fbp1) identified enhancers and bound transcription factors that transform a ubiquitous ecdsyone signal into a cell-specific pattern of expression (47,48). These observations are consistent with the notion of particular transcription factors specifying tissue-specific ecdysone responsiveness. However, the expression of ecdysone target genes has not heretofore been studied in the context of tissue-specific chromatin looping. Early genes provide a unique system to address this issue, not only because of their size and multiplicity of EcREs distributed throughout their loci, but also because their hormonal activation is not limited to a particular cell type—it is remarkably widespread across many tissues (5). Indeed, as the function of early gene encoded proteins is to coordinate tissue-specific activation of downstream ecdysone targets (2,3), their presence is needed in multiple tissues simultaneously. In our study, we tried to understand how the early genes are able to achieve such flexible hormonal activation while other ecdysone targets are driven in a spatially restricted manner, given the emerging view that gene expression is delimited by tissue-specific chromatin interactions.
We compared the EcRE–promoter interactions at the E75 and Broad loci in S2 cells, representing an embryonic lineage, with those of the larval fat body and imaginal discs. Notably, while the early genes are activated by ecdysone similarly in each of these cell types, their promoters interact with distinct sets of EcREs in a cell type-specific manner (compare Figures 4, 5, 8–10). This observation suggests that the presence of multiple EcREs may enable early genes to form chromatin loops with alternative EcREs in different cell or tissue types, thereby maintaining a similar pattern of gene expression even in the context of different transcription factors that may be available. While further studies may determine whether and how tissue-specific factors may contribute to the formation of chromatin loops at early gene loci, our findings highlight the distinctive and intriguing mechanisms that underlie the regulation of early genes by ecdysone.
SUPPLEMENTARY DATA
Supplementary Data are available at NAR Online.
Acknowledgments
The authors are grateful to Drs W. de Laat (Hubrecht Institute), T. Forné (Institut de Génétique Moléculaire de Montpellier), A.A. Gavrilov (Institute of Gene Biology of the Russian Academy of Sciences), C. Lanzuolo (Cellular Biology and Neurobiology Institute) and Y. Schwartz (Umeå University) for advice and assistance in the 3C technique. We also thank Dr B.A. Bartholdy (Albert Einstein College of Medicine) for suggestions in the computational analysis of genome-wide binding and interaction data.
FUNDING
National Institutes of Health [1R15GM097716 to E.B.D.]; Fordham University Graduate School of Arts and Sciences teaching and research fellowships [to T.J.B. and X.X.]. Funding for open access charge: Department of Biology, Fordham University.
Conflict of interest statement. None declared.
REFERENCES
- 1.Dubrovsky E.B. Hormonal cross talk in insect development. Trends Endocrinol. Metab. 2005;16:6–11. doi: 10.1016/j.tem.2004.11.003. [DOI] [PubMed] [Google Scholar]
- 2.Ou Q., King-Jones K. What goes up must come down: transcription factors have their say in making ecdysone pulses. Curr. Top. Dev. Biol. 2013;103:35–71. doi: 10.1016/B978-0-12-385979-2.00002-2. [DOI] [PubMed] [Google Scholar]
- 3.Cherbas P., Cherbas L. Molecular aspects of ecdysteroid hormone action. In: Gilbert LI, Tata JR, Atkinson BG, editors. Metamorphosis: Postembryonic Programming of Gene Expression in Amphibian and Insect Cells. San Diego, CA, USA: Academic Press; 1996. pp. 175–221. [Google Scholar]
- 4.Bernardo T.J., Dubrovskaya V.A., Jannat H., Maughan B., Dubrovsky E.B. Hormonal regulation of the E75 gene in Drosophila: identifying functional regulatory elements through computational and biological analysis. J. Mol. Biol. 2009;387:794–808. doi: 10.1016/j.jmb.2009.02.013. [DOI] [PubMed] [Google Scholar]
- 5.Huet F., Ruiz C., Richards G. Puffs and PCR: the in vivo dynamics of early gene expression during ecdysone responses in Drosophila. Development. 1993;118:613–627. doi: 10.1242/dev.118.2.613. [DOI] [PubMed] [Google Scholar]
- 6.Li T.-R., White K.P. Tissue-specific gene expression and ecdysone-regulated genomic networks in Drosophila. Dev. Cell. 2003;5:59–72. doi: 10.1016/s1534-5807(03)00192-8. [DOI] [PubMed] [Google Scholar]
- 7.Burtis K.C., Thummel C.S., Jones C.W., Karim F.D., Hogness D.S. The Drosophila 74EF early puff contains E74, a complex ecdysone-inducible gene that encodes two ets-related proteins. Cell. 1990;61:85–99. doi: 10.1016/0092-8674(90)90217-3. [DOI] [PubMed] [Google Scholar]
- 8.Segraves W.A., Hogness D.S. The E75 ecdysone-inducible gene responsible for the 75B early puff in Drosophila encodes two new members of the steroid receptor superfamily. Genes Dev. 1990;4:204–219. doi: 10.1101/gad.4.2.204. [DOI] [PubMed] [Google Scholar]
- 9.DiBello P.R., Withers D.A., Bayer C.A., Fristrom J.W., Guild G.M. The Drosophila Broad-Complex encodes a family of related proteins containing zinc fingers. Genetics. 1991;129:385–397. doi: 10.1093/genetics/129.2.385. [DOI] [PMC free article] [PubMed] [Google Scholar]
- 10.Ashburner M., Chihara C., Meltzer P., Richards G. Temporal control of puffing activity in polytene chromosomes. Cold Spring Harb. Sym. Quant. Biol. 1974;38:655–662. doi: 10.1101/sqb.1974.038.01.070. [DOI] [PubMed] [Google Scholar]
- 11.Karim F.D., Thummel C.S. Temporal coordination of regulatory gene expression by the steroid hormone ecdysone. EMBO J. 1992;11:4083–4093. doi: 10.1002/j.1460-2075.1992.tb05501.x. [DOI] [PMC free article] [PubMed] [Google Scholar]
- 12.Dubrovsky E.B., Dubrovskaya V.A., Berger E.M. Hormonal regulation and functional role of Drosophila E75A orphan nuclear receptor in the juvenile hormone signaling pathway. Dev. Biol. 2004;268:258–270. doi: 10.1016/j.ydbio.2004.01.009. [DOI] [PubMed] [Google Scholar]
- 13.Smallwood A., Ren B. Genome organization and long-range regulation of gene expression by enhancers. Curr. Opin. Cell Biol. 2013;25:387–394. doi: 10.1016/j.ceb.2013.02.005. [DOI] [PMC free article] [PubMed] [Google Scholar]
- 14.Bolton E.C., So A.Y., Chaivorapol C., Haqq C.M., Li H., Yamamoto K.R. Cell- and gene-specific regulation of primary target genes by the androgen receptor. Genes Dev. 2007;21:2005–2017. doi: 10.1101/gad.1564207. [DOI] [PMC free article] [PubMed] [Google Scholar]
- 15.Fullwood M.J., Liu M.H., Pan Y.F., Liu J., Han X., Mohamed Y.B., Orlov Y.L., Velkov S., Ho A., Mei P.H., et al. An oestrogen receptor α-bound human chromatin interactome. Nature. 2009;462:58–64. doi: 10.1038/nature08497. [DOI] [PMC free article] [PubMed] [Google Scholar]
- 16.Dubrovsky E.B., Dubrovskaya V.A., Bernardo T., Otte V., DiFilippo R., Bryan H. The Drosophila FTZ-F1 nuclear receptor mediates juvenile hormone activation of E75A gene expression through an intracellular pathway. J. Biol. Chem. 2011;286:33689–33700. doi: 10.1074/jbc.M111.273458. [DOI] [PMC free article] [PubMed] [Google Scholar]
- 17.Yavatkar A.S., Lin Y., Ross J., Fann Y., Brody T., Odenwald W.F. Rapid detection and curation of conserved DNA via enhanced-BLAT and EvoPrinterHD analysis. BMC Genomics. 2008;9:106. doi: 10.1186/1471-2164-9-106. [DOI] [PMC free article] [PubMed] [Google Scholar]
- 18.Mrázek J., Xie S. Pattern locator: a new tool for finding local sequence patterns in genomic DNA sequences. Bioinformatics. 2006;22:3099–3100. doi: 10.1093/bioinformatics/btl551. [DOI] [PubMed] [Google Scholar]
- 19.Court F., Baniol M., Hagege H., Petit J.S., Lelay-Taha M.-N., Carbonell F., Weber M., Cathala G., Forne T. Long-range chromatin interactions at the mouse Igf2/H19 locus reveal a novel paternally expressed long non-coding RNA. Nucleic Acids Res. 2011;39:5893–5906. doi: 10.1093/nar/gkr209. [DOI] [PMC free article] [PubMed] [Google Scholar]
- 20.Dekker J. The three “C” s of chromosome conformation capture: controls, controls, controls. Nat. Methods. 2006;3:17–21. doi: 10.1038/nmeth823. [DOI] [PubMed] [Google Scholar]
- 21.Hagège H., Klous P., Braem C., Splinter E., Dekker J., Cathala G., de Laat W., Forné T. Quantitative analysis of chromosome conformation capture assays (3C-qPCR) Nat. Protoc. 2007;2:1722–1733. doi: 10.1038/nprot.2007.243. [DOI] [PubMed] [Google Scholar]
- 22.Schmittgen T.D., Livak K.J. Analyzing real-time PCR data by the comparative C(T) method. Nat. Protoc. 2008;3:1101–1108. doi: 10.1038/nprot.2008.73. [DOI] [PubMed] [Google Scholar]
- 23.Heinz S., Benner C., Spann N., Bertolino E., Lin Y.C., Laslo P., Cheng J.X., Murre C., Singh H., Glass C.K. Simple combinations of lineage-determining transcription factors prime cis-regulatory elements required for macrophage and B cell identities. Mol. Cell. 2010;38:576–589. doi: 10.1016/j.molcel.2010.05.004. [DOI] [PMC free article] [PubMed] [Google Scholar]
- 24.Gauhar Z., Sun L.V., Hua S., Mason C.E., Fuchs F., Li T.-R., Boutros M., White K.P. Genomic mapping of binding regions for the Ecdysone receptor protein complex. Genome Res. 2009;19:1006–1013. doi: 10.1101/gr.081349.108. [DOI] [PMC free article] [PubMed] [Google Scholar]
- 25.Quinlan A.R., Hall I.M. BEDTools: a flexible suite of utilities for comparing genomic features. Bioinformatics. 2010;26:841–842. doi: 10.1093/bioinformatics/btq033. [DOI] [PMC free article] [PubMed] [Google Scholar]
- 26.Hou C., Li L., Qin Z.S., Corces V.G. Gene density, transcription, and insulators contribute to the partition of the drosophila genome into physical domains. Mol. Cell. 2012;48:471–484. doi: 10.1016/j.molcel.2012.08.031. [DOI] [PMC free article] [PubMed] [Google Scholar]
- 27.Celniker S.E., Dillon L.A.L., Gerstein M.B., Gunsalus K.C., Henikoff S., Karpen G.H., Kellis M., Lai E.C., Lieb J.D., MacAlpine D.M., et al. Unlocking the secrets of the genome. Nature. 2009;459:927–930. doi: 10.1038/459927a. [DOI] [PMC free article] [PubMed] [Google Scholar]
- 28.Tsai S.Y., Tsai M.J., O'Malley B.W. Cooperative binding of steroid hormone receptors contributes to transcriptional synergism at target enhancer elements. Cell. 1989;57:443–448. doi: 10.1016/0092-8674(89)90919-7. [DOI] [PubMed] [Google Scholar]
- 29.Liu H.C., Towle H.C. Functional synergism between multiple thyroid hormone response elements regulates hepatic expression of the rat S14 gene. Mol. Endocrinol. 1994;8:1021–1037. doi: 10.1210/mend.8.8.7997231. [DOI] [PubMed] [Google Scholar]
- 30.Reid K.J., Hendy S.C., Saito J., Sorensen P., Nelson C.C. Two classes of androgen receptor elements mediate cooperativity through allosteric interactions. J. Biol. Chem. 2001;276:2943–2952. doi: 10.1074/jbc.M009170200. [DOI] [PubMed] [Google Scholar]
- 31.Klinge C.M. Estrogen receptor interaction with estrogen response elements. Nucleic Acids Res. 2001;29:2905–2919. doi: 10.1093/nar/29.14.2905. [DOI] [PMC free article] [PubMed] [Google Scholar]
- 32.Zhang Y., Zolfaghari R., Ross A.C. Multiple retinoic acid response elements cooperate to enhance the inducibility of CYP26A1 gene expression in liver. Gene. 2010;464:32–43. doi: 10.1016/j.gene.2010.05.004. [DOI] [PMC free article] [PubMed] [Google Scholar]
- 33.Heneghan A.F., Connaghan-Jones K.D., Miura M.T., Bain D.L. Coactivator assembly at the promoter: efficient recruitment of SRC2 is coupled to cooperative DNA binding by the progesterone receptor. Biochemistry. 2007;46:11023–11032. doi: 10.1021/bi700850v. [DOI] [PubMed] [Google Scholar]
- 34.Connaghan-Jones K.D., Heneghan A.F., Miura M.T., Bain D.L. Thermodynamic dissection of progesterone receptor interactions at the mouse mammary tumor virus promoter: monomer binding and strong cooperativity dominate the assembly reaction. J. Mol. Biol. 2008;377:1144–1160. doi: 10.1016/j.jmb.2008.01.052. [DOI] [PMC free article] [PubMed] [Google Scholar]
- 35.Splinter E., de Laat W. The complex transcription regulatory landscape of our genome: control in three dimensions. EMBO J. 2011;30:4345–4355. doi: 10.1038/emboj.2011.344. [DOI] [PMC free article] [PubMed] [Google Scholar]
- 36.Montavon T., Soshnikova N., Mascrez B., Joye E., Thevenet L., Splinter E., de Laat W., Spitz F., Duboule D. A regulatory archipelago controls Hox genes transcription in digits. Cell. 2011;147:1132–1145. doi: 10.1016/j.cell.2011.10.023. [DOI] [PubMed] [Google Scholar]
- 37.Bonéy-Montoya J., Ziegler Y.S., Curtis C.D., Montoya J.A., Nardulli A.M. Long-range transcriptional control of progesterone receptor gene expression. Mol. Endocrinol. 2010;24:346–358. doi: 10.1210/me.2009-0429. [DOI] [PMC free article] [PubMed] [Google Scholar]
- 38.Kabotyanski E.B., Rijnkels M., Freeman-Zadrowski C., Buser A.C., Edwards D.P., Rosen J.M. Lactogenic hormonal induction of long distance interactions between beta-casein gene regulatory elements. J. Biol. Chem. 2009;284:22815–22824. doi: 10.1074/jbc.M109.032490. [DOI] [PMC free article] [PubMed] [Google Scholar]
- 39.Hakim O., Sung M.-H., Voss T.C., Splinter E., John S., Sabo P.J., Thurman R.E., Stamatoyannopoulos J.A., de Laat W., Hager G.L. Diverse gene reprogramming events occur in the same spatial clusters of distal regulatory elements. Genome Res. 2011;21:697–706. doi: 10.1101/gr.111153.110. [DOI] [PMC free article] [PubMed] [Google Scholar]
- 40.Jin F., Li Y., Dixon J.R., Selvaraj S., Ye Z., Lee A.Y., Yen C.-A., Schmitt A.D., Espinoza C.A., Ren B. A high-resolution map of the three-dimensional chromatin interactome in human cells. Nature. 2013;503:290–294. doi: 10.1038/nature12644. [DOI] [PMC free article] [PubMed] [Google Scholar]
- 41.Osmanbeyoglu H.U., Lu K.N., Oesterreich S., Day R.S., Benos P.V., Coronnello C., Lu X. Estrogen represses gene expression through reconfiguring chromatin structures. Nucleic Acids Res. 2013;41:8061–8071. doi: 10.1093/nar/gkt586. [DOI] [PMC free article] [PubMed] [Google Scholar]
- 42.Tsai C.C., Kao H.Y., Yao T.P., McKeown M., Evans R.M. SMRTER, a Drosophila nuclear receptor coregulator, reveals that EcR-mediated repression is critical for development. Mol. Cell. 1999;4:175–186. doi: 10.1016/s1097-2765(00)80365-2. [DOI] [PubMed] [Google Scholar]
- 43.Ong C.-T., Corces V.G. Enhancer function: new insights into the regulation of tissue-specific gene expression. Nat. Rev. Genet. 2011;12:283–293. doi: 10.1038/nrg2957. [DOI] [PMC free article] [PubMed] [Google Scholar]
- 44.Hou C., Dale R., Dean A. Cell type specificity of chromatin organization mediated by CTCF and cohesin. Proc. Natl. Acad. Sci. USA. 2010;107:3651–3656. doi: 10.1073/pnas.0912087107. [DOI] [PMC free article] [PubMed] [Google Scholar]
- 45.Junier I., Dale R.K., Hou C., Kepes F., Dean A. CTCF-mediated transcriptional regulation through cell type-specific chromosome organization in the β-globin locus. Nucleic Acids Res. 2012;40:7718–7727. doi: 10.1093/nar/gks536. [DOI] [PMC free article] [PubMed] [Google Scholar]
- 46.Phillips-Cremins J.E., Sauria M.E.G., Sanyal A., Gerasimova T.I., Lajoie B.R., Bell J.S.K., Ong C.-T., Hookway T.A., Guo C., Sun Y., et al. Architectural protein subclasses shape 3D organization of genomes during lineage commitment. Cell. 2013;153:1281–1295. doi: 10.1016/j.cell.2013.04.053. [DOI] [PMC free article] [PubMed] [Google Scholar]
- 47.Lehmann M., Korge G. The fork head product directly specifies the tissue-specific hormone responsiveness of the Drosophila Sgs-4 gene. EMBO J. 1996;15:4825–4834. [PMC free article] [PubMed] [Google Scholar]
- 48.Brodu V., Mugat B., Roignant J.Y., Lepesant J.A., Antoniewski C. Dual requirement for the EcR/USP nuclear receptor and the dGATAb factor in an ecdysone response in Drosophila melanogaster. Mol. Cell. Biol. 1999;19:5732–5742. doi: 10.1128/mcb.19.8.5732. [DOI] [PMC free article] [PubMed] [Google Scholar]
Associated Data
This section collects any data citations, data availability statements, or supplementary materials included in this article.


