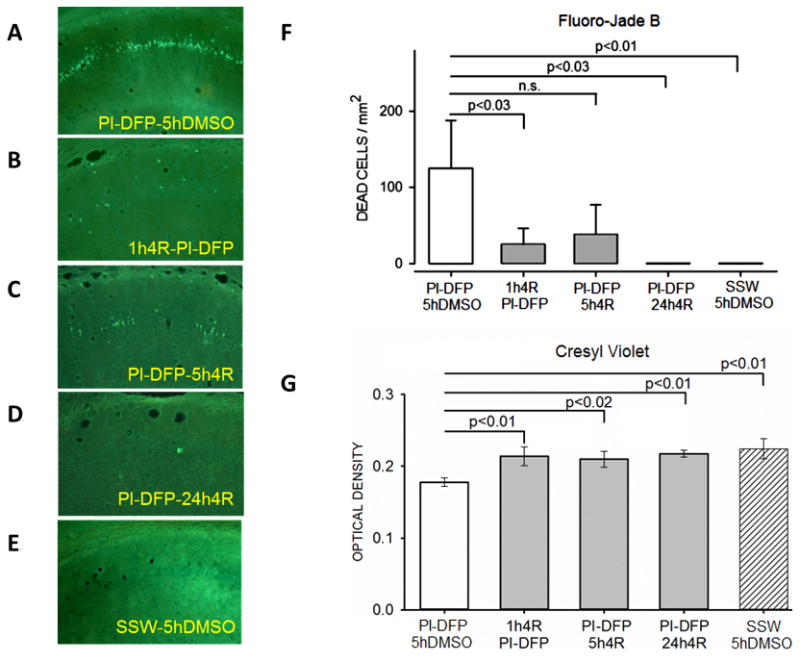
Figure 6. Experiment 2: 4R decreased neuronal death produced by the PI-DFP treatment.

See Fig. 2B for experimental design. There were five experimental groups. The determinations were done in adjacent slices of the same brains. (A-E) Representative micrographs from the CA1 hippocampal area stained with Fluoro-Jade B. (F) The bar graph represents the mean ± SEM of dead cell density determined with Fluoro-Jade B. (G) The bars represent the mean ± SEM of the optical density of live cells stained with cresyl violet. The number of rats per group was PI-DFP-DMSO (10), 1h4R-PI-DFP (6), PI-DFP-5h4R (5), PI-DFP-24h4R (4), and SSW-5hDMSO (6). See statistical analysis in Methods.
