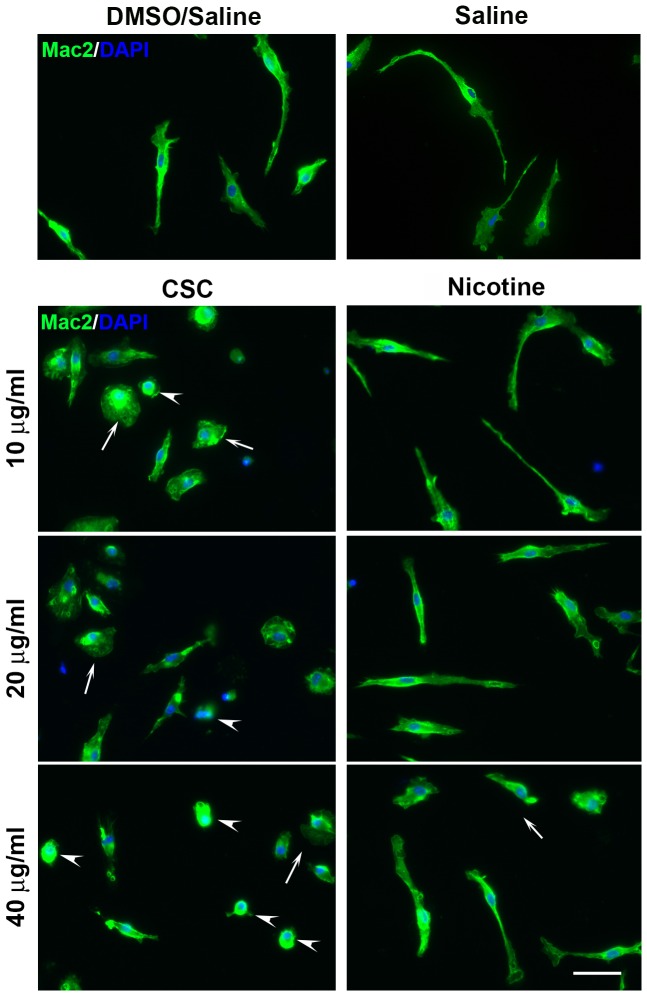
Figure 7. CSC exposure induces ameboid morphology in microglia.
Primary microglia were treated with different concentrations of CSC and nicotine for 24 hours and cell morphology visualized by staining with Mac2 antibody. Arrows point to enlarged cell bodies and retracted cell processes. Arrowheads point to cell shrinkage after CSC treatment. (Bar = 20 µm, n = 4).

