Abstract
Background
In order to determine if the Royal Marsden Hospital (RMH) prognostic score for phase I patients can be validated in a large group of individuals seen in a different center, and if other prognostic variables are also relevant, we present an analysis of 1,181 patients treated in the MD Anderson Cancer Center (MDACC) Phase I clinic.
Methods
Medical records of 1,181 consecutive patients who were treated on at least one trial in the Phase I clinic were reviewed.
Results
The median age was 58 years and 50% were women. The median number of prior therapies was four; median survival, 10 months (95% CI-9.1 to 10.9 months). Independent factors that predicted shorter survival in a multivariate Cox model and could be internally validated included: RMH score >1 (p<0.0001) (albumin <3.5 mg/dL, LDH >upper limit of normal, and >2 sites of metastases); gastrointestinal tumor type (p<0.0001); and, ECOG performance status ≥1 (p=0.0004). The median survival was 24.0, 15.2, 8.4, 6.2 and 4.1 months for patients with 0, 1, 2, 3, and 4 or 5 of the above risk factors respectively.
Conclusion
The RMH score was validated in a large group of patients at MDACC. Internal validation of the independent prognostic factors for survival led to the development of the MDACC prognostic score, a modification of the RMH score that strengthens it.
Keywords: ECOG performance status, Phase I trials, prognostic score, survival
Introduction
Phase I trials play a key role in the evaluation of novel targeted therapies in patients with advanced cancer. A primary challenge is to select patients who are most likely to benefit from investigational treatments, which is being facilitated by the increasing identification of molecular markers that can select subsets of such patients. Though Phase I trials have generally proven safe [1-3], an overall assessment of predicted survival of patients may further help in this decision making process. However, physicians are not necessarily able to accurately predict survival of their patients [4]. Some groups have therefore proposed models to predict outcome in patients with advanced cancers [4-7].
The objective of this study was to evaluate a large Phase I population in our clinic at MD Anderson to see if we could validate one of the best-established prediction models, the Royal Marsden Hospital (RMH) score (dichotomized by albumin <3.5 vs. ≥3.5mg/dL, LDH >upper limit of normal (ULN) vs. ≤ULN, and >2 vs. ≤2 sites of metastases) [1] and to identify additional risk factors related to overall survival. Therefore, we studied the clinical characteristics of 1,181 patients who presented to our Phase I clinic, and correlated these factors to survival outcomes. Our current paper validates the RMH score and proposes modifications that strengthen its predictive power.
Materials and Methods
We reviewed the electronic records of 1,181 consecutive patients who were treated on at least one clinical trial in the Phase I Clinical Trials Program (Clinical Center for Targeted Therapy) at MD Anderson Cancer Center beginning January 1, 2006. Investigational regimens available for patient enrollment varied over time depending upon protocol availability at the time of presentation. All patient electronic medical records were reviewed to determine clinical characteristics, treatment and clinical outcomes. This analysis as well as all treatment on clinical trials was performed in accordance with the guidelines of the MD Anderson Cancer Center Institutional Review Board.
Endpoints and Statistical Methods
The purpose of this study was to validate the RMH score and identify additional risk factors related to overall survival in 1,181 patients with advanced cancers treated in a Phase I Clinic. The primary endpoint of the current study was overall survival, which was measured from the time of presentation to the Phase I Program at MD Anderson until death from any cause or last follow-up. Patients still alive were censored for survival at the time of their last follow-up. Descriptive statistics were used to summarize the baseline patients' characteristics. Categorical data were described using contingency tables including counts and percentages. Continuously scaled measures were summarized with descriptive statistical measures (i.e., mean (± s.d.) or median (range)). Survival curves were estimated using the Kaplan-Meier method. Univariate log-rank test was used to compare survival distributions between groups.
The following covariates were analyzed in univariate analysis (Table 1), including: age (>60 vs. ≤60 years); gender; tumor type (breast, gastrointestinal, genitourinary, gynecological, lung/thoracic/head and neck, and others); ECOG performance status (0, 1, 2 or 3) [2]; liver metastases (yes vs. no); history of thromboembolism (yes vs. no); platelet levels (<140, 140-440, >440 K/UL); albumin levels (<3.5 vs. ≥3.5 mg/dL); number of prior therapies (0, 1, 2, 3, 4, 5+); history of prior radiation (yes vs. no); history of prior surgery (yes vs. no); number of metastatic sites (≤2 vs. >2); LDH levels (≤618 vs. >618 IU/L), and Royal Marsden Hospital (RMH) score (0 or 1 vs. 2 or 3). The RMH score includes the following poor prognostic variables: albumin <3.5 mg/dL; LDH > upper limit of normal (ULN) (618 IU/L in our institution), and >2 sites of metastases. These variables were measured at the time of presentation to the Phase 1 program. The multivariate Cox proportional hazards regression model was used to validate the RMH score using our complete data set. We examined the predictive ability of prognostic factors for survival using Harrell's c-statistic [3]; higher c-statistic indicates greater predictive ability.
Table 1. Univariate analysis of survival in 1,181 patients by characteristics at first visit to Phase I clinic.
| Variables | N (%) | Number of deaths | Median Survival (months) (95% CI) |
Survival Rate (one year) (%) |
p-value |
|---|---|---|---|---|---|
| 1181 | 795 | 10.0 (9.1, 10.9) | 44 | ||
|
| |||||
| Age in years | |||||
| ≤60 | 660 (55.9) | 434 | 10.9 (9.7, 12.1) | 46 | 0.125 |
| >60 | 521 (44.1) | 361 | 9.1 (8.1, 10.1) | 41 | |
| Sex | |||||
| Female | 594 (50.3) | 392 | 10.1 (8.8, 11.2) | 44 | 0.86 |
| Male | 587 (49.7) | 403 | 9.8 (8.5, 11.4) | 44 | |
| Tumor Classification | |||||
| Breast | 112 (9.5) | 83 | 8.3 (6.6, 10.8) | 35 | <0.0001 |
| Gastrointestinal | 392 (33.2) | 310 | 7.4 (6.6, 8.1) | 30 | |
| Genitourinary | 110 (9.3) | 67 | 12.8 (9.6, 17.5) | 54 | |
| Gynecological | 82 (6.9) | 55 | 8.3 (6.8, 11.0) | 35 | |
| Lung/Thoracic/Head and Neck | 149 (12.6) | 81 | 15.5 (12.2, 23.1) | 59 | |
| Others | 336 (28.5) | 199 | 15.5 (12.0, 18.3) | 55 | |
| ECOG PSa | |||||
| 0 | 369 (31.2) | 234 | 13.8 (11.6, 17.1) | 54 | <0.0001 |
| 1 | 705 (59.7) | 470 | 9.1 (8.0, 10.3) | 41 | |
| 2 | 83 (7.0) | 68 | 4.1 (3.5, 6.6) | 26 | |
| 3 | 7 (0.6) | 7 | 3.1 (2.9, NA) | 29 | |
| Liver metastases | |||||
| No | 683 (57.8) | 413 | 12.8 (11.3, 15.2) | 52 | <0.0001 |
| Yes | 498 (42.2) | 382 | 7.6 (6.6, 8.4) | 33 | |
| History of Thromboembolism | |||||
| No | 991 (83.9) | 656 | 10.8 (9.7, 11.7) | 46 | 0.0005 |
| Yes | 190 (16.1) | 139 | 7.7 (6.2, 9.5) | 33 | |
| Platelets (K/UL)a | |||||
| <140 | 112 (9.5) | 84 | 8.3 (6.8, 12.7) | 39 | <0.0001 |
| 140 - 440 | 928 (78.6) | 603 | 10.5 (9.6, 11.8) | 46 | |
| >440 | 136 (11.5) | 106 | 7.9 (6.3, 10.1) | 32 | |
| Albumin (mg/dL)a | |||||
| ≥3.5 | 1041 (88.1) | 684 | 10.9 (10.1, 12.0) | 47 | <0.0001 |
| <3.5 | 133 (11.3) | 107 | 5.4 (3.9, 6.8) | 20 | |
| Number of prior therapies | |||||
| 0 | 66 (5.6) | 25 | 25.3 (22.8, NA) | 81 | <0.0001 |
| 1 | 113 (9.6) | 65 | 16.9(14.6, 25.4) | 62 | |
| 2 | 192 (16.3) | 125 | 9.2 (7.7, 12.0) | 42 | |
| 3 | 201 (17.0) | 132 | 9.4 (7.8, 11.5) | 42 | |
| 4 | 187 (15.8) | 137 | 9.0 (7.5, 10.8) | 37 | |
| 5+ | 422 (35.7) | 311 | 8.3 (7.5, 9.7) | 38 | |
| Prior Radiation | |||||
| No | 593 (50.2) | 390 | 10.7 (9.5, 12.4) | 46 | 0.028 |
| Yes | 588 (49.8) | 405 | 9.2 (8.1, 10.7) | 42 | |
| Prior Surgery | |||||
| No | 293 (24.8) | 202 | 9.9 (8.1, 11.4) | 43 | 0.3253 |
| Yes | 888 (75.2) | 593 | 10.1 (8.8, 11.3) | 44 | |
| Number of metastatic sites | |||||
| ≤2 | 734 (62.2) | 457 | 12.4 (10.9, 14.6) | 51 | <0.0001 |
| >2 | 447 (37.8) | 338 | 7.4 (6.7, 8.1) | 31 | |
| LDH (IU/L)a | |||||
| ≤618 | 755 (63.9) | 449 | 14.0 (12.4, 16.0) | 55 | <0.0001 |
| >618 | 419 (35.5) | 343 | 6.8 (6.1, 7.4) | 24 | |
| RMH scorea | |||||
| 0 and 1 | 908 (76.9) | 573 | 12.3 (11.2, 13.8) | 51 | <0.0001 |
| >1 | 261 (22.1) | 216 | 5.5 (4.8, 6.6) | 19 | |
Baseline data at first visit to Phase I clinic was not available for all patients for variables including: ECOG PS (17 patients); platelets (5 patients); albumin (7 patients); LDH (7 patients); and, RMH score (12 patients).
Abbreviations: CI, Confidence Interval; ECOG, Eastern Cooperative Oncology Group; LDH, Lactate Dehydrogenase; PS, Performance Status; RMH, Royal Marsden Hospital.
We also wanted to identify additional independent prognostic factors predicting overall survival based on the MD Anderson data. A randomly selected training set, containing half of the patients was used to perform multivariate analysis to identify the independent prognostic factors for survival. We applied this to the validation set, containing the remaining patients and assessed the effectiveness using Harrell's c-statistic and “bootstrapping” method. Data from the patients who had all the data points (complete demographic and clinical data) at baseline was used to evaluate the two prognostic models. All statistical tests were two sided and p < 0.05 was considered statistically significant. Chi-square test was used to assess the correlation between the MDACC and RMH prognostic scores. Statistical analyses were carried out using SAS 9.1 (SAS Institute, Cary, NC) and S-Plus, version 7.0 (Insightful Corp., Seattle, WA) software.
Results
Patients
A total of 1,181 patients who were treated in the Phase I clinic on at least one Phase I trial were identified. The median age was 58 years (range, 3 to 89 years) and 44% of patients were older than 60 years. Only 66 patients (5.6%) had not received any therapy for their advanced disease prior to coming to the Phase I clinic and that was generally because of the unavailability of standard-of-care therapy options. Among the 1,115 patients who had received at least 1 prior treatment, the median number of prior treatments was 4 (range 1 to 17). The most common primary tumor site was the gastrointestinal tract (33%). The demographics of patients by primary tumor type are shown in Fig 1A. Other baseline patient characteristics include: 498 patients (42.2%) with liver metastases; 190 patients (16%) with a history of thromboembolism; 136 patients (12%) with elevated platelet levels (>440 K/UL); 419 patients (36%) with elevated LDH levels (>618 IU/L); and, 133 patients (11%) with low albumin levels (<3.5 mg/dL) (Table 1).
Fig 1A.
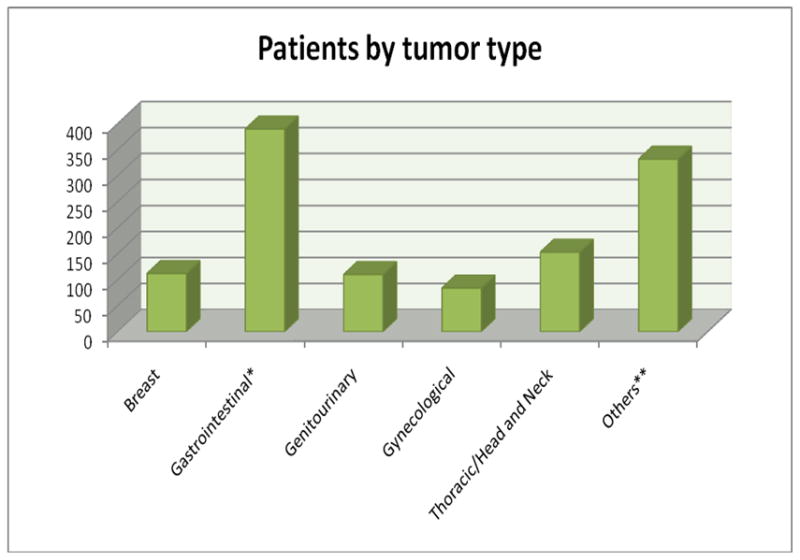
Patients by tumor type (total n=1,181).
Treatments
All the patients received treatment on at least one Phase I trial (range, 1 – 9) and 24% of patients were treated on more than one trial. 86% of our patients received a trial that included a targeted agent and 32% of patients were treated on a trial that included a cytotoxic agent. 18% of patients received treatment that included both a targeted agent and a cytotoxic agent. Of 1,181 patients, 893 patients were treated on one protocol; 196 on two protocols; 66 on 3 protocols; 16 on 4 protocols; four on 5 protocols; two on 6 protocols; three on 7 protocols; and, one patient was treated on 9 protocols. The composition of patients' treatment by study type is illustrated in Fig 1B.
Fig 1B.
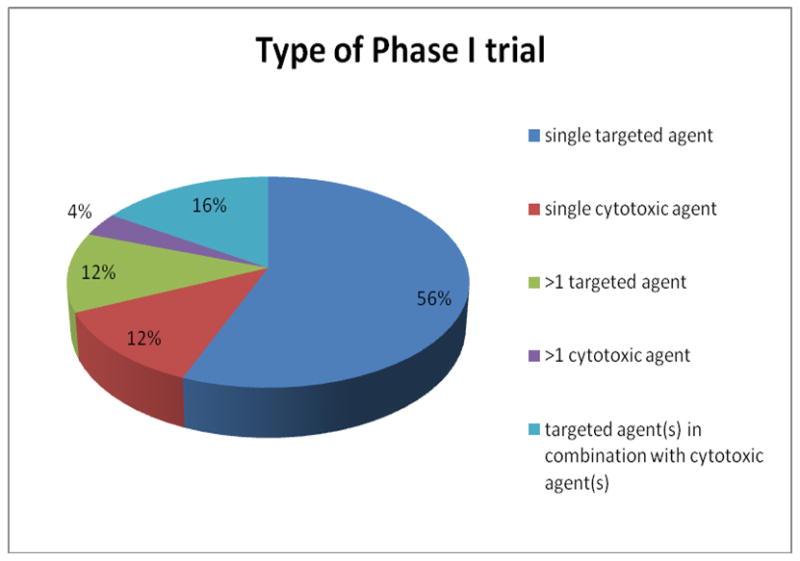
Type of Phase I trial.
Survival
Among 1,181 patients, there were 795 deaths after a median follow-up of 8.13 months. The overall median survival was 10 months (95% CI: 9.1 – 10.9 months) (Fig 2A). The survival rates at 6, 12, and 18 months were 70%, 44% and 32% respectively.
Fig 2A.
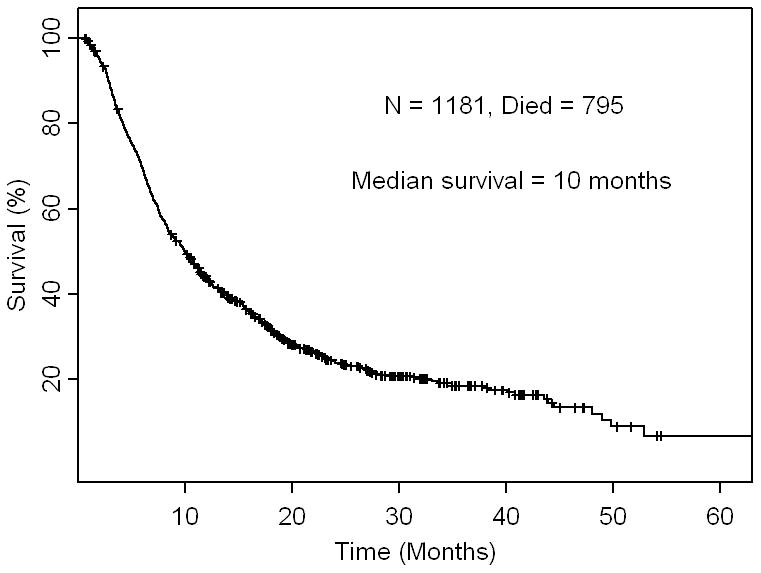
Kaplan - Meier survival curve for overall survival in 1,181 patients. Ticks represent patients still alive and hence censored at last follow up.
Univariate analysis on survival
The factors that were associated with shorter survival in univariate analysis (Table 1) were: tumor type (p<0.0001) (patients with gastrointestinal tumors had the worst survival); ECOG performance status ≥1 (p<0.0001); history of liver metastases (p<0.0001); history of thromboembolism (p=0.0005); elevated platelet levels (>440 K/UL) (p<0.0001); low albumin levels (<3.5 mg/dL) (p<0.0001); increasing number of prior therapies (p<0.0001); prior radiation (p=0.028); >2 metastatic sites (p<0.0001); LDH levels above normal (>618 IU/L) (p<0.0001), and RMH score >1 (p<0.0001) (RMH variables being albumin <3.5 mg/dL, LDH >upper limit of normal, and >2 sites of metastases).
Validation of RMH score
In the multivariate analysis using Cox proportional hazards models, a stepwise variable selection procedure was performed to identify the optimal set of independent variables for overall survival. The final model included low albumin levels (<3.5 mg/dL) (p<0.0001), number of metastatic sites >2 (p=0.0001), elevated LDH levels (>618 IU/L) (p<0.0001), gastrointestinal tumor type (p<0.0001), ECOG performance status ≥1 (p=0.0004), elevated platelet levels (>440 K/UL) (p=0.0047), and ≥3 prior therapies (p=0.0007) that were independently predictive of shorter survival. When the RMH score (which incorporates low albumin, elevated LDH, and >2 metastatic sites) was included in the Cox model, factors independently prognostic for survival were RMH score >1 (p<0.0001); gastrointestinal tumor type (p<0.0001); ECOG performance status ≥1 (p=0.0004); elevated platelet levels (>440 K/UL) (p=0.0008) and ≥3 prior therapies (p<0.0001) (Table 2). A subgroup analysis that stratified patients as colorectal carcinoma (n=231) versus those patients with other gastrointestinal tumors (n=161) failed to demonstrate statistically significant survival differences (median survival = 7.5 vs. 6.7 months respectively, p=0.64). In addition, we assessed effectiveness of the Cox model using the Harrell's c-statistic. The c-statistic was 0.592 for LDH (the best 1-variable model), 0.619 for LDH and the number of metastatic sites of disease (the best 2-variable model), and 0.637 for LDH, number of metastatic sites of disease and albumin (the best 3-variable model). The p-value was 0.008 for comparing the 1-variable model versus the 2-variable model and p = 0.0003 for comparing the 2-variable model versus the 3-variable model. This means that the RMH score is from the best 3-variable model.
Table 2.
Multivariate analysis of survival by independent predictors, including the RMH score variables (LDH, number of metastatic sites >2, and albumin) individually and then by including the RMH score by itself as a single variable.
| Risk Factors | RR for death | lower 95% CI |
upper 95% CI |
p-value |
|---|---|---|---|---|
| Albumin <3.5 mg/dLa | 1.66 | 1.34 | 2.05 | <0.0001 |
| Number of metastatic sites >2a | 1.34 | 1.16 | 1.55 | 0.0001 |
| LDH >618 IU/La,b | 1.78 | 1.53 | 2.06 | <0.0001 |
| Gastrointestinal tumor type | 1.55 | 1.34 | 1.80 | <0.0001 |
| ECOG PS ≥1 | 1.32 | 1.13 | 1.55 | 0.0004 |
| Platelets >440 K/UL | 1.35 | 1.10 | 1.67 | 0.0047 |
| Number of prior therapies ≥3 | 1.33 | 1.13 | 1.57 | 0.0007 |
| RMH score as single variable | ||||
|---|---|---|---|---|
|
| ||||
| Risk Factors | RR for death |
lower 95% CI |
upper 95% CI |
p-value |
| RMH score >1 | 1.97 | 1.67 | 2.32 | <0.0001 |
| Gastrointestinal tumor type | 1.65 | 1.43 | 1.92 | <0.0001 |
| ECOG PS ≥1 | 1.33 | 1.13 | 1.55 | 0.0004 |
| Platelet >440 K/UL | 1.43 | 1.16 | 1.76 | 0.0008 |
| Number of prior therapies ≥3 | 1.43 | 1.21 | 1.68 | <0.0001 |
Variables included in the RMH score
618 IU/L is the upper limit of normal for LDH at MDACC
Abbreviations: CI, Confidence Interval; ECOG, Eastern Cooperative Oncology Group; LDH, Lactate Dehydrogenase; PS, Performance Status; RMH, Royal Marsden Hospital; RR, Relative Risk.
MDACC prognostic score and the prognostic factor model
In order to identify additional independent prognostic factors predicting overall survival based on the MD Anderson data, we randomly selected a ‘training set’ with 50% of the patients and a ‘validation set’ containing the remaining patients. A multivariate Cox regression model was used to identify the independent prognostic factors within the training set (Table 3), which was applied to the validation set to get an unbiased estimate of its effectiveness based on Harrell's c-statistic. In the training data set, the Harrell's c-statistic is 0.643 for the best 3-variable model (RMH score), 0.659 for the best 4-variable model (p= 0.008, in comparison to 3-variable model), 0.673 for the best 5-variable model (MDACC score, p = 0.009 in comparison to the 4-variable model), and 0.676 for the best 6-variable model (p = 0.340, in comparison to the 5-variable model). Thus the 5-variable model (that includes low albumin levels (<3.5 mg/dL), number of metastatic sites >2, elevated LDH levels (>618 IU/L), gastrointestinal tumor type, and ECOG performance status ≥1) with the highest Harrell's c-statistic that was statistically significant, was chosen as a final model.
Table 3. Internal validation study of independent predictors of survival.
| Training data (randomly selected 50% of patients) | ||||
|---|---|---|---|---|
|
| ||||
| Variables | RR for death | lower 95% CI |
upper 95% CI |
p-value |
| Albumin <3.5 mg/dL | 1.58 | 1.16 | 2.15 | 0.0035 |
| Number of metastatic sites >2 | 1.42 | 1.15 | 1.75 | 0.0012 |
| LDH >618 IU/L | 1.74 | 1.40 | 2.15 | <0.0001 |
| Gastrointestinal tumor type | 1.68 | 1.36 | 2.07 | <0.0001 |
| ECOG PS ≥1 | 1.32 | 1.05 | 1.66 | 0.0160 |
| Platelet >440 K/UL | 1.40 | 1.05 | 1.88 | 0.0230 |
| Prior Treatment ≥3 | 1.40 | 1.10 | 1.78 | 0.0063 |
|
| ||||
| Validation data (the remaining 50% of patients) | ||||
|
| ||||
| Albumin <3.5 mg/dL | 1.69 | 1.25 | 2.29 | 0.0006 |
| Number of metastatic sites >2 | 1.26 | 1.03 | 1.55 | 0.0260 |
| LDH >618 IU/L | 1.83 | 1.48 | 2.27 | <0.0001 |
| Gastrointestinal tumor type | 1.42 | 1.15 | 1.76 | 0.0010 |
| ECOG PS ≥1 | 1.32 | 1.07 | 1.64 | 0.0110 |
| Platelet >440 K/ULa | 1.35 | 0.99 | 1.84 | 0.0540 |
| Prior Treatment ≥3a | 1.23 | 0.98 | 1.55 | 0.0730 |
Elevated platelet levels (>440 K/UL) and ≥3 prior therapies are not statistically significant in the validation set and are therefore not included in our prognostic score.
Abbreviations: CI, Confidence Interval; ECOG, Eastern Cooperative Oncology Group; LDH, Lactate Dehydrogenase; PS, Performance Status; RR, Relative Risk.
This result was validated in the validation data set (Table 3) and the Harrell's c-statistic was 0.661 for the best 5-variable model (i.e., the MDACC score), in comparison with a Harrell's c-statistic of 0.644 in the best 3-variable model (i.e., RMH score) (p =0.008). A similar result was also obtained using the “bootstrapping” method in which elevated LDH levels were independently significant in 100%, tumor type in 99%, low albumin levels in 93%, ECOG performance status ≥1 in 80%, number of metastatic sites >2 in 86% of the 1,000 resampled data sets from 1181 patients. The respective proportions are only 69% for ≥3 prior therapies and 55% for elevated platelet levels.
Our analyses based on MD Anderson data suggests that the three variables that are included in the RMH score, i.e., elevated LDH levels (>618 IU/L), low albumin levels (<3.5 mg/dL), number of metastatic sites >2, as well as ECOG performance status ≥1, and gastrointestinal tumor type are independent prognostic variables of survival.
MDACC prognostic score and the prognostic factor model
Based on the multivariate analysis and validation studies, the RMH score >1(elevated LDH levels (>618 IU/L), low albumin levels (<3.5 mg/dL), >2 metastatic sites), as well as ECOG performance status ≥1, and gastrointestinal tumor type were used as the basis of a prognostic score in the phase I program to develop a model for predicting an individual patient's survival (Supplementary Data, Fig 1). Because the relative risks associated with each of the independently significant risk factors were comparable, the relative risk of death could be characterized by summing the number of risk factors present at the first visit to the Phase I clinic. Risk groups were defined by comparing the relative risk of death in patients with each possible number of presenting risk factors (i.e., 0, 1, 2, 3, 4 or 5) and combining categories with similar relative risks (4 with 5). Patients were then assigned to one of five risk groups on the basis of their number of presenting risk factors: 0, low risk; 1, low-intermediate risk; 2, intermediate risk; 3, high-intermediate risk; and 4 or 5, high risk (Fig 3). The survival curves for the five risk groups are shown in Fig 2B. The median survival was 24.0 months for patients with low risk factors, 15.2 months for patients with low-intermediate risk, 8.4 months for patients with intermediate risk, 6.2 months for patients with high-intermediate risk, and 4.1 months for patients with high risk. At 6 months, 85%, 83%, 70%, 53%, and 36% of patients with low, low-intermediate, intermediate, high-intermediate, and high risk factors respectively were expected to remain alive. The respective rates at 12 months were 75%, 59%, 40%, 22%, and 13% (p<.0001).
Fig 3.
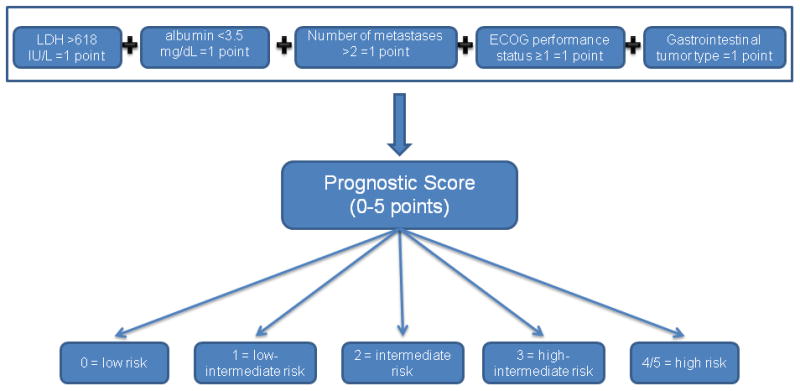
Proposed algorithm to assign patients to one of the five risk groups that predict survival characterized by summing the number of risk factors present at the time of first visit to the Phase I clinic. All risk factors carry equal weight.
Fig 2B.
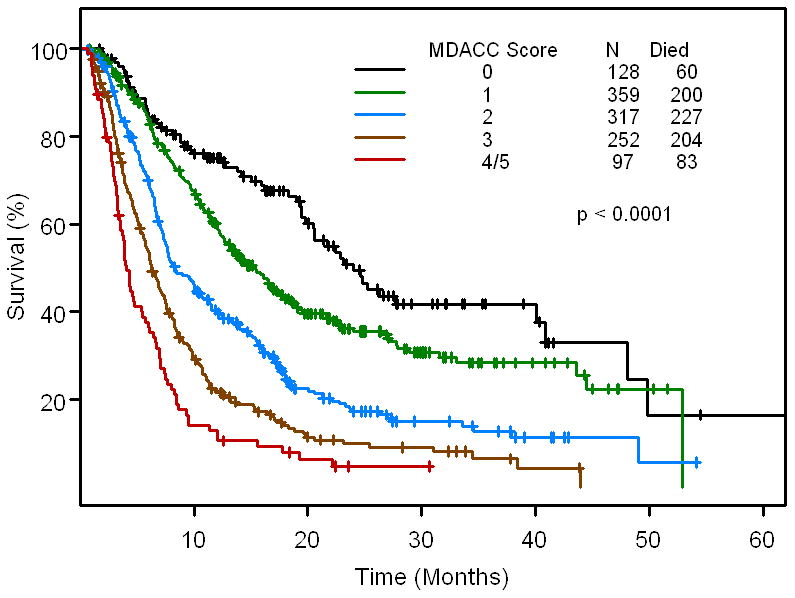
Kaplan - Meier survival curve for the 5 risk groups based on MDACC score (n=1,153 patients for whom all baseline data points were available). Ticks represent patients still alive and hence censored at last follow up.
When we compared the MDACC score with the RMH score of the 1,153 patients with complete data sets, the two scores were very similar (Supplementary Data, Table 1). This is best appreciated in Fig 2B and Fig 2C (Supplementary Data, Fig 2). If the patient had a low MDACC score, they also had a low RMH score. Therefore, there is high correlation between the MDACC score and the RMH score (p<0.00001).
Fig 2C.
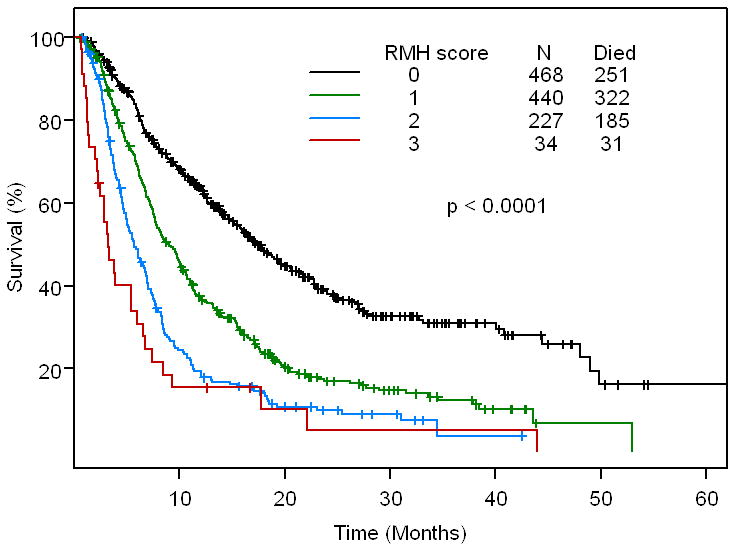
Kaplan - Meier survival curve for the 4 risk groups based on RMH score (n=1,169 patients for whom all baseline data points were available). Ticks represent patients still alive and hence censored at last follow up.
The predictive ability of the two models was assessed using Harrell's c-statistic; the higher the c-statistic, the better the predictive ability of the model. The Harrell's c-statistic is 0.664 (95%CI: 0.618 - 0.706) for MDACC score and 0.637 (95%CI: 0.591 - 0.681) for RMH score (p < 0.0001). This suggests that the MDACC score strengthens the prediction properties of the RMH score.
Discussion
We report an overall survival of 10 months (95% CI: 9.1 – 10.9 months) in 1,181 patients seen in our Phase I clinic, and treated with predominantly targeted agents. Previously, reports of overall survival in Phase I patient populations evaluated patients who were primarily treated on cytotoxic versus targeted therapies. Our survival rate is longer than those previously reported [4-7] which ranged from 5 to 9 months [1, 4, 6-8]. The survival rates of patients at 6 months and 12 months in this study were 70% and 44%. This appears comparable or better than previously demonstrated (43 to 70% for 6 months and 18 to 44% for 12 months respectively) [4], and is similar to the survival we reported earlier at 6 months (67%) and 12 months (40%) in a group of 200 patients [9]. While the increased use of targeted agents may be a significant factor in improved survival rates, other variables such as improved supportive care and different patient population between studies, may also play a role.
The Royal Marsden Hospital (RMH) score, a prognostic model for overall survival in patients treated with Phase I trials, has been proposed based on a retrospective review of 212 patients treated on Phase I studies [1]. In this model [1], Arkenau et al. found that elevated LDH levels, low albumin levels, and >2 sites of metastases were independently prognostic for poor survival. The RMH prognostic score suggests that patients with 0-1 risk factors have a significantly longer overall survival compared to patients with 2 to 3 risk factors. This model was prospectively validated in 78 patients [10], 68% of whom were treated on targeted therapies
Our results validated the RMH score. However, we found that the RMH score is strengthened by adding two additional independent prognostic variables, ECOG performance status ≥1 and gastrointestinal tumor type. In data published by a variety of authors, several of the clinical variables that constitute our current prognostic model have been previously associated with worse outcomes in patients with advanced cancer including: serum albumin [1, 4, 11-15]; increasing ECOG performance status [4, 8, 16]; and, the RMH score [1, 5, 10].
Patients in our Phase I clinic had an overall survival of 10 months. When our prognostic model was applied, we noted that patients with a low-risk score (0 risk variables) had an overall survival of 24.0 months versus those patients with the highest risk score (4-5 risk variables) whose overall survival was 4.1 months. Our results are relatively consistent with those reported using the RMH score where low-risk patients (0-1 factors) demonstrated a survival of 74.1 weeks (18.5 months) and high-risk patients (2-3 factors) showed survival 24.9 weeks (6.2 months) [1]. Our data provides additional stratification with patients with low-intermediate risk (1 variable; median survival =15 months); intermediate risk (2 variables; median survival =8 months); and high-intermediate risk (3 variables; median survival =6 months).
Gradually, the perception of Phase I trials – that they are unduly toxic and fail to provide clinical benefit – is being overcome as data supports relatively low toxicity rates [17] and a possibility of clinical benefit that rivals that of standard third-line chemotherapy options [18-20].
The strength of our model is based on a relatively large sample size of patients compared to the RMH model. Caution should be taken however, in generalizing our patient population to those at other institutions, due to the heterogeneity of tumor types and diverse prognoses. While our prognostic model has been internally validated, it will require additional prospective validation. Another potential weakness is the inherent subjectivity of ECOG performance status. Finally, caution needs to be used overall when basing clinical decision making on an ‘objective’ model and should not overcome best clinical judgment and an individualized approach to decision making on a patient-by-patient basis [21].
Emerging data suggests that matching patients with targeted agents based on molecular profile can be highly successful in the Phase I setting [22], and it will be important to determine if such matching independently affects survival. The use of a prognostic score may support clinicians' decision-making process and selection of studies that are best matched to patients' stated goals for treatment.
Supplementary Material
Translational Relevance.
We found an overall survival of 10 months in our Phase I population of 1,181 patients treated at M. D. Anderson Cancer Center in the Department of Investigational Cancer Therapeutics. We analyzed prognostic factors in this patient population and demonstrated that 5 clinical variables independently predicted survival including low albumin (<3.5 mg/dL), lactate dehydrogenase greater than upper limit of normal, greater than two sites of metastases, gastrointestinal tumor type, and ECOG performance status ≥ 1. We validated a previously published prognostic model from the Royal Marsden Hospital that included 3 of these 5 variables (low albumin (<35 g/L), lactate dehydrogenase greater than upper limit of normal, and more than two sites of metastases), strengthening their model with the addition of two variables. Our data provide a prognostic model for a Phase I population that may assist with clinical decision-making and selection of targeted therapies.
Footnotes
The authors have no financial disclosures.
Previous presentation: Poster discussion presentation at 2011 ASCO Annual Meeting, Chicago, Illinois.
References
- 1.Arkenau HT, Olmos D, Ang JE, de Bono J, Judson I, Kaye S. Clinical outcome and prognostic factors for patients treated within the context of a phase I study: the Royal Marsden Hospital experience. British Journal of Cancer. 2008;98(6):1029–1033. doi: 10.1038/sj.bjc.6604218. [DOI] [PMC free article] [PubMed] [Google Scholar]
- 2.Oken MM, Creech RH, Tormey DC, Horton J, Davis TE, McFadden ET, et al. Toxicity and response criteria of the Eastern Cooperative Oncology Group. Am J Clin Oncol. 1982;5(6):649–655. [PubMed] [Google Scholar]
- 3.Harrell FE, Jr, Lee KL, Mark DB. Multivariable prognostic models: issues in developing models, evaluating assumptions and adequacy, and measuring and reducing errors. Stat Med. 1996;15(4):361–387. doi: 10.1002/(SICI)1097-0258(19960229)15:4<361::AID-SIM168>3.0.CO;2-4. [DOI] [PubMed] [Google Scholar]
- 4.Bachelot T, Ray-Coquard I, Catimel G, Ardiet C, Guastalla JP, Dumortier A, et al. Multivariable analysis of prognostic factors for toxicity and survival for patients enrolled in phase I clinical trials. Ann Oncol. 2000;11(2):151–156. doi: 10.1023/a:1008368319526. [DOI] [PubMed] [Google Scholar]
- 5.Arkenau HT, Olmos D, Ang JE, Barriuso J, Karavasilis V, Ashley S, et al. 90-Days mortality rate in patients treated within the context of a phase-I trial: how should we identify patients who should not go on trial? European Journal of Cancer. 2008;44(11):1536–1540. doi: 10.1016/j.ejca.2008.04.017. [DOI] [PubMed] [Google Scholar]
- 6.Roberts TG, Jr, Goulart BH, Squitieri L, Stallings SC, Halpern EF, Chabner BA, et al. Trends in the risks and benefits to patients with cancer participating in phase 1 clinical trials. JAMA. 2004;292(17):2130–2140. doi: 10.1001/jama.292.17.2130. [DOI] [PubMed] [Google Scholar]
- 7.Janisch L, Mick R, Schilsky RL, Vogelzang NJ, O'Brien S, Kut M, et al. Prognostic factors for survival in patients treated in phase I clinical trials. Cancer. 1994;74(7):1965–1973. doi: 10.1002/1097-0142(19941001)74:7<1965::aid-cncr2820740723>3.0.co;2-1. [DOI] [PubMed] [Google Scholar]
- 8.Yamamoto N, Tamura T, Yamamoto N, Fukuoka M, Saijo N. Survival and prognostic factors in lung cancer patients treated in phase I trials: Japanese experience. International Journal of Oncology. 1999;15(4):737–741. [PubMed] [Google Scholar]
- 9.Wheler J, Tsimberidou AM, Hong D, Naing A, Jackson T, Liu S, et al. Survival of patients in a Phase 1 clinic: the M. D. Anderson Cancer Center experience. Cancer. 2009;115(5):1091–1099. doi: 10.1002/cncr.24018. [DOI] [PubMed] [Google Scholar]
- 10.Arkenau HT, Barriuso J, Olmos D, Ang JE, de Bono J, Judson I, et al. Prospective validation of a prognostic score to improve patient selection for oncology Phase I trials. Journal of Clinical Oncology. 2009;27(16):2692–2696. doi: 10.1200/JCO.2008.19.5081. [DOI] [PubMed] [Google Scholar]
- 11.Penel N, Vanseymortier M, Bonneterre ME, Clisant S, Dansin E, Vendel Y, et al. Prognostic factors among cancer patients with good performance status screened for phase I trials. Investigational New Drugs. 2008;26(1):53–58. doi: 10.1007/s10637-007-9088-x. [DOI] [PubMed] [Google Scholar]
- 12.Ray-Coquard I, Ghesquiere H, Bachelot T, Borg C, Biron P, Sebban C, et al. Identification of patients at risk for early death after conventional chemotherapy in solid tumours and lymphomas. British Journal of Cancer. 2001;85(6):816–822. doi: 10.1054/bjoc.2001.2011. [DOI] [PMC free article] [PubMed] [Google Scholar]
- 13.Seve P, Ray-Coquard I, Trillet-Lenoir V, Sawyer M, Hanson J, Broussolle C, et al. Low serum albumin levels and liver metastasis are powerful prognostic markers for survival in patients with carcinomas of unknown primary site. Cancer. 2006;107(11):2698–2705. doi: 10.1002/cncr.22300. [DOI] [PubMed] [Google Scholar]
- 14.Coates RJ, Clark WS, Eley JW, Greenberg RS, Huguley CM, Jr, Brown RL. Race, nutritional status, and survival from breast cancer. J Natl Cancer Inst. 1990;82(21):1684–1692. doi: 10.1093/jnci/82.21.1684. [DOI] [PubMed] [Google Scholar]
- 15.Liu SA, Tsai WC, Wong YK, Lin JC, Poon CK, Chao SY, et al. Nutritional factors and survival of patients with oral cancer. Head Neck. 2006;28(11):998–1007. doi: 10.1002/hed.20461. [DOI] [PubMed] [Google Scholar]
- 16.Daugherty C, Ratain MJ, Grochowski E, Stocking C, Kodish E, Mick R, et al. Perceptions of cancer-patients and their physicians involved in Phase-I trials. Journal of Clinical Oncology. 1995;13(5):1062–1072. doi: 10.1200/JCO.1995.13.5.1062. [DOI] [PubMed] [Google Scholar]
- 17.Wheler J, Tsimberidou AM, Wen S, Naing A, Hong DS, Falchook GS, et al. Toxicity in 1,181 patients with advanced solid tumors treated in phase I clinical trials of predominantly targeted agents: The M. D. Anderson Cancer Center experience. 2010 American Society of Clinical Oncology Annual Meeting 2010; Chicago: American Society of Clinical Oncology. 2010. [Google Scholar]
- 18.Garrido-Laguna I, Janku F, Falchook GS, Fu S, Hong DS, Naing A, et al. Patients with advanced head and neck cancers have similar progression-free survival on phase I trials and their last food and drug administration-approved treatment. Clinical Cancer Research. 2010;16(15):4031–4037. doi: 10.1158/1078-0432.CCR-10-0672. [DOI] [PubMed] [Google Scholar]
- 19.Tsimberidou AM, Vaklavas C, Wen S, Hong D, Wheler J, Ng C, et al. Phase I clinical trials in 56 patients with thyroid cancer: the M. D. Anderson Cancer Center experience. J Clin Endocrinol Metab. 2009;94(11):4423–4432. doi: 10.1210/jc.2009-0743. [DOI] [PMC free article] [PubMed] [Google Scholar]
- 20.Jain RK, Lee JJ, Hong D, Markman M, Gong J, Naing A, et al. Phase I oncology studies: evidence that in the era of targeted therapies patients on lower doses do not fare worse. Clinical Cancer Research. 2010;16(4):1289–1297. doi: 10.1158/1078-0432.CCR-09-2684. [DOI] [PMC free article] [PubMed] [Google Scholar]
- 21.Markman M. Assigning a cause for a particular outcome in oncology: a serious note of caution. Cancer. 2008;113(4):668–670. doi: 10.1002/cncr.23631. [DOI] [PubMed] [Google Scholar]
- 22.Stewart DJ, Kurzrock R. Cancer: the road to Amiens. J Clin Oncol. 2009;27(3):328–333. doi: 10.1200/JCO.2008.18.9621. [DOI] [PubMed] [Google Scholar]
Associated Data
This section collects any data citations, data availability statements, or supplementary materials included in this article.


