

Abstract
Normal microvessel structure and function in the cochlea is essential for maintaining the ionic and metabolic homeostasis required for hearing function. Abnormal cochlear microcirculation has long been considered an etiologic factor in hearing disorders. A better understanding of cochlear blood flow (CoBF) will enable more effective amelioration of hearing disorders that result from aberrant blood flow. However, establishing the direct relationship between CoBF and other cellular events in the lateral wall and response to physio-pathological stress remains a challenge due to the lack of feasible interrogation methods and difficulty in accessing the inner ear. Here we report on new methods for studying the CoBF in a mouse model using a thin or open vessel-window in combination with fluorescence intra-vital microscopy (IVM). An open vessel-window enables investigation of vascular cell biology and blood flow permeability, including pericyte (PC) contractility, bone marrow cell migration, and endothelial barrier leakage, in wild type and fluorescent protein-labeled transgenic mouse models with high spatial and temporal resolution. Alternatively, the thin vessel-window method minimizes disruption of the homeostatic balance in the lateral wall and enables study CoBF under relatively intact physiological conditions. A thin vessel-window method can also be used for time-based studies of physiological and pathological processes. Although the small size of the mouse cochlea makes surgery difficult, the methods are sufficiently developed for studying the structural and functional changes in CoBF under normal and pathological conditions.
Keywords: mouse cochlea, intra-vital-microscopy, microcirculation, cochlear lateral wall
1. Introduction
Normal function of the microcirculation in the cochlear lateral wall is critically important for maintaining ion and fluid balance in the inner ear. Sensory hair cells are strikingly vulnerable to ischemia, and disruption of cochlear blood flow (CoBF) is implicated in many inner ear pathologies (Brown et al., 1995; Gratton et al., 1996; Le Prell et al., 2007; Miller et al., 1995; Nakashima et al., 2003; Nuttall, 1999; Offner et al., 1987; Shi, 2011; Trune et al., 2012; Wangemann, 2002). Surgical access to the cochlea, however, is challenging. Direct measurement of CoBF is difficult and techniques for assessing blood flow are still under development. Various methods are used for assessment of CoBF, including laser-doppler flowmetry (LDF), magnetic resonance imaging (MRI), fluorescence intra-vital microscopy (FIVM), fluorescence microendoscopy (FME), as well as approaches based on injection of dye labeled or radioactive microspheres into the blood stream (Angelborg et al., 1988; Choudhury et al., 2010; Larsen et al., 1982; Le Floc'h et al., 2014; Monfared et al., 2006; Nakashima et al., 2002; Reif et al., 2012; Subhash et al., 2011). Approaches such as LDF, MRI, and injection of microspheres into the blood plasma are limited in providing information on relative change in blood flow rather than absolute flow rate in individual vessels. FME, a powerful tool for studying CoBF which consists of a flexible imaging fiber coupled to a system for detecting fluorescence, enables investigation of CoBF in single vessels. While FME is limited to certain cochlear areas, including the round window membrane, spiral ligament, and osseous spiral lamina, the endoscope is versatile and small enough for relatively non-invasive imaging of regional (near the round window) blood flow. It is not suitable, however, for imaging blood flow in the stria vascularis. Recently developed optical microangiography (OMAG) enables visualization of CoBF in the apical area of the intact cochlea, however, the method provides less sufficient resolution to resolve individual capillaries of the stria vascularis in a mouse model (Subhash et al., 2011). Fluorescent IVM in combination with a vessel-window in the cochlear otic wall enables sufficient optical resolution for investigation of capillary diameter and blood flow velocity under experimental conditions. It is an established and well validated method for research of lateral wall pathophysiology in larger rodents such as the guinea pig (Axelsson et al., 1990; Nuttall, 1987; Nuttall, 1988). IVM provides excellent temporal resolution for real-time tracking of changes in cochlear hemodynamics in vivo. However, IVM has not heretofore been developed for the murine model. In this report we demonstrate the feasibility of open and thin vessel-window preparations in an adult mouse model using an FIVM system. Both thin and open otic windows provide quantitative images useful in studies of lateral wall CoBF. A thin vessel-window minimizes damage and experimental artifacts in in vivo imaging of cochlear events and opens opportunities for longer time series imaging of the cochlear microcirculation in mouse models. By contrast, an open vessel-window preparation provides for better resolution and easier application of pharmacological agents to the cochlear lateral wall (e.g, therapeutic or totoxic agents), but at the cost of possibly disturbing cochlear homeostasis. Nevertheless, the two methods do provide complimentary means for studying structural and functional changes in the cochlear microcirculation under normal and pathological conditions. Application of these techniques with recently developed transgenic mice models has the potential for significantly advancing research on CoBF, particularly for unraveling the links between hearing function and pathology related to CoBF and the blood-labyrinth barrier.
2. Materials and Methods
2.1. Animals
Mice used in this study were purchased from the Jackson Laboratory, including the strains C57BL/6J (stock number: 000664, ages: 6 ∼ 8 weeks); C57Bl/6-Tg mice (UBC-GFP, stock number: 004353, ages: 4 weeks); CBA/CaJ mice (stock number: 000654, ages: 6 ∼ 8 weeks); NG2DsRedBAC transgenic mice (stock number: 008241000664, ages: 8 ∼ 12weeks). CBA/CaJ mice were used in the sound stimulation experiments. C57BL/6J and 57Bl/6-Tg mice were used in bone marrow transplantation experiments [C57Bl/6-Tg mice served as donor mice, C57BL/6J mice the recipients, reconstituted green fluorescence protein (GFP) labeled-bone marrow derived cells (GFP+-BMDCs) were assessed at age 18 months]. NG2DsRedBAC transgenic mice were used in experiments to study pericytes (PCs). All animal experiments reported here were approved by the Oregon Health & Science University Institutional Animal Care and Use Committee (IACUC). The approval number is MU7_IS00001157. Euthanasia was carried out using methods approved by the American Veterinary Medical Association Panel on Euthanasia.
2.2. Surgical preparation
2.2.1. Surgery to create an open window
The mice were anesthetized with an i.p. injection of a mixture of ketamine (100 mg/ml; 0.067 mg/gm) and xylazine (20 mg/ml; 0.013 mg/gm) wrapped in a heating pad, and maintained with rectal temperature approximately 37° C. Anesthetic depth was ascertained by monitoring the paw reflex and the general muscle tone. The left bulla was opened via a lateral and ventral approach, leaving the tympanic membrane and ossicles intact (Nuttall, 1987; Shi et al., 2002a). Two different methods can be employed to create an open vessel-window: (1) The open vessel-windows can be created using a small knife blade (a custom milled #16 scalpel) to make a rectangular fenestrate (approximately 0.1 × 0.1 mm) over the spiral ligament. The area is by gently scored and then elevated with the knife (Nuttall, 1987; Shi et al., 2002a). (2) The open vessel-window can be created by scraping the lateral wall bone until a thin spot is cracked. The bone chips are removed with small wire hooks, and a window opened over the spiral ligament. The latter method is generally found more convenient. In both procedures the vessel-window is covered with a cut microscope coverslip (Cat# 12-542A, Fisher Scientific) to preserve normal physiological conditions and provide the best optical view for recording vessel images.
2.2.2. Surgery to create a thin vessel-window
In preparation for a thin vessel-window, the mucosa on the bone of the basal turn was first removed and then the bone dried using sterile cotton swabs. Using the same custom milled #16 scalpel (as above), the bone was thinned with extremely slow and gentle cutting. No direct downward pressure was applied to the bone. The thickness of the cochlear lateral wall was occasionally checked by adding saline to the thinned area and viewing it in the operating microscope. The bone cutting was accomplished by light sweeping motions nearly parallel to the cochlear lateral wall were used (when thinning the cochlear wall fails, the speed and volume of perilymph leakage indicates the fistula). In preparation for a ‘chronic’ thin vessel-window, the opened bulla was cleaned with sterile gauze and sealed with a piece of 3 × 2 × 1 mm3 subcutaneous adipose tissue. The surgical wound was closed under sterile conditions. Immediately after the procedure was completed, the animal received a subcutaneous injection of meloxicam at 1 mg/kg. To re-assess the thinned window, the bulla was re-opened and adipose tissue gently removed. If necessary, the area of the thin otic capsule was recreated by removing any fibrous tissue using the custom made scalpel blade. The thickness of the fibrous tissue in the ‘chronic’ preparation is dependent on the intervening time between the two consecutive experiments. If the two experiments are done within one week, the fibrous tissue over the tinned vessel-window is relatively thin. Thicker fibrous tissue occured when more than one week intervened between experiments. This procedure can be repeated to allow further experiments. Meloxicam was administered at the same dose as described previously for recovery surgery.
2.3. Recording CoBF with fluorescein isothiocyanate dextran (FITC-dextran) labeling of blood plasma
CoBF was visualized using FITC-dextran dye as a contrast medium for the blood stream (Nuttall, 1987). FITC-dextran (Sigma) was slowly administrated intravenously to the mouse at a concentration of 40 mg/ml in 0.1 ml physiological solution over a 5 min interval. The blood vessels were imaged using an Olympus BXFM fluorescence microscope equipped with a long working distance objective (20×, 0.42 NA or 50×, 0.55 NA). The instrument lamp housing includes a multiple band excitation filter (390/482/563/640nm BrightLine® quad-band pass) and a compatible emission filter (446/523/600/677nm BrightLine® quad-band band pass). The video was recorded with a Hamamatsu Orca-ER high resolution digital B/W CCD Camera (model C4742-80-12AG) at a rate of 30 frames/sec and digitally saved to a computer disk. By adjusting the optical focus, blood vessels of either the spiral ligament or the stria vascularis can be ‘imaged’.
2.4. Blood vessel diameter, blood flow velocity and vascular permeability measurements
The internal (luminal) diameter of the capillaries was determined from acquired images. Image J was used to determine the distance between two fixed points across the capillary (Dai et al., 2011). Capillary diameter was measured at locations of maximum response. Dilation was assessed as a percentage of the baseline diameter. Blood velocity was determined from captured video frames and analyzed off-line, calculated by a cross-correlation method using custom-made image analysis software (Dai et al., 2011). In brief, the luminal intensity spatial structure is captured in image sequences which are cross-related using the custom software. For two locations along a vessel the time difference of maximum correlation was determined. Blood flow velocity was calculated by dividing the spatial distance between the image locations (D) by the time difference, .
Vascular permeability in vivo was assessed by recording tracer movement observed through the prepared open vessel-window. Vascular permeability in control and noise-exposed animals (immediately at the cessation of the loud sound stimulation regime) was assessed using a FITC conjugated bovine albumin tracer (FITC–albumin, 66 kDa, A-9771, Sigma). FITC-albumin (40 mg/ml in 100 μl saline) was i.v. administered into the femoral vein of the anaesthetized mouse 10 min prior to recording. Albumin leakage was quantified by comparing the mean fluorescence intensity (I) of two 10 × 5 μm windows: one window within the vessel (Iv) and the other in the perivessel interstitium (Ii), 10 μm away from the vessel wall. Ibackground was measured as the mean intensity over the observed area just prior to intravenous infusion of FITC–albumin (with video analysis software). The albumin leakage index (Alindex) was calculated as [(Ii−Ibackground away from vessel area)/(Iv−Ibackground away from vessel area)]×100% (Shi et al., 2002b).
2.5. Imaging and assessment of PC contractility
To better visualize fluorescently labeled PCs in NG2DsRedBAC transgenic mice, blood vessels were labeled with FITC-dextran. PCs were recognized by the red fluorescence signal of the NG2DsRedBAC excited at 563 nm wavelength, the emission fluorescence acquired through a 600 nm filter. Blood vessels were visualized by exciting at 482 nm and collecting the emission through a 533 nm filter. The created open vessel-window was monitored by video-microscopy using a long working-distance objective lens (20×, NA 0.42).
To determine PC contractility, extracellular CaCl2 at 10 mM was topically perfused to the open vessel-window. Blood vessel diameter was measured before and after CaCl2 application, and the effect of CaCl2 on PC contractility analyzed. Image J software was used to measure the luminal diameters at both PC and non-PC locations (more than 10 μm distant from the PC soma). Luminal diameter near PC and non-PC locations, as well as the size of PCs, was measured at the beginning of the perfusion of the agent and at the time when the change in diameter was a maximum.
2.6. Bone marrow cell transplantation
The method of bone marrow cell transplantation was previous published (Dai et al., 2010). Briefly, recipients (C57BL/6J mice) were irradiated (at 9 Gy) with γ-emitting source and reconstituted with a single periorbital sinus injection of 2 × 10⁷ GFP+-BMDCs in 200 μl of modified HBSS from donor transgenic C57Bl/6-Tg mice. Two transplanted mice (age 18 months from a group of mice used in different study) were used to visualize fluorescent labeled bone marrow cells in the opened window. To visualize the capillary boundary, endothelial cells were pre-labeled with the fluorescent dye 1,1-Dioctadecyl-3,3,3,3-tetramethylindocarbocyanine Perchlorate Dil (Dai et al., 2011), dissolved in dimethyl sulfoxide (DMSO, 6 mg/ml, 472301, Sigma). Immediately prior to i.v. infusion, the stock solution was diluted with PBS to a final concentration of 3 mg/ml, filtered, and injected into the mouse's femoral vein. 0.1 ml of the dye solution was slowly administrated over a 5 min interval. Since DMSO has an effect on vessel diameter (Wangemann et al., 1998), the final concentration of DMSO in Dil was less than 0.01% by volume.
To visualize GFP+-BMDC migration in the cochlear lateral wall, the vessels were labeled with fluorescence dye Dil. The GFP+-BMDCs were observed through the vessel-window at 482 nm excitation and 523 nm emission. Vessels were visualized at 563 nm excitation and 600 nm emission. The images were recorded with a CCD camera at 30 frames/sec and digitally saved.
2.7. Measurement of the endocochlear potential (EP)
The method used to measure EP was previously reported (Zhang et al., 2012). Briefly, the endocochlear potential was recorded under anesthesia as described above, with a silver–silver chloride reference electrode placed under the skin of the dorsal head. An incision was made in the inferior portion of the left post-auricular area and the bulla perforated, exposing the basal turn of the cochlea. A micropipette electrode (∼ 2 μm) filled with 150 mM KCl was advanced through the surgical field into the spiral ligament in control and in experiment mice (immediately after creating an open vessel-window). Potentials were recorded with entry of the electrode tip into endolymph, and the electrode advanced until a stable potential was observed. The signal was amplified (model 3000 AC/DC differential amplifier; A-M Systems, Inc.) and displayed in real-time to guide the procedure. DC potentials were digitalized by an A/D converter and recorded on a computer. The calibrated computer recording was used to measure the EP potential in a post-procedure analysis.
2.8. Measurement of thickness of the thinned otic bone
Cochleae from mice subjected to otic bone thinning and controls were perfused with 4% paraormaldehyde (PFA), with the cochlea subsequently harvested, post-fixed in 4% PFA at 4°C, and decalcified overnight in Decal® bone decalcifier. The decalcified cochlea was rinsed with two changes of PBS, and dehydrated in graded ethanol baths from 70% to 100%. Baths were repeated two times for 30 min at each ethanol concentration. The cochlea was then cleared with at least two changes of citrisolve or until the tissue was fully translucent. Next the cochlea was bathed 2× for 45 min in paraffin wax embedding medium under vacuum at 56°C. The cochlea was then oriented in a tissue mold and embedded in paraffin wax. The tissue was cut into 5 μm thick sections, collected on Superfrost Plus glass slides, and incubated for two hours at 60°C for adhesion. The specimens were viewed under DIC microscopy on an inverted FV1000 Olympus laser-scanning confocal microscope and thin section micrographs were recorded. Using a calibrated reticle, thickness of the otic bone was assessed ex-vivo for 10 mid-sections, 5 thin otic windows and 5 controls.
2.9. Sound stimulation
For ‘medium-level’ sound stimulation, a 40 kHz pure tone (a frequency localized for stimulation of the basal turn) was applied in the external ear canal. Sound was administered closed field at an intensity of 85 dB SPL. CoBF was recorded for 3 min prior to sound stimulation, the last 3 min of the 10 min stimulation session, and for an an additional 3 min with the sound stimulation turned off.
For exposure to noise (‘high-level’ sound), the animals were placed in wire mesh cages and exposed to broadband noise at 120 dB SPL in a sound exposure booth for 3 h and for an additional 3 h the following day. The noise exposure regime, routinely used in our laboratory, produces permanent loss of cochlear sensitivity (Shi, 2009).
2.10. Isolation of the cochlear stria vascularis
After the thin window was created, the whole cochlea was isolated and the thin vessel-window was opened. The whole cochlea was immersed in 4% PFA fixative overnight. The entirety of the stria vascularis was isolated under a dissecting microscope and the isolated tissue imaged under a light microscope. The location of thin-vessel-window was identified by the ‘left-over bone chips’ on the edges of surgical vessel-window. Location of the vessel-window was determined using a calibrated reticle.
2.11. Statistics
All experiments were performed multiple times to validate the observations, with the data expressed as means ± SD. Statistical analysis was conducted using a Student's t test. A 95% confidence level was considered statistically significant.
3. Results
3.1. Visualization of blood vessels in the cochlear lateral through thin and open vessel-windows
The location of the thin and open vessel-windows made at the basal turn of the mouse cochlea is shown in Fig.1A (indicated by the dotted rectangle area). Figs. 1 B and C compare the optical quality of in vivo lateral wall blood vessels through thin and open vessel-windows. Blood vessels can be visualized with an intravenous injection of FITC-dextran to the blood plasma in both window preparations. However, the image quality of blood vessels viewed through an open vessel-window is discernibly better than through the thin vessel-window.
Fig. 1.
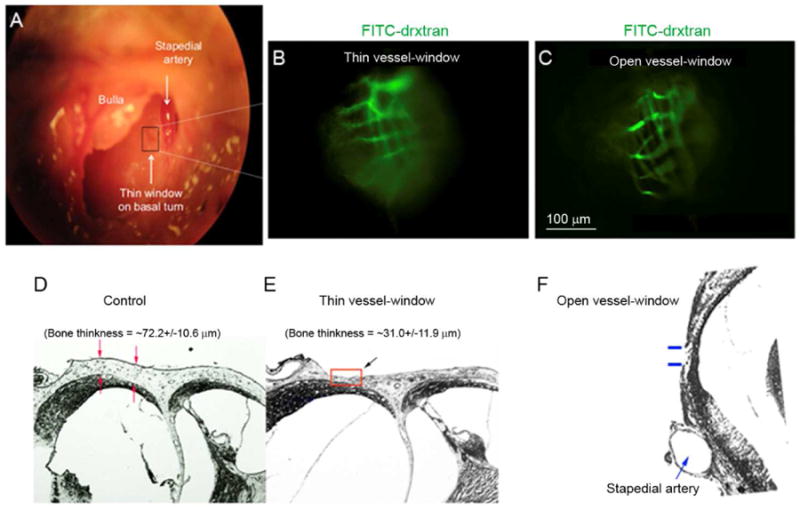
(A) The surgical view shows an opened bulla and location of the vessel-window (indicated by a black color rectangle in panel A) on the basal turn of a murine cochlea. Cochlear blood vessels are visualized with intravenously administrated FITC-dextran to the blood plasma. (B) and (C) show respectively in vivo captured images of strial blood vessels from a video monitor though a thin vessel-window and an open vessel-window. (D, E and F) Paraffin cross sections show the thickness of the otic bone in control (D), thinned otic bone (E, indicated by a red color rectangle), and open otic bone (F, indicated by blue color lines) preparations.
In the thin vessel-window preparation, a thickness of otic bone approximately half the value of the thickness of an intact otic bone enables imaging useful for identifying vasculature. Fig. 1D - F are paraffin cross sections, showing that non-thinned otic bone thickness in a normal adult, 4-6 week old CBA/CAJ mouse is approximately 72.2 ± 10.6 μm (n = 5, D), where the thinned otic bone was in the range of 31.0 ± 11.9 μm, n = 5, E). An opened otic bone is shown in (F).
3.2. Effect of an open vessel-window on EP
The thin window preparation leaves an intact lateral wall and minimizes disruption of the delicate homeostatic balance in the inner ear. An open window approach can cause the loss of perilymphatic fluid or a micro-injury to the cochlear spiral ligament, altering cochlear homeostasis. To evaluate the quality of the open vessel-window, we measured the EP in individual animals when the open vessel-window was made. Figs. 2A – E show representative EP recordings. The EP's of the five mice with an open vessel-window showed positive values ranging from + 84 mV to + 100 mV with a mean of + 96.8 mV ± 8.7 (Fig. 2 F). Our results show the open vessel-window preparation does not substantially effect EP when surgery is conducted with extreme gentleness and care (Fig. 2 F, n = 5, P > 0.05).
Fig. 2.
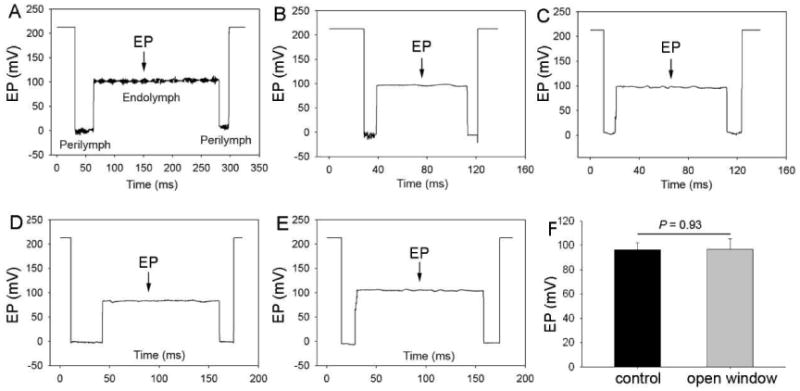
Representative EP waveforms (A) - (E) and average EP (F) values in an open vessel-window cochlea. There is no statistical difference in EP between the control and an open vessel-window preparation (n = 5, *P > 0.05).
3.3. Research applications of the two window preparations
3.3.1. An open vessel-window used to assess vascular leakage
An open vessel-window approach provides better spatial and temporal resolution of blood vessels compared to a thin vessel-window approach. For example, an open vessel-window preparation, combined with administration of a fluorescent tracer such as FITC-albumin, enables study of the vascular permeability in the cochlear lateral wall. Fig. 3 demonstrates vascular permeability in control (A) and noise-exposed mice (B). When animals were exposed to wide-band noise at 120 dB SPL for 3 h/ day for two consecutive days, the barrier becomes more permeable to large substances such as FITC-albumin, consistent with our previous report (Shi, 2009; Zhang et al., 2013). The difference in FITC-albumin leakage in control and noise-exposed animals can be compared by measuring background fluorescent signal, as demonstrated in Fig. 3C (n = 5, *P < 0.001).
Fig. 3.
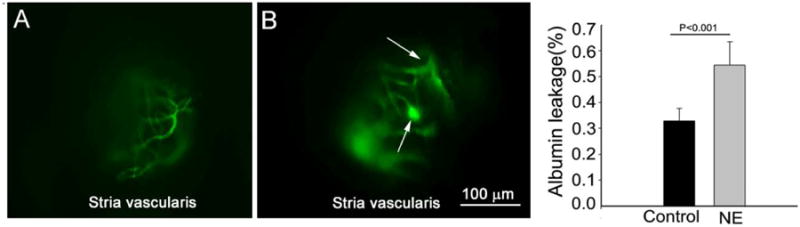
An open vessel-window preparation was used to study vascular permeability in control and noise-exposed mice. (A) shows FITC-albumin labeled blood vessel from the stria vascularis in a control animal. (B) shows FITC-albumin extravasation from leaked capillaries in a noise-exposed animal. The arrows point out the leakage sites. (C) The difference in albumin leakage in control and noise-exposed animals, seen as a general increase in the background signal, was statistically significant (n = 5, *P < 0.001).
3.3.2. An open vessel-window used to study PC contractility
An open vessel-window approach in combination with a transgenic mouse model can be used to study PC contractility. Neural/glial antigen 2 (NG2) is specifically expressed in cochlear PCs (Shi et al., 2008). PCs can be clearly visualized using a transgenic NG2DsRedBAC mouse model combined with an open vessel-window and fluorescence IVM system. Fig. 4A demonstrates that fluorescent labeled PCs are clearly visible on FITC–dextran labeled blood vessels through an open vessel-window.
Fig. 4.
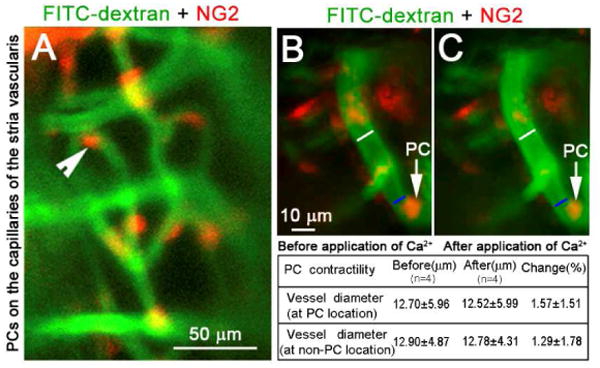
An open vessel-window preparation was used to visualize PCs and determine PC contractility using a DsRed labeled-PC transgenetic cell mouse model. (A) shows fluorescent labeled-PCs (red) distributed on the strial blood vessels labeled by intravenous injection of FITC-dextran. (B) and (C) show PCs contractility before and after application of 10 mM CaCl2. White lines on images B and C indicate the measured site of blood vessel diameter at the non-PC location (∼ 10 μm away from the PC site). Blue lines on images B and C indicate measured blood vessel diameter at PC location. There is no obvious change of vessel diameter at both PC- and non-PC locations (see data in the table).
Using the NG2DsRedBAC transgenic mouse, in conjunction with an open vessel-window and time-lapse photography, the role of PC contractility in regulating capillary diameter in the mouse model can be analyzed by comparing changes in lumen diameter at PC and non-PC locations. Figs. 4B and C, captured images before and 3 min after topical application of 10 mM CaCl2, to show effect of the vasoactive agent on PC contractility. No obvious change in capillary diameter at both PC and non-PC locations before and after application of CaCl2 was found. The method also permits in vivo study of the effect of other vasoactive agents such as adenosine triphosphate (ATP) and nitric oxide (NO) on PC physiology, all important for understanding CoBF regulation at a microvasculature level.
3.3.3. An open vessel-window used to track GFP+-BMDC migration
An open vessel-window preparation can be used to directly demonstrate that circulating bone marrow cells infiltrate to the cochlear lateral wall. Bone marrow derived stem cells have been shown to migrate to injured tissue such as the noise damaged cochlear lateral wall (Dai et al., 2010; Hirose et al., 2005; Lang et al., 2006). With this preparation, GFP+-BMDC migration in an older (18 month) GFP+-BMDC transplanted normal mouse can be directly visualized and recorded in vivo. The GFP+-BMDCs are better observed when the vasculature is labeled with a red fluorescence dye such as Dil. Figs. 5A - F show GFP+-BMDCs in the blood circulation and outside blood vessel under both low (20× lens, Figs. 5A - C) and high magnification (50× lens, Figs. 5D - 5F).
Fig. 5.
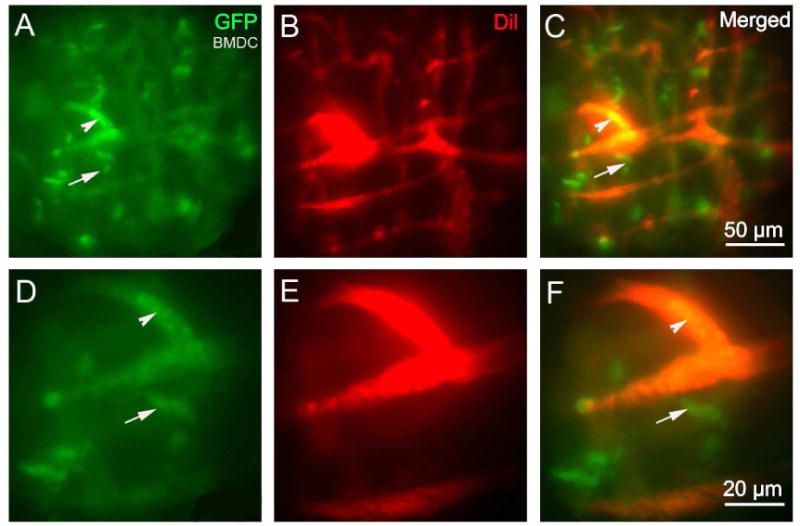
An open vessel-window preparation was used to visualize GFP+-BMDCs migration from cochlear lateral wall blood vessels in the lateral wall of a living mouse 18 months after bone marrow transplantation from a GFP donor mouse. (A) - (F) GFP+-BMDCs are shown migrated outside the blood vessel (red, labeled by Dil) under both low magnification (A) - (C) and high magnification (D) - (F). (Arrowheads point out GFP bone marrow cells that are inside of the blood vessels. Arrows point out GFP positive bone marrow cells that are outside of the blood vessels).
3.3.4. A thin vessel-window used to study the effect of sound on CoBF
The thinned otic bone preparation minimizes disturbance of underlying cochlear lateral wall tissue. A thin vessel-window approach can be utilized to study CoBF under physiological conditions. Fig. 6 demonstrates the effect of ‘medium-level’ sound on CoBF in a thin vessel-window preparation made in the region of the basal turn situated 80% from the apex (indicated by the red square in Fig. 6A). This location maps to 40 kHz sound stimulation (based on the sound frequency-map of Ou et al., 2000). With a thin vessel-window, we are able to measure the change in CoBF following 40 kHz sound stimulation at 85 dB SPL without surgically disturbing cochlear lateral wall tissues. Fig. 6, a representative image, shows the optical quality of microvessels in the thin vessel-window. Panels C and D in Fig. 6 respectively show measurements of the change in vessel diameter (Δ diameter = 7.49%, n = 15, *P < 0.05) and blood flow velocity (Δ velocity = 24.8%, n = 15, *P < 0.05) in mice after 10 min of sound exposure.
Fig. 6.
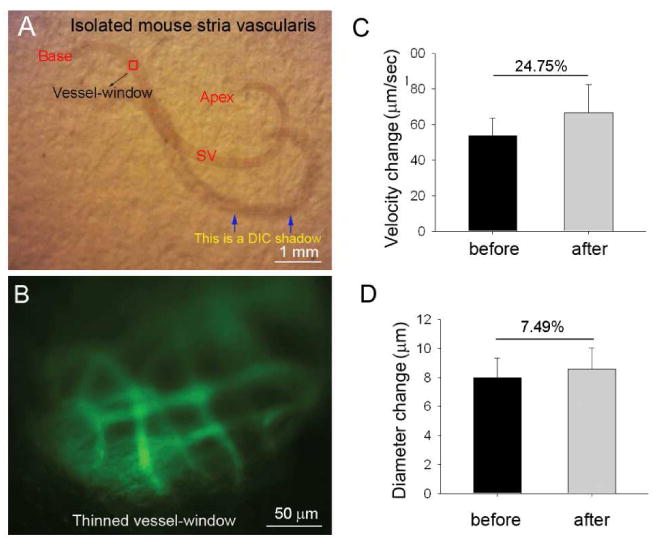
A thin vessel-window preparation was used to study sound-induced changes in blood-flow velocity and blood vessel diameter. (A) Isolated tissue of the cochlear lateral wall, where the red square indicates the location of the thin vessel-window. (B) FITC-dextran labeled blood vessel are visualized with IVM imaging through the thinned vessel-window. (C) - (D) Changes in CoBF velocity (C) and blood vessel diameter under control and sound stimulated conditions (D, n = 5, *P < 0.05).
3.3.5. A thin vessel-window preparation can be used in longer time studies
A thin vessel-window can also potentially be used for some prolonged studies. For example, it can be used to assess the effect of drug treatment or multiple sound exposures on the same microvasculature. The bulla after each imaging session can be surgically closed and the blood vessels within the thin vessel-window can be imaged over the course of days. In Fig. 7, we demonstrate the optical clarity of microvessels imaged through the thin vessel-window on days one, three, and seven after the window was created. The same microvasculature were clearly visualized after FITC-dextran was intravenously injected to the blood plasma. In this preparation, no evidence of perilymph leakage (i.e. accidental creation of a cochleostomy) was seen during multiple imaging sessions (though surgical skill is required to obtain these results).
Fig.7.
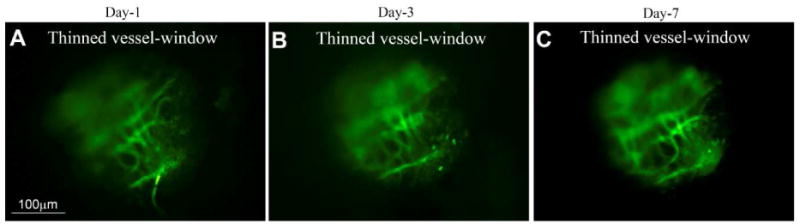
A thin vessel-window preparation can be used for time-based studies. (A), (B), and (C) respectively show captured images of FITC-dextran labeled blood vessel from a video monitor though a thin vessel-window at days 1, 3, and 7 after the thin vessel-window was created. At all time-points the FITC-dextran labeled blood vessel can be clearly seen through the same thin vessel-window.
4. Discussion
Normal hearing requires tight control over cochlear microcirculation. Reduced CoBF and disruption of the BLB are closely associated with a number of hearing disorders (Aimoni et al., 2010; Brown et al., 1995; Gratton et al., 1996; Gratton et al., 1997; Miller et al., 1995; Miller et al., 1988; Nakashima et al., 2003; Nuttall, 1999; Ohlemiller et al., 2008; Shi, 2011). However, techniques for assessing blood flow in the cochlear lateral wall are still under development. Here we report on new thin and open vessel-window approaches which, used in combination with fluorescence IVM, facilitate the study of CoBF and physiopathology of various lateral wall cell types in mouse models. Further progress in understanding cochlear microcirculation in mouse models, especially in transgenic models, will lead to a better understanding of CoBF associated cochlear homeostasis.
Two distinct networks, including the capillaries of the spiral ligament and capillaries of the stria vascularis, are arranged in parallel in the cochlear lateral wall (Axelsson, 1968). Spiral ligament capillaries are usually smaller in diameter than strial capillaries (Shi et al., 2007). The strial capillaries are tightly packed with red blood cells. The velocity of blood flow in the strial network is much slower than in vessels of the spiral ligament (Nuttall, 1987). Both capillary systems are essential for maintaining cochlea hemostasis, ion balance, and nutrient supply. The specific functions of the two vessel systems have not fully characterized. Smooth muscle cells in arteriole vessel walls and PCs on capillaries are thought to regulate lateral wall blood flow in the spiral ligament (Dai et al., 2009). In contrast, capillaries of the stria vascularis are highly specialized vascular epithelia which form into polygonal loops (Axelsson, 1968). These capillaries comprise the blood-labyrinth-barrier, similar to the BBB (blood-brain-barrier) and BRB (blood-retina-barrier). Strial capillaries have a minor role in blood flow regulation, but a crucial one in maintaining the EP, ion transport, and endolymphatic fluid balance essential for the ear's sensitivity (Spicer et al., 2002; Wangemann, 2002; Zhang et al., 2013).
In this study of the mouse cochlea, we demonstrate that both capillaries of the spiral ligament and capillaries of the stria vascularis can be visualized with fluorophore labeling in open or thin window preparations under a fluorescence IVM system. The setup of the IVM system permits convenient placement of the animal preparation and manipulation of microscope position in the x-y plane. The vessels of the spiral ligament and vessels of the stria vascularis are distinguished by location and can be used to assess blood flow with adjustment of the optical focus. Most of the capillaries in the middle part of the spiral ligament passing in (optically) front of the stria vascularis run a more or less straight course from scala vestibule to scala tympani in the spiral ligament (Nuttall, 1987). These features enable the capillaries of the spiral ligament and stria vascularis to be distinguished. In general, the choice of the thin or open window approach is determined by experimental goals. A thin vessel-window with intact lateral wall minimizes disruption of the delicate homeostatic balance in the inner ear, but an open window approach provides better imaging resolution as well as better access to the tissue for stimulation with various drugs and chemicals. For example, the open vessel-window approach provides sufficient resolution for determination of vascular permeability and cell migration using different fluorescent tracers. Open vessel-windows are useful for examining changes in cell morphology, as well as pathophysiological parameters, in mouse models. PCs are of particular interest in cochlear physiology due to their role in modulating CoBF (Dai et al., 2009). In this study, using NG2DsRedBAC transgenic mice, the NG2 labeled PCs were readily observed in an open window preparation (Fig. 4). Investigation of the contractility of PCs on the strial capillaries was facilitated by applying CaCl2 to the open vessel-window. Change in vessel diameter at PC and non-PC locations was measured, with the level of change in capillary diameter taken as an indicator of PC contractility. An open vessel-window also proved extremely useful for tracing GFP+-cells in a second transgenic mouse model. In this study, we demonstrated the utility of the open window method in transgenic strains by observing GFP+- BMDCs in a post GFP+ bone marrow transplanted normal mouse (Fig. 5). In the experiment, the microvasculature was labeled with the red fluorescent dye, Dil, and GFP+ transplanted cells observed as green fluorescence. Locations of the green fluorescence labeled cells were easily identified within and outside the vessel. GFP+ transplanted cells outside the vessel indicate bone marrow cell migration to the stria vascularis in the aged mice. The drawback of an open vessel-window approach is the high degree of surgical skill required. A vessel-window which does not unduly disturb the underlying tissue is essential for maintaining a constant EP. In most of our studies we were able to maintain a constant and normal EP (as shown in Fig. 2).
The thin otic capsule window approach reported here is adopted from the thin cranial window, a technique widely used in brain studies (Drew et al., 2010). IVM is ideally suited to a thin cochlear vessel-window preparation for two reasons: 1) The original thickness of otic bone (approximately 70 μm) is thinned by half, reducing the optical scattering to levels sufficient for adequate visualization of vessels without the need to resort to 2-photon imaging and lower temporal resolution. 2) Imaging through a thin window leaves the lateral wall substantially intact, minimizing disruption of the delicate homeostatic balance in the inner ear. The main drawback of the thin window preparation is the increased optical scattering (relative to the open window preparation) and the introduction of bone auto-fluorescence to increase the background signal of the image. However these disadvantages are offset by the advantage of observing physiologically intact functional changes in CoBF and lateral wall biology. With intravenous injection of fluorescent dye, improvement to the signal-to-noise ratio enables observation of vessel diameter and blood flow velocity (Fig. 6). The approach is preferred if time-series imaging is required to assess an effect on cochlear lateral wall physiology at multiple time points without disturbing the perilymphatic compartment. For example, a thin vessel-window approach can be used to determine the dynamic changes in blood flow velocity and vessel diameter immediately following and at different time points after certain applications. These methods can also be exploited to investigate the acute healing response to cochlear insults such as trauma, infection, noise, foreign bodies, ototoxic drugs, or potentially any agent affecting the lateral wall. Although many other imaging modalities exist for tracking cells of various phenotypes in the inner ear, thin and open window methods have an advantage in unlocking a library of readily available transgenic mouse models for studying inner ear pathophysiology. For example, two-photon microscopy bypasses the problem of otic capsule induced optical scattering. Two-photon imaging, using a long working distance air objective and thin-window preparation, in our experiments resulted in increased spatial resolution at the expense of temporal resolution (data not shown). The decrease in temporal resolution limits real time in vivo analysis to single vessels and introduces movement artifacts.
Overall, this study demonstrates that fluorescence contrast video imaging of the microcirculation, viewed through either thin or open windows on the cochlea, provides sufficient resolution for CoBF studies.
Table 1. Fluorescence tracers applied in the study.
| Name | Type | Company | Catalog Number | Molecular Weight |
|---|---|---|---|---|
| fluorescein isothiocyanate dextran (FITC-dextran) | Reagent | Sigma-aldrich | 46945 | 70 kDa |
| 1,1-dioctadecyl-3,3,3,3-tetramethylindocarbocyanine perchlorate (Dil) | Reagent | Sigma-aldrich | 46895 | 933.87g/mol |
| Fluorescein isothiocyanate dextran (FITC-albumin) | Reagent | Sigma-aldrich | A-9771 | 66 kDa |
Highlights.
A new “thin” or “open” otic capsule vessel-window method has been developed in a mousemodel
The methods provide a means for studying changes in cochlear blood flow
The methods are useful for investigation of lateral wall cell patho-physiology
Acknowledgments
This work was supported by National Institutes of Health grants NIH NIDCD DC008888S1 (XS), NIH NIDCD R01-DC010844 (XS), R21DC1239801 (XS), R01-DC000105 (ALN) and NIHP30-DC005983.
Abbreviations
- ABR
auditory brainstem response
- EP
endocochlear potential
- IVM
intra-vital microscopy
- CoBF
cochlear blood flow
- GFP
green fluorescence protein
- FITC-dextran
fluorescein isothiocyanate dextran
- PFA
paraformaldehyde
- PC
pericyte
Footnotes
Author Contributions: XRS designed the experiments and wrote the manuscript, AN and ZU contributed to conceptualizing the experiments and writing the manuscript. FZ, DM, ZU, JHZ, LLN, SLZ, and SR performed experiments, collected, and analyzed the data
Conflict of interest: The authors declare no conflict of interest.
Publisher's Disclaimer: This is a PDF file of an unedited manuscript that has been accepted for publication. As a service to our customers we are providing this early version of the manuscript. The manuscript will undergo copyediting, typesetting, and review of the resulting proof before it is published in its final citable form. Please note that during the production process errors may be discovered which could affect the content, and all legal disclaimers that apply to the journal pertain.
References
- Aimoni C, Bianchini C, Borin M, Ciorba A, Fellin R, Martini A, Scanelli G, Volpato S. Diabetes, cardiovascular risk factors and idiopathic sudden sensorineural hearing loss: A case-control study. Audiology & neuro-otology. 2010;15:111–115. doi: 10.1159/000231636. [DOI] [PubMed] [Google Scholar]
- Angelborg C, Hillerdal M, Hultcrantz E, Larsen H. The microsphere method for studies of inner ear blood flow. Journal for Oto-Rhino-Laryngology, Head and Neck Surgery. 1988;50:355–362. doi: 10.1159/000276013. [DOI] [PubMed] [Google Scholar]
- Axelsson A. The vascular anatomy of the cochlea in the guinea pig and in man. Acta oto-laryngologica. 1968;(Suppl-243):3+. [PubMed] [Google Scholar]
- Axelsson A, Nuttall AL, Miller JM. Observations of cochlear microcirculation using intravital microscopy. Acta oto-laryngologica. 1990;109:263–270. doi: 10.3109/00016489009107442. [DOI] [PubMed] [Google Scholar]
- Brown NJ, Miller JM, Nuttall AL. Age-related changes in cochlear vascular conductance in mice. Hearing research. 1995;86:189–194. doi: 10.1016/0378-5955(95)00070-k. [DOI] [PubMed] [Google Scholar]
- Choudhury N, Chen F, Shi X, Nuttall AL, Wang RK. Volumetric imaging of blood flow within cochlea in gerbil in vivo. IEEE journal of selected topics in quantum electronics: a publication of the IEEE Lasers and Electro-optics Society. 2010;16:524–529. doi: 10.1109/JSTQE.2009.2032671. [DOI] [PMC free article] [PubMed] [Google Scholar]
- Dai M, Shi X. Fibro-vascular coupling in the control of cochlear blood flow. PloS one. 2011;6:e20652. doi: 10.1371/journal.pone.0020652. [DOI] [PMC free article] [PubMed] [Google Scholar]
- Dai M, Nuttall A, Yang Y, Shi X. Visualization and contractile activity of cochlear pericytes in the capillaries of the spiral ligament. Hearing research. 2009;254:100–7. doi: 10.1016/j.heares.2009.04.018. [DOI] [PMC free article] [PubMed] [Google Scholar]
- Dai M, Yang Y, Omelchenko I, Nuttall AL, Kachelmeier A, Xiu R, Shi X. Bone marrow cell recruitment mediated by inducible nitric oxide synthase/stromal cell-derived factor-1alpha signaling repairs the acoustically damaged cochlear blood-labyrinth barrier. The American journal of pathology. 2010;177:3089–99. doi: 10.2353/ajpath.2010.100340. [DOI] [PMC free article] [PubMed] [Google Scholar]
- Drew PJ, S AY, Driscoll JD, Knutsen PM, Blinder P, Davalos D, Akassoglou K, Tsai PS, Kleinfeld D. Chronic optical access through a polished and reinforced thinned skull. Nature methods. 2010;7:981–4. doi: 10.1038/nmeth.1530. [DOI] [PMC free article] [PubMed] [Google Scholar]
- Gratton MA, Schmiedt RA, Schulte BA. Age-related decreases in endocochlear potential are associated with vascular abnormalities in the stria vascularis. Hearing research. 1996;102:181–90. doi: 10.1016/s0378-5955(96)90017-9. corrected and republished article originallly printed in Hear Res 1996 May;94(1- 2):116-24. [DOI] [PubMed] [Google Scholar]
- Gratton MA, Schulte BA, Smythe NM. Quantification of the stria vascularis and strial capillary areas in quiet-reared young and aged gerbils. Hearing research. 1997;114:1–9. doi: 10.1016/s0378-5955(97)00025-7. [DOI] [PubMed] [Google Scholar]
- Hirose K, Discolo CM, Keasler JR, Ransohoff R. Mononuclear phagocytes migrate into the murine cochlea after acoustic trauma. The journal of comparative neurology. 2005;489:180–194. doi: 10.1002/cne.20619. [DOI] [PubMed] [Google Scholar]
- Lang H, Ebihara Y, Schmiedt RA, Minamiguchi H, Zhou D, Smythe N, Liu L, Ogawa M, Schulte BA. Contribution of bone marrow hematopoietic stem cells to adult mouse inner ear: mesenchymal cells and fibrocytes. The journal of comparative neurology. 2006;496:187–201. doi: 10.1002/cne.20929. [DOI] [PMC free article] [PubMed] [Google Scholar]
- Larsen HC, Angelborg C, Hultcrantz E. The effect of glycerol on cochlear blood flow. ORL; journal for oto-rhino-laryngology and its related specialties. 1982;44:101–7. doi: 10.1159/000275579. [DOI] [PubMed] [Google Scholar]
- Le Floc'h J, Tan W, Telang RS, Vlajkovic SM, Nuttall A, Rooney WD, Pontré B, Thorne PR. Markers of cochlear inflammation using MRI. Journal of magnetic resonance imaging : JMRI. 2014;39:150–161. doi: 10.1002/jmri.24144. [DOI] [PMC free article] [PubMed] [Google Scholar]
- Le Prell CG, Yamashita D, Minami SB, Yamasoba T, Miller JM. Mechanisms of noise-induced hearing loss indicate multiple methods of prevention. Hearing research. 2007;226:22–43. doi: 10.1016/j.heares.2006.10.006. [DOI] [PMC free article] [PubMed] [Google Scholar]
- Miller J, Ren T, Laurikainen E, Golding-Wood D, Nuttall A. Hydrops-induced changes in cochlear blood flow. The Annals of otology, rhinology, and laryngology. 1995;104:476–483. doi: 10.1177/000348949510400611. [DOI] [PubMed] [Google Scholar]
- Miller JM, Dengerink H. Control of inner ear blood flow. American journal of otolaryngology. 1988;9:302–16. doi: 10.1016/s0196-0709(88)80038-3. [DOI] [PubMed] [Google Scholar]
- Monfared A, Blevins NH, Cheung EL, Jung JC, Popelka G, Schnitzer MJ. In vivo imaging of mammalian cochlear blood flow using fluorescence microendoscopy. Otology & neurotology: official publication of the American Otological Society, American Neurotology Society [and] European Academy of Otology and Neurotology. 2006;27:144. doi: 10.1097/01.mao.0000190708.44067.b0. [DOI] [PMC free article] [PubMed] [Google Scholar]
- Nakashima T, Hattori T, Sone M, Sato E, Tominaga M. Blood flow measurements in the ears of patients receiving cochlear implants. The Annals of otology, rhinology, and laryngology. 2002;111:998–1001. doi: 10.1177/000348940211101108. [DOI] [PubMed] [Google Scholar]
- Nakashima T, Naganawa S, Sone M, Tominaga M, Hayashi H, Yamamoto H, Liu X, Nuttall AL. Disorders of cochlear blood flow. Brain research reviews. 2003;43:17–28. doi: 10.1016/s0165-0173(03)00189-9. [DOI] [PubMed] [Google Scholar]
- Nuttall AL. Techniques for the observation and measurement of red blood cell velocity in vessels of the guinea pig cochlea. Hearing research. 1987;27:111–9. doi: 10.1016/0378-5955(87)90012-8. [DOI] [PubMed] [Google Scholar]
- Nuttall AL. Cochlear blood flow: measurement techniques. American journal of otolaryngology. 1988;9:291–301. doi: 10.1016/s0196-0709(88)80037-1. [DOI] [PubMed] [Google Scholar]
- Nuttall AL. Sound-induced cochlear ischemia/hypoxia as a mechanism of hearing loss. Noise & health. 1999;2:17–31. [PubMed] [Google Scholar]
- Offner FF, Dallos P, Cheatham MA. Positive endocochlear potential: mechanism of production by marginal cells of stria vascularis. Hearing research. 1987;29:117–24. doi: 10.1016/0378-5955(87)90160-2. [DOI] [PubMed] [Google Scholar]
- Ohlemiller KK, Rice MER, Gagnon PM. Strial microvascular pathology and age-associated endocochlear potential decline in NOD congenic mice. Hearing research. 2008;244:85–97. doi: 10.1016/j.heares.2008.08.001. [DOI] [PMC free article] [PubMed] [Google Scholar]
- Ou HC, Harding GW, Bohne BA. An anatomically based frequency–place map for the mouse cochlea. Hearing research. 2000;145:123–129. doi: 10.1016/s0378-5955(00)00082-4. [DOI] [PubMed] [Google Scholar]
- Reif R, Qin J, Shi L, Dziennis S, Zhi Z, Nuttall AL, Wang RK. Monitoring hypoxia induced changes in cochlear blood flow and hemoglobin concentration using a combined dual-wavelength laser speckle contrast imaging and Doppler optical microangiography system. PloS one [electronic resource] 2012;7:e52041. doi: 10.1371/journal.pone.0052041. [DOI] [PMC free article] [PubMed] [Google Scholar]
- Shi X. Cochlear pericyte responses to acoustic trauma and the involvement of hypoxia-inducible factor-1alpha and vascular endothelial growth factor. The American journal of pathology. 2009;174:1692–704. doi: 10.2353/ajpath.2009.080739. [DOI] [PMC free article] [PubMed] [Google Scholar]
- Shi X. Physiopathology of the cochlear microcirculation. Hearing research. 2011;282:10–24. doi: 10.1016/j.heares.2011.08.006. [DOI] [PMC free article] [PubMed] [Google Scholar]
- Shi X, Nuttall AL. The demonstration of nitric oxide in cochlear blood vessels in vivo and in vitro: the role of endothelial nitric oxide in venular permeability. Hearing research. 2002;172:73–80. doi: 10.1016/s0378-5955(02)00513-0. [DOI] [PubMed] [Google Scholar]
- Shi X, Nuttall AL. Expression of adhesion molecular proteins in the cochlear lateral wall of normal and PARP-1 mutant mice. Hearing research. 2007;224:1–14. doi: 10.1016/j.heares.2006.10.011. [DOI] [PubMed] [Google Scholar]
- Spicer SS, Schulte BA. Spiral ligament pathology in quiet-aged gerbils. Hearing research. 2002;172:172–185. doi: 10.1016/s0378-5955(02)00581-6. [DOI] [PubMed] [Google Scholar]
- Subhash HM, Davila V, Sun H, Nguyen-Huynh AT, Shi X, Nuttall AL, Wang RK. Volumetric in vivo imaging of microvascular perfusion within the intact cochlea in mice using ultra-high sensitive optical microangiography. IEEE transactions on medical imaging. 2011;30:224–30. doi: 10.1109/TMI.2010.2072934. [DOI] [PMC free article] [PubMed] [Google Scholar]
- Trune DR, Nguyen-Huynh A. Seminars in Hearing. Vol. 33. Thieme Medical Publishers; 2012. Vascular pathophysiology in hearing disorders; pp. 242–250. [DOI] [PMC free article] [PubMed] [Google Scholar]
- Wangemann P. Cochlear blood flow regulation. Advances in oto-rhino-laryngology. 2002;59:51–57. doi: 10.1159/000059241. [DOI] [PubMed] [Google Scholar]
- Wangemann P, Cohn ES, Gruber DD, Gratton MA. Ca2+-dependence and nifedipine-sensitivity of vascular tone and contractility in the isolated superfused spiral modiolar artery in vitro. Hearing research. 1998;118(102):90–100. doi: 10.1016/s0378-5955(98)00017-3. [DOI] [PubMed] [Google Scholar]
- Zhang F, Dai M, Neng L, Zhang JH, Zhi Z, Fridberger A, Shi X. Perivascular macrophage-like melanocyte responsiveness to acoustic trauma--a salient feature of strial barrier associated hearing loss. FASEB journal: official publication of the Federation of American Societies for Experimental Biology. 2013:27, 3730–3740. doi: 10.1096/fj.13-232892. [DOI] [PMC free article] [PubMed] [Google Scholar]
- Zhang W, Dai M, Fridberger A, Hassan A, Degagne J, Neng L, Zhang F, He W, Ren T, Trune D, Auer M, Shi X. Perivascular-resident macrophage-like melanocytes in the inner ear are essential for the integrity of the intrastrial fluid-blood barrier. Proceedings of the National Academy of Sciences of the United States of America. 2012;109:10388–93. doi: 10.1073/pnas.1205210109. [DOI] [PMC free article] [PubMed] [Google Scholar]