

Abstract
The objective of this cohort study was to explore relationships between the home food environment (HFE), child / parent characteristics, diet quality and measured weight status among 699 child-parent pairs from King County, WA and San Diego County, CA. HFE variables included parenting style / feeding practices, food rules, frequency of eating out, home food availability, and parent’s perception of food costs. Child dietary intake was measured by 3 day recall and diet quality indicators included fruits and vegetables, sweet/ savory snacks, high calorie beverages, and DASH score. Individual linear regression models were run where child BMI z-score and child diet quality indicators were dependent variables and HFE variables and child/parent characteristics were independent variables of interest. Fruit and vegetable consumption was associated with parental encouragement/modeling (β = 0.68, P<0.001) and unhealthful food availability (-0.27, P<0.05); DASH score with food availability (healthful: 1.3, P<0.01; unhealthful:-2.25, P<0.001), food rules (0.45, P<0.01) and permissive feeding style (-1.04, P<0.05); high calorie beverages with permissive feeding style (0.14, P<0.01) and unhealthful food availability (0.21, P<0.001); and sweet/savory snacks with healthful food availability (0.26, P<0.05; unexpectedly positive). Children’s BMI z-score was positively associated with parent’s use of food restriction (0.21, P<0.001), permissive feeding style (0.16, P<0.05), and concern for healthy food costs (0.10, P<0.01), but negatively with verbal encouragement / modeling (-0.17, P<0.05), and pressure to eat (-0.34, P<0.001). Various HFE factors associated with parenting around eating and food availability are related to child diet quality and weight status. These factors should be considered when designing interventions for improving child health.
Keywords: childhood obesity, home food availability, dietary quality, parenting, food rules
INTRODUCTION
Childhood overweight/obesity is a strong predictor of adult obesity1 and risk factors for chronic diseases.2, 3 A healthful diet during childhood is believed to reduce the risk of child overweight. However, in the US, unhealthful eating practices in youth, such as high intakes of high fat snacks and sugar sweetened beverages and low intakes of fruits and vegetables, are common.4, 5 Although a multitude of factors play a role in child obesity and poor diet quality, current models for root causes point to the home food environment (HFE) as having a key influence.6, 7
Much of a child’s eating behavior occurs in and around the home, so the potential impact of the HFE on a child’s energy intake and overall diet quality is particularly relevant. Several models have been proposed to conceptualize the HFE as it pertains to child obesity.7-9 Overlapping constructs within these models are the basis for our proposed model (Figure 1). These include the physical environment such as food and beverage availability and the sociocultural environment including parenting styles, practices and rules. A range of studies have examined aspects of these constructs providing insight into how the HFE is likely to shape children’s food intake and weight. For example, the availability of unhealthy foods in the home has been associated with lower fruit and vegetable intake in children.8,10 Parent’s use of controlling child-feeding strategies has been positively related to BMI in girls,11 and poor diet quality in boys and girls.12,13 Family mealtime practices, including eating meals as a family and setting household food rules, have been associated with higher dietary quality in youth;10,11 however, the relation of these practices to child BMI has been mixed.14, 15
Figure 1.
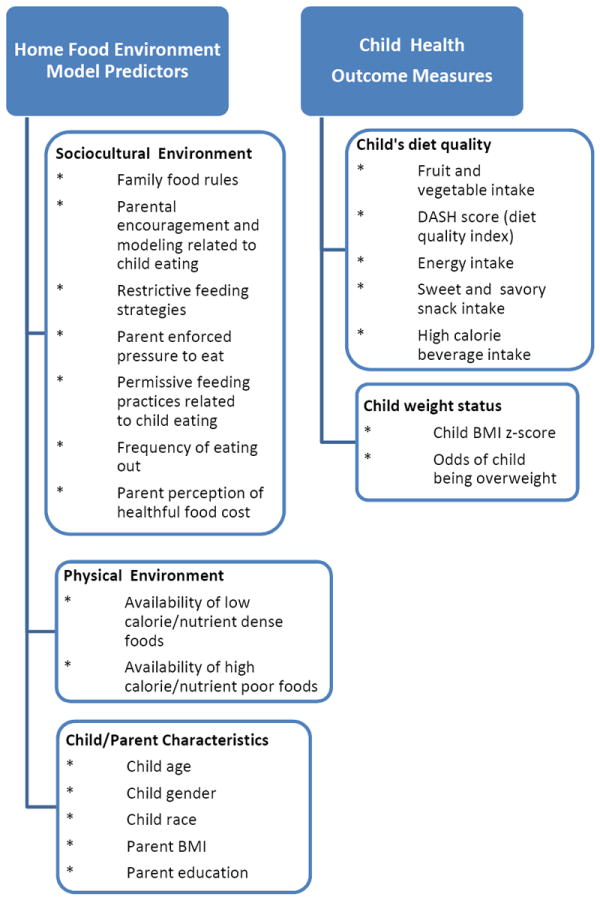
Model of the home food environment predictors of child diet quality and weight status. Neighborhood type was also included in models to account for participant recruitment strategy.
Most previous studies of the HFE and children’s eating behavior and weight status have been limited by small sample size and the small number of HFE factors and potential confounders examined. Although past studies examined aspects of the HFE in relation to diet quality or BMI in childhood, few have examined child HFE, diet and weight status concurrently.10, 11 To design effective intervention programs directed at chronic disease prevention in youth, it would be helpful to identify multiple aspects of the HFE that enhance a healthy weight while optimizing the overall nutrient intake of the child. The aim of the present study was to explore relationships between physical and sociocultural aspects of the HFE on diet quality and weight status in children. Proposed HFE predictors were considered simultaneously with relevant child/parent characteristics like gender, parent education and BMI.
EXPERIMENTAL METHODS
Study design, setting and subjects
Participants were part of the Neighborhood Impact on Kids (NIK) Study, an NIH funded longitudinal, observational cohort study of children aged 6 to 11 and their parents in Seattle/King County, WA and San Diego County, CA. NIK was designed to evaluate the association of neighborhood and home environmental factors with children’s and parent’s weight status and weight-related behaviors.16 Children who lived in neighborhoods that varied in their physical activity environment (PA) (e.g., walkability and availability of parks), and nutrition environment (NE) (e.g., availability of healthy food choices) were studied. Neighborhood PA and NE characteristics were assessed by observation, existing land use and other spatial data available in a Geographic Information System.17 Block groups were assigned a low or high PA score and low or high NE score. Recruitment was guided by achieving about equal representation of participants from each of 4 neighborhood types: high PA /high NE, high PA/low NE, low PA/high NE, low PA/low NE. This study was approved by the Institutional Review Boards at Seattle Children’s Hospital and San Diego State University. Parents provided written informed consent and children provided assent prior to study participation.
Participant recruitment occurred from September 2007 to January 2009. A total of 8616 households were contacted, 4975 were screened for interest/ eligibility, 944 agreed to participate, and 756 consented and had a measurement visit. Twenty-six families were later found to have inappropriate neighborhood type designation due to missing park and restaurant information and were excluded. Among the remaining 730 families, 699 child-parent pairs had available anthropometric and HFE data. These 699 pairs were the basis of this analysis. Only one child and parent were enrolled per household. Additional details regarding recruitment and inclusion/exclusion criteria have been published.16
Measures
All measures for these analyses were obtained during the initial measurement period. This included an assessment visit in the family’s home or at Seattle Children’s Hospital (determined by parental preference) to collect child and parent anthropometric data. A survey of demographic and HFE factors was completed by the participating parent over the next week and child diet recalls were completed within 3 weeks after the assessment visit. All data were collected by trained research personnel.
Survey
The survey was designed with detailed instructions for a parent to complete online or in writing. Copies of the NIK time 1 survey used in this investigation can be found at: http://www.seattlechildrens.org/research/child-health-behavior-and-development/saelens-lab/measures-and-protocols/. The survey included questions on demographics and the HFE. Demographics related to individual – level characteristics including child and parent age, gender, race, ethnicity and parent’s work hours outside the home (<15, 15-35, >35 hours/week). Household-level characteristics were also determined including highest level of adult education achieved in the household (categorized as ≤high school, some or completed college, and completed graduate degree) and household income (<50k, 50k-100k, and >100k). HFE measures were derived from published scales and related to parenting style/feeding practices and home food availability. Specifically, an “Encouragement/Modeling” scale (7 items; Cronbach’s α = 0.77) modified from the Pro Children Project18 consisted of items about parent’s use of modeling positive eating behaviors and encouragement to eat fruits and vegetables. A “Pressure to Eat” scale (4 items; Cronbach’s α = 0.76) and a “Restrictive Food Practices” scale (2 items; Cronbach’s α = 0.78) from the Child Feeding Questionnaire developed by Birch et al.19 included items about feeding strategies to get a child to eat and use of food restriction to control a child’s food intake. A “Permissive Food Practices” scale (3 items; Cronbach’s α = 0.55) from the Family Eating and Activity Habits Questionnaire20 included items about eating without limits and a “Household Food Rules” scale (12 items; Cronbach’s α = 0.60) from the Active Where Parent-Child Survey (available at: http://sallis.ucsd.edu) included items about rules enforced in the home related to child eating. Two additional scales from the Active Where Parent-Child Survey assessed home food availability related to high calorie /nutrient poor foods (8 items including chocolate candy, other candy, cakes/brownies/muffins/cookies, regular chips/crackers, sweetened breakfast cereals, juice drinks, regular sodas and sports drinks; Cronbach’s α = 0.76) and lower calorie/more nutrient dense foods (4 items including raw fruits, baked chips/ low fat crackers/pretzels, raw vegetables, and unsweetened cereals; Cronbach’s α = 0.52). A “Frequency of Dinners Out” item from the Youth and Adolescent Food Frequency Questionnaire21 assessed how often the child ate dinner away from home. A scale on food costs (2 items; Cronbach’s α = 0.64) asked parents about their perception of costs of fruits and vegetables in neighborhood stores.22 All items except food rules were scored using a five point Likert scale ranging from 1 (low) to 5 (high). Items within a scale were summed and averaged. The average was then used as the scale score. Food rules were scored as 1 (yes) and 0 (no) response and the “Household Food Rules” score was a sum of these responses. All HFE scales had been previously tested for internal consistency and test-retest reliability. Cronbach’s α for the scales within this sample were consistent with published values. HFE scales within this sample also had good individual predictive ability as demonstrated by significant independent associations with fruit and vegetable intake and/or child BMI z-score (Online Supplemental Table A).
Dietary Intake
Participants were called on up to 3 random days (98% had 3 recall days; 68% had 1 weekend day and 2 weekends; others had 3 weekdays) and asked to recall their food intake in the previous 24 hours using the multiple-pass method.23 Prior to the recalls during measurement visits, children and their parents were trained in the use of a 2-dimensional food models to assist with estimation of portion sizes of foods eaten (Nutrition Consulting Enterprises; Framingham, MA). Telephone interviews were conducted using the consensus recall approach (where parents and their child reported as a group) for children younger than 8 years of age.24 Children at or over the age of 8 years were interviewed for dietary recall information with parental assistance.25-27
Food recalls were averaged over the 3 days and analyzed for calorie intake, nutrient content and number of servings from food groups using the Minnesota Nutrient Data Systems for Research (NDSR) software, version 2.92 (2010). Given the association between energy density and nutrient quality, 28 two additional food groupings were created that reflected foods of high energy density: high calorie, non-dairy beverages excluding 100% juice and sweet and savory snacks. A third additional food grouping was created of low energy dense foods including all forms of fruits and vegetables except savory snacks and fried types. Definitions of food groups, serving sizes and representative foods within groups are shown in Table 1.
Table 1.
Description of food groups used as dependent variables in regression models to assess the relationship between the home food environment, diet quality and weight status of children 6 to 11 years of age a
| Food Group | Definitions | Representative Food Types |
|---|---|---|
| Fruits and vegetables b | Whole fruit and 100% fruit juice, whole vegetables and 100% vegetable juice; fruits and vegetables in salads, soups, stews, stir-fry and similar mixed dishes; excludes fried fruits and vegetables | Citrus or other fruit juice, vegetable juice, apples, oranges, bananas, berries, avocado, broccoli, collards, romaine, carrots, winter squash, sweet potatoes, salsa, tomato sauce, tomato puree and paste, white potatoes, corn, lima beans, peas, beans, lentils, beets, cabbage summer squash |
| Sweets and savory snacks c | High energy, low nutrient dense solid snack-type foods | Apple and banana chips, potato/corn/rice chips, crackers, cheese puffs, cakes, cookies, pies, pastries, doughnuts, snack bars, popcorn, fried pork rinds, candy, frosting, fudge, caramel, honey, jam, sugar, energy bars, granola bars |
| High calorie beverages (non-dairy excluding 100 % fruit juice) c | High energy drinks were those that contained caloric sweeteners. High calorie beverage inclusion criteria was based on the CDC definition54 except sweetened milks or milk alternatives were not included because of presence of protein and other nutrients | Flavored carbonated or non-carbonated soft drinks (soda), fruit drinks, punches or ades, sports drinks, tea and coffee drinks (caloric sweeteners are added), and energy drinks. |
Data are from the Neighborhood Impact on Kids (NIK) study, an NIH longitudinal observational cohort study of children and their parents in Seattle/King County, WA and San Diego, CA.16
Serving sizes were calculated based on those recommended in the Dietary Approaches to Stop Hypertension (DASH) dietary pattern.31
Serving sizes were calculated based on USDA standards. 53
A DASH score was calculated according to Guenther et al. 29 from mean daily food group servings of 8 food groups - grains, vegetables, fruits, dairy, meat/poultry/fish/eggs, nuts/seeds/legumes, fats/oils, and sweets. Goals of intake for each food group were based on recommendations specified by the Dietary Guidelines for Americans,30 the DASH Collaborative Research Group,31 and on calorie levels specific for age, gender, and sedentary activity level.32 A maximum score of 10 was achieved within each food group when a child’s intake met the food group recommendation, whereas lower intakes were scored proportionately. If lower intakes were favored by the dietary recommendation, reverse scoring was applied. An overall DASH score was calculated, which ranged between 0 and 80, with a higher score indicating a higher diet quality.
Anthropometrics
Parent/child weight and height were measured 3 or more times until 3 of 4 consecutive readings were within 0.1 kg for weight and 0.5 cm for height. Readings were averaged. Weights were obtained with a digital scale (Detecto DR400C) and heights with a stadiometer (SECA 214). BMI was calculated as weight/height2 (kg/m2), with BMI percentiles, BMI z-scores and weight status cut-points defined as per the Centers for Disease Control and Prevention (CDC) criteria.33
Statistical Analyses
Data were analyzed using Stata version 12.1 (StataCorp. 2011. Stata Statistical Software: Release 12. College Station, TX: StataCorp LP.) Bivariate associations among HFE scales were assessed using Pearson correlations. Five individual linear regression models were run where child BMI z-score, fruit and vegetable intake, DASH score, sweet and savory snack servings and high calorie beverage servings were dependent variables and social cultural variables (parenting style/feeding practices, food rules, frequency of eating out, and parent’s perception of food costs), physical environment (healthful and unhealthful home food availability) and child/parent characteristics (child age, gender, race, ethnicity, parent’s BMI, highest household education level and child BMI z-score in models for diet quality indicators only) were independent variables of interest. A multiple logistic regression model was conducted similarly for odds of child overweight (BMI ≥85th percentile for age and gender) as the dependent variable. Neighborhood type was included in all models to account for the study recruitment/sampling design. Notably, as a measure of socioeconomic status, highest household education was included in models rather than income to avoid collinearity (these variables were highly correlated). P values <0.05 were considered significant.
RESULTS AND DISCUSSION
Participant characteristics
Children and parents were predominantly non-Hispanic white; the prevalence of overweight/ obesity was 26.6% in children and 41.9 % in parents (Table 2). On average, children consumed considerably less than the 6-9 servings of fruits and vegetables recommended for their age group; mean energy intake fell within age-appropriate ranges.31 The average DASH score for children was 58% of the maximum achievable score of 80.30 Annual household income was >$50K for 85% of the sample. Parent participants were predominately female (86%), had a minimum of some college education (93%), and 47.5% worked less than 15 hours per week outside the home.
Table 2.
Characteristics of children a, b and their parents a, c used in regression models to assess the relationship between the home food environment, diet quality and weight status of children 6 to 11 years of age
| Characteristic | Definition | n | % | Mean (SD) |
|---|---|---|---|---|
|
| ||||
| Children (n=699) | ||||
|
| ||||
| Age (years) | 9.1 (1.5) | |||
| 6-8 | 349 | 49.9 | ||
| 9-11 | 350 | 50.1 | ||
|
| ||||
| Gender | Male | 351 | 50.2 | |
| Female | 348 | 49.8 | ||
|
| ||||
| Race | White | 568 | 81.2 | |
| Non-White | 131 | 18.7 | ||
|
| ||||
| Ethnicity | Hispanic | 119 | 17.1 | |
| Non-Hispanic | 577 | 82.9 | ||
|
| ||||
| BMI z-score | 0.43 (0.98) | |||
| <85th percentile | 513 | 73.4 | ||
| 85th to <95th percentile | 106 | 15.2 | ||
| ≥95th percentile | 80 | 11.4 | ||
|
| ||||
| Dietary intake | Energy, kcal/day | 1752 (414) | ||
| Fruit and vegetables, servings/day d | 3.4 (2.0) | |||
| Sweet and savory snacks, servings/day e | 2.3 (1.5) | |||
| High calorie beverages, servings/day f | 0.6 (0.7) | |||
| DASH score g | 41.5 (7.1) | |||
|
| ||||
| Parents (n=699) | ||||
|
| ||||
| Age, years | 41.4 (5.9) | |||
|
| ||||
| Gender | Male | 96 | 13.9 | |
| Female | 596 | 86.1 | ||
|
| ||||
| Race | White | 605 | 88.9 | |
| Non-White | 76 | 11.1 | ||
|
| ||||
| Ethnicity | Hispanic | 95 | 13.8 | |
| Non-Hispanic | 595 | 86.2 | ||
|
| ||||
| Parent work hours outside the home/week | <15 hours | 329 | 47.5 | |
| 15-35 | 155 | 22.4 | ||
| >35 | 208 | 30.1 | ||
|
| ||||
| Highest level of adult education in the household | No college | 46 | 6.7 | |
| Some or College graduate | 392 | 56.9 | ||
| Graduate school | 251 | 36.4 | ||
|
| ||||
| Household Income h | <50k | 97 | 14.2 | |
| 50k-100k | 252 | 37.0 | ||
| >100k | 332 | 48.8 | ||
|
| ||||
| BMI, kg/m2 | 27.0 (5.8) | |||
| Normal (BMI < 25) | 404 | 58.1 | ||
| Overweight (≥25 BMI < 30) | 120 | 17.2 | ||
| Obese ≥ 30 | 172 | 24.7 | ||
Data are from the Neighborhood Impact on Kids (NIK) study, an NIH longitudinal observational cohort study of children and their parents in Seattle/King County, WA and San Diego, CA.16
Child demographics were collected by study staff at the study assessment visit.
Parent demographics were collected by survey; parent and child weight and height were measured at the study assessment visit (at family’s home or in the hospital depending on parent preference).
Fruit and vegetables included whole and 100% juice in salads, soups, stews, stir-fry and similar mixed dishes and excluded fried fruits and vegetables; serving sizes were calculated according to the DASH 31 dietary pattern.
Sweet and savory snacks included high energy, low nutrient dense solid snack-type foods. USDA 53 serving sizes were used to assess portion sizes consumed.
High calorie beverages were those that contained caloric sweeteners. High calorie beverage inclusion criteria were based on the CDC definition54 except sweetened milks or milk alternatives were not included because of presence of protein and other nutrients. USDA 53 serving sizes were used to assess portion sizes consumed.
DASH score was calculated according to Guenther et al.; 29 possible score ranged from 0 to 80 with higher score = higher diet quality.
As a measure of socioeconomic status, highest household education was included in regression models rather than household income to avoid collinearity (these variables were highly correlated).
Mean HFE scores (Table 3) showed a high use of encouragement/modeling and restrictive feeding practices in this sample and a high availability of low calorie/nutrient dense foods in the home. Other parenting and food availability measures were near the middle of the possible score range. On average, families reportedly ate dinners out 1-2 times per week (this based on a Likert scale score where a mean of 2 = 1-2 per week). Most HFE scales were only modestly inter-correlated (r ≤ 0.3). Exceptions included the scale for family food rules, which was moderately correlated with encouragement/modeling (r=0.45) and permissive practices related to child eating (r=-0.39). Also, the unhealthy food availability scale was moderately correlated with permissive practices related to child eating (r=0.36).
Table 3.
Means (SD), range and Pearson correlation between home food environment scales used as independent variables in regression models to assess the relationship between the home food environment, diet quality and weight status of children 6 to 11 years of age a
| Home Food Environment Scales | Factor Mean (SD) | Factor Range b | 1 | 2 | 3 | 4 | 5 | 6 | 7 | 8 |
|---|---|---|---|---|---|---|---|---|---|---|
| Sociocultural Environment | ||||||||||
| 1. Encouragement and modeling related to child eating c | 4.2 (0.5) | 1 to 5 | ||||||||
| 2. Restrictive food practices d | 3.7 (1.1) | 1 to 5 | 0.10 | |||||||
| 3. Pressure to eat e | 2.2 (0.9) | 1 to 5 | -0.02 | 0.09 | ||||||
| 4. Permissive practices related to child eating f | 2.1 (0.6) | 1 to 5 | -0.21 **** | 0.02 | 0.14 ** | |||||
| 5. Family rules related to child eating g | 5.4 (2.0) | 0 to 12 | 0.45 **** | 0.23 **** | 0.12 | -0.39 **** | ||||
| 6. Frequency of dinners out per week h | 2.2 (0.9) | 1 to 5 | -0.10 | -0.05 | -0.01 | 0.12 | -0.09 | |||
| 7. Parent concern of healthy food costs i | 2.6 (1.1) | 1 to 5 | -0.09 | -0.01 | 0.12 | 0.12 | -0.01 | -0.09 | ||
| Physical Environment | ||||||||||
| 8. Availability of low calorie/ nutrient dense foods j | 4.2 (0.5) | 1 to 5 | 0.29 **** | 0.02 | -0.14 * | -0.18 **** | 0.15 ** | -0.08 | -0.19 ** | |
| 9. Availability of high calorie/ nutrient poor foods k | 2.7 (0.7) | 1 to 5 | -0.27 **** | -0.12 | 0.14 ** | 0.36 **** | -0.35 **** | 0.17 *** | 0.10 | -0.01 |
Data are from the Neighborhood Impact on Kids (NIK) study, an NIH longitudinal observational cohort study of children and their parents in Seattle/King County, WA and San Diego, CA.16
All items except food rules were scored using a Likert scale ranging from 1 (low/disagree/never) to 5 (high/agree/always); Food rules were scored as 1 (yes) and 0 (no) response; Items within a scale were summed and averaged. The average was then used as the scale score. Frequency of dinners out per week were scored as 1= never; 2= 1-2 times per week, 3 = 2-3 times per week, 4 = 4-5 times per week; 5 = >5 times per week; Bonferroni adjusted significance levels are reported.
includes 7 items modified from the Pro Children Project18 that relate to parent’s use of modeling positive eating behaviors and encouragement to eat fruits and vegetables.
includes 2 items from the Child Feeding Questionnaire 19 about parent’s use of food restriction to control a child’s food intake.
includes 4 items from the Child Feeding Questionnaire 19 about feeding strategies to get a child to eat more.
includes 3 items from the Family Eating and Activity Habits Questionnaire 20 about eating without limits.
includes 12 items from the Active Where Parent-Child Survey (available at: http://sallis.ucsd.edu) about rules enforced in the home related to child eating.
includes 1 item from the Youth and Adolescent Food Frequency Questionnaire21 to assessed how often the child ate dinner away from home.
includes 2 items to assess parent’s perception of costs of fruits and vegetables in neighborhood stores.22
includes 4 items to assess home availability of low calorie/ nutrient dense foods (includes raw fruits, baked chips/ low fat crackers/pretzels, raw vegetables, and unsweetened cereals).
includes 8 items to assess home availability of high calorie /nutrient poor foods (includes chocolate candy, other candy, cakes/brownies/muffins/cookies, regular chips/crackers, sweetened breakfast cereals, juice drinks, regular sodas and sports drinks).
P<0.05.
P<0.01.
P<0.001.
P<0.0001.
Associations between HFE scales, child diet quality and weight status
In multivariate models (Table 4) child diet quality indicators tended to be more consistently associated with home food availability scales than parenting around eating. As evidence, home availability of unhealthful foods was positively associated with high calorie beverage intake and inversely with fruits and vegetable intake and DASH score. Availability of healthful foods was positively associated with DASH score and unexpectedly with sweet and savory snacking. Parenting practices that were favorably associated with high diet quality indicators included encouragement / modeling of healthy eating and family rules around child eating. Permissive parenting style was inversely related to DASH score. Several child/parent characteristics were associated with child diet quality. DASH score was inversely associated with parent BMI and parent education (college compared to high school). Sweet and savory snacking was positively associated with child race (white compared to non-white) and parent education (college or more compared to high school) and negatively with child ethnicity (Hispanic compared to non-Hispanic). Also, high calorie beverage intake was positively associated with child age and negatively with child gender (female compared to male). Multivariate models predicting child energy intake were also run and showed no significant associations with HFE scales or child/parent characteristics (data not shown).
Table 4.
Estimated associations between home food environment, child/parent characteristics, dietary quality and weight status of children 6 to 11 years of age a, b
| Child Diet Quality Indices | Child Weight Status Indices | |||||
|---|---|---|---|---|---|---|
|
| ||||||
| Home Food Environment Scales | Fruit and vegetable intake c | DASH score d | Sweet and Savory Snacks e | High Calorie Beverages f | Child BMI z-score g | Child Overweight g |
|
| ||||||
| Estimate (95% CI) h | Estimate (95% CI) h | Estimate (95% CI) h | Estimate (95% CI) h | Estimate (95% CI) h | Odds Ratio (95% CI) h | |
|
| ||||||
|
Sociocultural Environment Scales
| ||||||
| Encouragement and modeling related to child eating | 0.68 (0.34, 1.02) *** | 1.13 (-0.03, 2.30) | -0.11 (-0.38, 0.17) | -0.01 -0.12, 0.11) | -0.17 (-0.32, 0.02) * | 0.65 (0.42, 1.03) |
|
| ||||||
| Restrictive food practices | -0.04 (-0.19, 0.11) | -0.17 (-0.67, 0.33) | -0.04 (-0.15, 0.08) | 0.04 (-0.01, 0.09) | 0.21 (0.14, 0.27) *** | 1.83 (1.47, 2.28) *** |
|
| ||||||
| Pressure to eat more | -0.16 (-0.33, 0.02) | -0.19 (-0.79, 0.41) | -0.13 (-0.27, 0.01) | 0.02 (-0.04, 0.08) | -0.34 (-0.42, -0.27) *** | 0.46 (0.36, 0.60) *** |
|
| ||||||
| Permissive practices related to child eating | 0.05 (-0.23, 0.33) | -1.04 (-2.00, -0.08) * | 0.20 (-0.02, 0.42) | 0.14 (0.05, 0.24) ** | 0.16 (0.04, 0.29) * | 1.68 (1.16, 2.42) ** |
|
| ||||||
| Family rules related to child’s eating | 0.05 (-0.04, 0.14) | 0.45 (0.14, 0.77) ** | -0.03 (-0.10, 0.04) | -0.03 (-0.06, 0.003) | 0.04 (-0.002, 0.08) | 1.06 (0.94, 1.19) |
|
| ||||||
| Frequency of dinners out /week | -0.08 (-0.24, 0.08) | -0.03 (-0.57, 0.51) | 0.02 (-0.11, 0.15) | 0.02 (-0.03, 0.08) | 0.07 (-0.003, 0.14) | 1.20 (0.98, 1.48) |
|
| ||||||
| Parent concern of healthy food costs | -0.02 (-0.17, 0.13) | -0.19 (-0.68, 0.31) | 0.001 (-0.11, 0.12) | -0.02 (-0.07, 0.03) | 0.10 (0.03, 0.16) ** | 1.18 (0.97, 1.43) |
|
| ||||||
|
Physical Environment Scales
| ||||||
| Availability of low calorie/ nutrient dense foods | 0.13 (-0.16, 0.42) | 1.30 (0.31, 2.28) ** | 0.26 (0.03, 0.49) * | -0.02 (-0.12, 0.07) | -0.02 (-0.05, 0.11) | 0.98 (0.66, 1.46) |
|
| ||||||
| Availability of high calorie/ nutrient poor foods | -0.27 (-0.52, -0.03) * | -2.25 (-3.08, -1.41) *** | -0.002 (-0.20, 0.19) | 0.21 (0.13, 0.29) *** | -0.01 (-0.12, 0.10) | 0.81 (0.58, 1.13) |
|
| ||||||
|
Child/Parent Characteristics
i, j
| ||||||
| Child age | 0.09 (-0.01, 0.18) | -0.12 -0.44, 0.21) | -0.02 (-0.10, 0.06) | 0.03 (0.0005, 0.06) * | 0.04 (-0.08, 0.005) | 1.06 (0.93, 1.20) |
|
| ||||||
| Child race | ||||||
| Non-white (reference) | ||||||
| White | 0.14 (-0.23, 0.51) | 0.87 (-0.38, 2.13) | 0.44 (0.15, 0.73) ** | 0.01 (-0.11, 0.14) | 0.03 (-0.14, 0.19) | 0.96 (0.59, 1.58) |
|
| ||||||
| Child ethnicity | ||||||
| Non-Hispanic (reference) | ||||||
| Hispanic | 0.13 (-0.28, 0.54) | 0.37 (-1.04, 1.78) | -0.40 (-0.73, -0.08) * | 0.10 (-0.04, 0.24) | .06 (-0.13, 0.24) | 1.22 (0.71, 2.08) |
|
| ||||||
| Child gender | ||||||
| Male (reference) | ||||||
| Female | -0.16 (-0.46, 0.13) | -0.79 (-0.21, 1.80) | 22 (-0.45, 0.02) | -0.20 (-0.30, -0.10) *** | -0.20 (-0.33, -0.07) ** | 0.61 (0.41, 0.91) * |
|
| ||||||
| Child Weight status | ||||||
| Normal weight (reference) | ||||||
| Overweight | 0.10 (-0.32, 0.52) | 0.69 (-0.74, 2.12) | -0.10 (-0.43, 0.23) | -0.05 (-0.19, 0.09) | ||
| Obese | 0.26 (-0.25, 0.76) | 0.40 (-1.32, 2.12) | -0.07 (-0.47, 0.33) | -0.07 (-0.24, 0.10) | ||
|
| ||||||
| Parent BMI | -0.02 (-0.04, 0.009) | -0.11 (-0.20, -0.02) * | -0.006 (-0.03, 0.02) | 0.01 (-0.001, 0.02) | 0.05 (0.04, 0.06) *** | 1.10 (1.07, 1.14) *** |
|
| ||||||
| Parent education | ||||||
| ≤High School (reference) | ||||||
| College | -0.26 (-0.89, 0.37) | -2.19 (-4.34, -0.04) * | 0.56 (0.08, 1.08) * | 0.08 (-0.13, 0.29) | -0.12 (-0.40, 0.16) | 0.73 (0.32, 1.65) |
| Graduate School | 0.04 (-0.63, 0.71) | -1.20 (-3.48, 1.09) | 0.83 (0.30, 1.36) ** | 0.04 (-0.19, 0.26) | -0.14 (-0.43, 0.16) | 0.82 (0.35, 1.96) |
|
| ||||||
| Model R2 | .10 | .21 | .09 | .16 | .28 | |
Data are from the Neighborhood Impact on Kids (NIK) study, an NIH longitudinal observational cohort study of children and their parents in Seattle/King County, WA and San Diego, CA.16
N=699 child-parent pairs: participating parent was asked to report on home food environment scales for child in the study.
Fruit and vegetables included whole and 100% fruit juice, in salads, soups, stews, stir-fry and similar mixed dishes and excluded fried fruits and vegetables; serving sizes were calculated according to the DASH 31 dietary pattern.
DASH score was calculated according to Guenther et al.; 29 possible score ranged from 0 to 80 with higher score = higher diet quality.
Sweet and savory snacks included high energy, low nutrient dense solid snack-type foods. USDA 53 serving sizes were used to assess portion sizes consumed.
High calorie beverages were those that contained caloric sweeteners. High calorie beverage inclusion criteria were based on the CDC definition54 except sweetened milks or milk alternatives were not included because of presence of protein and other nutrients. USDA 53 serving sizes were used to assess portion sizes consumed.
BMI was calculated as weight/height2 (kg/m2), with BMI z-scores and weight status cut-points defined as per the Centers for Disease Control and Prevention (CDC) criteria.33
All models were adjusted for neighborhood type to account for study participant recruitment strategy. Neighborhood type was based on physical activity (PA) environment and nutrition environment (NE) as assessed by observation and existing land use and other spatial data. Neighborhoods were assigned a low or high PA environment score based on walk index and park proximity and low or high NE score based on supermarket and fast food access. Four neighborhood types were possible = high PA /high NE, high PA/low NE, low PA/high NE or low PA/low NE. There was no significant association between neighborhood type and child health outcome (diet quality indicators, weight status indicators).
Child demographics were collected by study staff at the assessment visit.
Parent demographics were collected by survey; parent and child weight and height were measured at the assessment visit (at family’s home or in the hospital depending on parent preference).
P<0.05.
P<0.01.
P<0.001.
Child weight status was associated with several aspects of parenting around child eating. Child BMI z-score was negatively associated with parent’s use of encouragement/modeling and parental pressure to eat and positively associated with parent’s use of food restriction, permissive feeding practices, and parent’s concern over healthy food costs. Similarly, odds of a child being overweight were lower with increased parental pressure to eat and higher with parental use of permissive feeding practices and use of food restriction. Child-parent characteristics associated with child weight status included child gender and parent BMI. Specifically, child BMI z-score was negatively associated with child gender (female compared to male) and positively associated parent BMI; Odds of a child being overweight were lower with being female compared to male and higher with greater parent BMI.
Interpretation
A major finding from the present analyses was that the combination of sociocultural and physical HFE variables assessed explained 28% of the variance in child BMI and 9% to 21% of the variance in various measures of child dietary quality. These are substantial associations and suggest that changing the HFE has the potential to be a strong intervention approach. Another finding was that sociocultural characteristics of the home environment that included parenting around child eating and permissive parenting style were more consistently related to child weight than physical resources including the healthfulness of available food in the home; results suggest potentially effective and ineffective parenting practices. Conversely, the healthfulness of home food availability was more consistently related to child diet quality than parenting was related to child eating; this suggests that a healthy HFE is an important means of optimizing the overall nutritional quality of children’s diets.
The present study has several strengths including the consideration of multiple aspects of the HFE simultaneously on both child weight and diet quality. Also, ~ 700 children and their caregivers from two metropolitan areas were studied allowing for important differences in associations between the HFE and child diet intake and weight to be identified. To our knowledge this is the first study to show a favorable association between parental encouragement/modeling and child weight status and fruit and vegetable intake after accounting for other parenting practices around child eating, home food availability, and important child/parent characteristics such as parent BMI. While several cross-sectional studies have shown positive associations between parental modeling and children’s fruit and vegetable consumption, 34-36 our results suggest this practice may have benefits regarding children’s weight. Permissive versus authoritarian parenting around eating was found to be problematic for both child weight and diet quality as reflected by associations with lower DASH score and higher caloric beverage consumption. These findings are consistent with cross-sectional data showing that indulgent parents had children with higher BMI z-scores 37, 38 and lower dairy and vegetable intakes.39 Findings from this study also showed that parental enforcement of “allow/limit” rules on snacking type, place, and size were associated with higher DASH score, consistent with the findings of others.40 Perceived use of restrictive parenting practices around child eating was associated with higher child BMI z-score but not diet quality indicators, consistent with some research41-43 but not others.44-46 Although parental pressure directed at child eating has been reported to be a counterproductive feeding approach, 34, 47, 48 our data suggest otherwise. It is possible that parents apply pressure during feeding because the child is underweight, eating too slowly, or displaying eating behaviors that are perceived as problematic.49 Longitudinal data support this interpretation. 35, 50, 51
Not surprisingly, a greater availability of healthful foods in the home was associated with a higher child DASH score. Several studies have related home availability of healthful foods to consumption in children, and the present findings were in line with existing research.8, 49 The inverse association observed between high fruit and vegetable intake and DASH score and availability of unhealthful foods suggest that limiting these foods may be advantageous toward improving children’s diet quality. An unexpected finding was the positive association between the availability of low calorie/nutrient dense foods in the home and the child’s intake of sweet and savory snacks. This finding may be related in part to how sweet and savory snacks were categorized in this study or reflect the state of some HFE, i.e., some homes may be healthful in some ways but not others.
Limitations of the present study include the cross-sectional nature of the design, which can identify associations, but cannot determine the direction of the association. Bi-directionality in parent-child interactions is likely as parenting influences child eating and weight, but child eating and weight also influence parenting. Only longitudinal and experimental studies can provide evidence of the temporal nature of these associations. Although it is likely that aspects of the HFE exert influence on a child’s weight via their dietary intake, these relationships were not directly examined in the present study. All survey and dietary data for children younger than 8 years of age were collected from the parent’s self-report, which may have introduced self-report bias.52 Also, the parents surveyed in this study were highly educated (most with some college or were college graduates), which limits the generalizability of these findings.
CONCLUSIONS
The HFE plays an important role in shaping dietary intake and weight status in children. In particular, the parenting practices of encouragement/modeling of healthy eating, setting “allow/limit” home food rules, and having healthful foods available in the home were favorably associated with child dietary quality and/or weight status. In contrast, permissive parenting practices around child eating and restrictive feeding practices were adversely related to child dietary intake and/or weight status. These findings suggest that parental encouragement and modeling of healthy eating, that is not overly restrictive, but in the context of a healthy home food environment is important in order to maximize the likelihood of healthy child weight status and eating. More longitudinal and experimental research is needed to clarify the precise role of the HFE in children’s intake and weight trajectories.
Supplementary Material
Acknowledgments
Funding Disclosure: This work was supported by NIH / NIEHS (R01 ES014240) and USDA Grant 2006-04623
Footnotes
Author Contribution: All authors contributed substantially to this work.
Publisher's Disclaimer: This is a PDF file of an unedited manuscript that has been accepted for publication. As a service to our customers we are providing this early version of the manuscript. The manuscript will undergo copyediting, typesetting, and review of the resulting proof before it is published in its final citable form. Please note that during the production process errors may be discovered which could affect the content, and all legal disclaimers that apply to the journal pertain.
Contributor Information
Sarah C. Couch, Professor, Department of Nutritional Sciences, University of Cincinnati Medical Center, Cincinnati OH, 45267-0394, Telephone: 513-558-7504, Fax: 513-558-7500, Sarah.Couch@uc.edu.
Karen Glanz, George A. Weiss Professor; Professor of Epidemiology, Department of Biostatistics and Epidemiology, University of Pennsylvania Perelman School of Medicine and Nursing, Philadelphia PA 19104, Telephone: 215-898-0613, Fax: 215-573-5315, kglanz@upenn.edu.
Chuan Zhou, Research Associate Professor, Seattle Children’s Research Institute, Department of Pediatrics, University of Washington, Seattle, WA 98145, Telephone: 206-884-1028, chuan.zhou@seattlechildrens.org.
James F Sallis, Distinguished Professor of Family and Preventive Medicine, Chief Division of Behavioral Medicine, University of California, San Diego CA 92103, Telephone: 619-260-5535; Fax 619-260-1510, jsallis@ucsd.edu.
Brian E Saelens, Professor of Pediatrics, Psychiatry and Behavioral Sciences, Seattle Children’s Research Institute, Department of Pediatrics, University of Washington, Seattle, WA 98145, telephone: 206-884-7800, brian.saelens@seattlechildrens.org.
References
- 1.Brisbios TD, Farmer AP, McGarga LJ. Early markers of adult obesity: A review. Obes Rev. 2012;13(4):347–367. doi: 10.1111/j.1467-789X.2011.00965.x. [DOI] [PMC free article] [PubMed] [Google Scholar]
- 2.Freedman DS, Mei Z, Srinivasan SR, Berenson GS, Dietz WH. Cardiovascular risk factors and excess adiposity among overweight children and adolescents: the Bogalusa Heart Study. J Pediatr. 2007;150(1):12–17. doi: 10.1016/j.jpeds.2006.08.042. [DOI] [PubMed] [Google Scholar]
- 3.Biro FM, Wien M. Childhood obesity and adult morbidities. Am J Clin Nutr. 2010;91(suppl):1499S–1505S. doi: 10.3945/ajcn.2010.28701B. [DOI] [PMC free article] [PubMed] [Google Scholar]
- 4.Slining M, Popkin B. Trends in intakes and sources of solid fats and added sugars among US children and adolescents 1994-2010. Pediatr Obes. 2013;8(4):307–324. doi: 10.1111/j.2047-6310.2013.00156.x. [DOI] [PMC free article] [PubMed] [Google Scholar]
- 5.Guenther P, Dodd K, Reedy J, Krebs-Smith S. Most Americans eat much less than recommended amounts of fruits and vegetables. J Am Diet Assoc. 2006;106:1371–1379. doi: 10.1016/j.jada.2006.06.002. [DOI] [PubMed] [Google Scholar]
- 6.Patrick H, Nicklas TA. A review of family and social determinants of children’s eating patterns and diet quality. J Am Coll Nutr. 2005;24:83–92. doi: 10.1080/07315724.2005.10719448. [DOI] [PubMed] [Google Scholar]
- 7.Rosenkranz RR, Dzewaltowski DA. Model of the home food environment pertaining to childhood obesity. Nutr Rev. 2008;66(3):123–140. doi: 10.1111/j.1753-4887.2008.00017.x. [DOI] [PubMed] [Google Scholar]
- 8.Campbell KJ, Crawford DA, Salmon J, Carver A, Garnett SP, Baur LA. Associations between the home food environment and obesity promoting eating behaviors in adolescence. Obesity. 2007;15:719–730. doi: 10.1038/oby.2007.553. [DOI] [PubMed] [Google Scholar]
- 9.Birch LL, Davidson KK. Family environmental factors influencing the developing behavioral controls of food intake and childhood overweight. Pediatr Clin N Am. 2001;48:893–907. doi: 10.1016/s0031-3955(05)70347-3. [DOI] [PubMed] [Google Scholar]
- 10.Pearson N, Biddle SJ, Gorely T. Family correlates of fruit and vegetable consumption in children and adolescents: a systematic review. Public Health Nutr. 2008;12(2):267–283. doi: 10.1017/S1368980008002589. [DOI] [PubMed] [Google Scholar]
- 11.Birch LL, Fisher JO, Davison KK. Learning to overeat. Maternal use of restrictive feeding practices promotes girls eating in the absence of hunger. Am J Clin Nutr. 2003;78(20):215–220. doi: 10.1093/ajcn/78.2.215. [DOI] [PMC free article] [PubMed] [Google Scholar]
- 12.Fisher JO, Mitchell DC, Smicklas-Wright H, Birch LL. Parental influences on young girls fruit and vegetable, micronutrient and fat intakes. J Am Diet Assoc. 2002;102:58–64. doi: 10.1016/s0002-8223(02)90017-9. [DOI] [PMC free article] [PubMed] [Google Scholar]
- 13.Wardle J, Carnell S, Cooke L. Parental control over feeding and children’s fruit and vegetable intake: how are they related? J Am Diet Assoc. 2005;105:227–232. doi: 10.1016/j.jada.2004.11.006. [DOI] [PubMed] [Google Scholar]
- 14.Goldfield GS, Murray MA, Buchholz A, Henderson K, Obeid N, Kukaswadia A, Flament MF. Family meals and body mass index among adolescents: effects of gender. Appl Physiol Nutr Metab. 2011;36:539–546. doi: 10.1139/h11-049. [DOI] [PubMed] [Google Scholar]
- 15.Chan JC, Sobal J. Family meals and body weight. Analysis of multiple family members in family units. Appetite. 2011;57:517–524. doi: 10.1016/j.appet.2011.07.001. [DOI] [PubMed] [Google Scholar]
- 16.Saelens BE, Sallis JF, Frank LD, Couch SC, Zhou C, Colburn T, Cain KL, Chapman J, Glanz K. Obesogenic neighborhood environments, child and parent obesity: The Neighborhood Impact on Kids Study. Am J Prev Med. 2012;42:e57–e64. doi: 10.1016/j.amepre.2012.02.008. [DOI] [PMC free article] [PubMed] [Google Scholar]
- 17.Frank LD, Saelens BE, Chapman J, Sallis JF, Kerr J, Glanz K, Couch SC, Learnihan V, Zhou C, Colburn T, Cain KL. Objective assessment of obesogenic environments in youth: geographic information system methods and spatial findings from the Neighborhood Impact on Kids Study. Am J Prev Med. 2012;42:E47–e55. doi: 10.1016/j.amepre.2012.02.006. [DOI] [PubMed] [Google Scholar]
- 18.Bourdeaudhuij ID, Klepp KI, Due P, Rodrigo CP, de Almeida M, Wind M, Kreiner R, Sandvik C, Brug J. Reliability and validity of a questionnaire to measure personal, social and environmental correlates of fruit and vegetable intake in 10-11 year-old children in five European countries. Public Health Nutr. 2005;8(2):189–200. doi: 10.1079/phn2004673. [DOI] [PubMed] [Google Scholar]
- 19.Birch LL, Fisher JO, Grimm-Thomas K, Markey CN, Sawyer R, Johnson SL. Confirmatory factor analysis of the child feeding questionnaire: a measure of parental attititudes, beliefs and practices about child feeding and obesity proneness. Appetite. 2001;36(3):201–210. doi: 10.1006/appe.2001.0398. [DOI] [PubMed] [Google Scholar]
- 20.Golan M, Weizman A. Reliability and validity of the Family Eating and Activity Habits Questionnaire. Eur J Clin Nutr. 1998;52:771–777. doi: 10.1038/sj.ejcn.1600647. [DOI] [PubMed] [Google Scholar]
- 21.Rockett RH. The Youth/Adolescent Questionnaire. Channing Laboratory; Boston MA: 1994. [Google Scholar]
- 22.Echeverria SE, Diez-Roux AV, Link BG. Reliability of self-reported neighborhood characteristics. J Urban Health. 2004;81:682–701. doi: 10.1093/jurban/jth151. [DOI] [PMC free article] [PubMed] [Google Scholar]
- 23.Guenther PM, DeMaio TJ, Ingwersen LA, Berlin M. The multiple pass approach for the 24-hour recall in the Continuing Survey of Food Intakes by Individuals (CSFII) 1994-1996. Presented at the International Conference of Dietary Assessment Methods; 1995; Boston. [Google Scholar]
- 24.Eck LH, Klesges RC, Hanson CL. Recall of a child’s intake from one meal: Are parents accurate? J Am Diet Assoc. 1989;89:784–789. [PubMed] [Google Scholar]
- 25.Achterberg CA, Pugh MA, Collins SE, Getty VM. Feasibility of telephone interviews to collect dietary information from children. J Can Diet Assoc. 1991;52:226–228. [Google Scholar]
- 26.Lytle LA, Nichaman MZ, Obarzanek E, Glovsky E, Montgomery D, Nicklas T, Zive M, Feldman H. Validation of 24-hour recalls assisted by food records in third grade students. J Am Diet Assoc. 1993;93:1431–1436. doi: 10.1016/0002-8223(93)92247-u. [DOI] [PubMed] [Google Scholar]
- 27.Van Horn L, Gernhofer N, Moag-Stahler A, Farris R, Hartmuller G, Lasser VI, Stumbo P, Craddick S, Ballew C. Dietary assessment in children using electronic methods: telephone and tape recorders. J Am Diet Assoc. 1990;90:412–416. [PubMed] [Google Scholar]
- 28.Schröder H, Vila J, Marrugat J, Covas MI. Low energy density diets are associated with favorable nutrient intake profile and adequacy in free-living elderly men and women. J Nutr. 2008;138:1476–1481. doi: 10.1093/jn/138.8.1476. [DOI] [PubMed] [Google Scholar]
- 29.Gunther AL, Liese AD, Bell RA, Dabelea D, Lawrence JM, Rodriguez BL, Standiford DA, Mayer-Davis EJ. Association between the Dietary Approaches to Hypertension Diet and hypertension in youth with diabetes mellitus. Hypertension. 2009;53:6–12. doi: 10.1161/HYPERTENSIONAHA.108.116665. [DOI] [PMC free article] [PubMed] [Google Scholar]
- 30.U.S. Department of Health and Human Services. Dietary Guidelines for Americans 2010. 7. Washington DC: US Government Printing Office; Dec, 2010. [Google Scholar]
- 31.Karanja NM, Obarzanek E, Lin P, McCullough ML, Phillips KM, Swain JF, Champagne CM, Hoben KP DASH Collaborative Research Group. Descriptive characteristics of the dietary pattern used in the Dietary Approaches to Stop Hypertension Trial. J Am Diet Assoc. 1999;99:S19–S27. doi: 10.1016/s0002-8223(99)00412-5. [DOI] [PubMed] [Google Scholar]
- 32.Institute of Medicine. Dietary Reference Intakes for Energy, Carbohydrates, Fiber, Fat, Protein, and Amino Acids (Macronutrients) Washington DC: The National Academies Press; 2002. [February 28, 2013]. Available at http://www.nap.edu/books/0309085373/html/ [Google Scholar]
- 33.Centers for Disease Control. BMI-for-age growth charts for girls and boys. CDC, National Center for Health Statistics; 2000. [Google Scholar]
- 34.Matheson DM, Robinson TN, Varady A, Killen JD. Do Mexican-American mothers’ food-related parenting practices influence their children’s weight and dietary intake? J Am Diet Assoc. 2006;106:1861–1865. doi: 10.1016/j.jada.2006.08.004. [DOI] [PubMed] [Google Scholar]
- 35.Vereecken C, Legiest E, De Bourdeaudhuij I, Maes L. Associations between general parenting styles and specific food-related parenting practices and children’s food consumption. Am J Health Promot. 2009;23(4):233–240. doi: 10.4278/ajhp.07061355. [DOI] [PubMed] [Google Scholar]
- 36.Gross SM, Pollock ED, Braun B. Family influence: key to fruit and vegetable consumption among fourth and fifth-grade students. J Nutr Educ Behav. 2010;42(4):235–241. doi: 10.1016/j.jneb.2009.05.007. [DOI] [PubMed] [Google Scholar]
- 37.Hughes SO, Shewchuk RM, Baskin ML, Nicklas TA, Qu H. Indulgent feeding style and children’s weight status in preschool. J Dev Behav Pediatr. 2008;29:403–410. doi: 10.1097/DBP.0b013e318182a976. [DOI] [PMC free article] [PubMed] [Google Scholar]
- 38.Hughes SO, Power TG, Orlet Fisher J, Mueller S, Nicklas TA. Revising a neglected construct: parenting styles in a child-feeding context. Appetite. 2005;44:83–92. doi: 10.1016/j.appet.2004.08.007. [DOI] [PubMed] [Google Scholar]
- 39.Hoerr SL, Hughes SO, Fisher JO, Nicklas TA, Liu Y, Shewchuk RM. Associations among parental feeding styles and children’s food intake in families with limited incomes. Int J Behav Nutr Phys. 2009;6:55–60. doi: 10.1186/1479-5868-6-55. [DOI] [PMC free article] [PubMed] [Google Scholar]
- 40.Golan M, Fainaru M, Weizman A. Role of behavior modification in the treatment of childhood obesity with the parents as the exclusive agents of change. Int J Obes. 1998;22:1217–1224. doi: 10.1038/sj.ijo.0800749. [DOI] [PubMed] [Google Scholar]
- 41.Faith MS, Berkowitz RI, Stallings VA, Kerns J, Storey M, Stunkard AJ. Parenting feeding attitudes and styles and child body mass index. Prospective analysis of a gene, environment interaction. Pediatrics. 2004;114:e429–436. doi: 10.1542/peds.2003-1075-L. [DOI] [PubMed] [Google Scholar]
- 42.Faith MS, Scanlon KS, Birch LL, Francis LA, Sherry B. Parent, child feeding strategies and their relationships to child eating and weight status. Obes Res. 2004;12:1711–1722. doi: 10.1038/oby.2004.212. [DOI] [PubMed] [Google Scholar]
- 43.Johannsen DL, Johannsen NM, Specker BL. Influence of parents’ eating behaviors and child feeding practices on children’s weight status. Obesity. 2006;14:431–439. doi: 10.1038/oby.2006.57. [DOI] [PubMed] [Google Scholar]
- 44.Campbell KJ, Crawford DA, Ball K. Family food environment and dietary behaviors likely to promote fatness in 5-6 year old children. Int J Obes (London) 2006;30:1272–1280. doi: 10.1038/sj.ijo.0803266. [DOI] [PubMed] [Google Scholar]
- 45.Carnell S, Wardle J. Associations between multiple measures of parental feeding and children’s adiposity in United Kingdom preschoolers. Obesity. 2007;15:137–144. doi: 10.1038/oby.2007.513. [DOI] [PubMed] [Google Scholar]
- 46.Haycraft EL, Blissett JM. Maternal and paternal controlling feeding practices. Reliability and relationships with BMI. Obesity. 2008;16:1552–1558. doi: 10.1038/oby.2008.238. [DOI] [PubMed] [Google Scholar]
- 47.Powers SW, Chamberlin LA, van Schaick KB, Sherman SN, Whitaker RC. Maternal feeding strategies, child eating behaviors, and child BMI in low-income African-American preschoolers. Obesity. 2006;14:2026–2033. doi: 10.1038/oby.2006.237. [DOI] [PubMed] [Google Scholar]
- 48.Spruijt-Metz D, Lindquist CH, Birch LL, Fisher JO, Goran MI. Relationship between mothers; child-feeding practices and children’s adiposity. Am J Clin Nutr. 2002;75:581–586. doi: 10.1093/ajcn/75.3.581. [DOI] [PubMed] [Google Scholar]
- 49.Ventura AK, Birch LL. Does parenting affect children’s eating and weight status? Int J Behav Nutr Phy. 2008;5:1–12. doi: 10.1186/1479-5868-5-15. [DOI] [PMC free article] [PubMed] [Google Scholar]
- 50.Fisher JO, Mitchell DC, Smiciklas-Wright H, Birch LL. Parental influences on young girls’ fruit and vegetable, micronutrient, and fat intakes. J Am Diet Assoc. 2002;102(1):58–64. doi: 10.1016/s0002-8223(02)90017-9. [DOI] [PMC free article] [PubMed] [Google Scholar]
- 51.Galloway AT, Fiorito L, Lee Y, Birch LL. Parental pressure, dietary patterns, and weight status among girls who are “picky eaters”. J Am Diet Assoc. 2005;105(4):541–548. doi: 10.1016/j.jada.2005.01.029. [DOI] [PMC free article] [PubMed] [Google Scholar]
- 52.Livingstone MB, Robson PJ, Wallace JM. Issues in dietary intake assessment of children and adolescents. Br J Nutr. 2004;(Suppl 2):S213–222. doi: 10.1079/bjn20041169. [DOI] [PubMed] [Google Scholar]
- 53.USDA. USDA National Nutrient Database for Standard Reference. [February 19, 2014]; Available at: http://ndb.nal.usda.gov/
- 54.Centers for Disease Control. CDC; 2010. [February 10, 2014]. The CDC Guide to Strategies for Reducing the Consumption of Sugar-Sweetened Beverages. Available at: http://www.cdph.ca.gov/SiteCollectionDocuments/StratstoReduce_Sugar_Sweetened_Bevs.pdf. [Google Scholar]
Associated Data
This section collects any data citations, data availability statements, or supplementary materials included in this article.