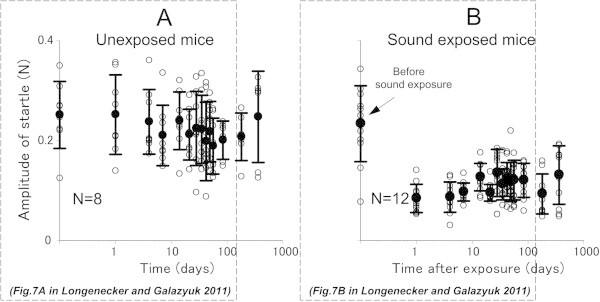
Figure 5.

Reduction in acoustic startle response amplitude after sound exposure. (A) Individual data points (open circles) and mean ± SD values from 8 control mice recorded over a 360 day period. (B) The same data collected from 12 experimental mice before and at different times after sound exposure.
