

Summary
During pathogenesis, Mycobacterium tuberculosis (Mtb) colonizes environments, such as the macrophage or necrotic granuloma, that are acidic and rich in cholesterol and fatty acids. The goal of this study was to examine how acidic pH and available carbon sources interact to regulate Mtb physiology. Here we report that Mtb growth at acidic pH requires host-associated carbon sources that function at the intersection of glycolysis and the TCA cycle, such as pyruvate, acetate, oxaloacetate and cholesterol. In contrast, in other tested carbon sources, Mtb fully arrests its growth at acidic pH and establishes a state of non-replicating persistence. Growth-arrested Mtb is resuscitated by the addition of pyruvate suggesting that growth arrest is due to a pH-dependent checkpoint on metabolism. Additionally, we demonstrate that the phoPR two-component regulatory system is required to slow Mtb growth at acidic pH and functions to maintain redox homeostasis. Transcriptional profiling and functional metabolic studies demonstrate that signals from acidic pH and carbon source are integrated to remodel pathways associated with anaplerotic central metabolism, lipid anabolism and the regeneration of oxidized cofactors. Because phoPR is required for Mtb virulence in animals, we suggest that pH-driven adaptation may be critical to Mtb pathogenesis.
Introduction
Mycobacterium tuberculosis (Mtb) is a slow growing bacterial pathogen. During growth in vitro, in macrophages, or in mice, Mtb has measured doubling times ranging from ∼20 hours to 70 days (Rohde et al., 2012, Gill et al., 2009, Munoz-Elias et al., 2005). Under low oxygen, Mtb enters a non-replicating persistent (NRP) state where the pathogen arrests growth but remains viable. Slow or arrested growth is thought to play an important role in the establishment of chronic infections and drug resistance. Understanding how Mtb regulates its growth rate in response to environmental cues encountered during infection, including acidic pH and carbon source availability, should provide insight into the physiology that makes Mtb a successful and difficult to treat pathogen.
Mtb growth and gene expression are strongly regulated by environmental pH (Piddington et al., 2000, Vandal et al., 2008, Vandal et al., 2009b, Abramovitch et al., 2011, Vandal et al., 2009a). In rich medium, the bacterium slows its growth below pH 6.4 and arrests its growth at ∼pH 5.0 (Abramovitch et al., 2011). Following one day of exposure to an acidic environment at pH 4.5, Mtb maintains an intracellular pH of ∼7.4, demonstrating that Mtb effectively buffers its cytoplasm and that changes in growth rate are not solely associated with cytoplasmic acidification (Vandal et al., 2008). Mutation of the Rv3671c membrane protein causes a loss of cytoplasmic pH-homeostasis and results in strong attenuation of virulence during mouse infection, supporting the idea that Mtb encounters environments in vivo where acidic pH-dependent adaptations are essential for pathogenesis (Vandal et al., 2008).
Transcriptional profiling studies of Mtb in response to acidic pH in vitro and in macrophages demonstrate widespread changes in gene expression (Fisher et al., 2002, Rohde et al., 2007). The phagosomal acidic pH regulon (Rohde et al., 2007) exhibits significant overlap with the phoPR two-component regulatory system (TCS) regulon (Walters et al., 2006, Gonzalo-Asensio et al., 2008), suggesting that phoPR may play a role in pH-driven adaptation. For example, the acid and phagosome regulated locus, aprABC, is strongly induced by acidic pH, requires phoP for its expression, and its promoter is strongly bound by the PhoP response regulator (Galagan et al., 2013, Abramovitch et al., 2011). phoPR mutants are highly attenuated during mouse and guinea pig infections (Perez et al., 2001, Martin et al., 2006), further supporting that pH-driven adaptation plays an important role during the course of infection.
Several PhoPR-regulated, acidic-pH induced genes are associated with carbon metabolism. For example, the pks2, pks3, and pks4 genes are associated with the production of cell envelope lipids sulfolipid, diacyl- and polyacyltrehalose (DAT and PAT) (Walters et al., 2006, Asensio et al., 2006), and the aprABC locus is associated with the control of triacylglycerol (TAG) accumulation and regulation of genes of central carbon and propionate metabolism (Abramovitch et al., 2011). While all the carbon sources available to Mtb in vivo are not specifically known, the requirement for isocitrate lyase (icl) during infection suggests that Mtb is metabolizing acetyl-CoA derived from long chain fatty acids via the glyoxylate shunt (McKinney et al., 2000), or propionyl-CoA derived from cholesterol via the methylcitrate cycle (Upton & McKinney, 2007, Savvi et al., 2008, Eoh & Rhee, 2014). Several lines of evidence support that cholesterol is an important carbon source during infection. For example, in macrophages, Mtb metabolizes cholesterol, and likely other lipids available on low-density lipoprotein, as carbon sources (Pandey & Sassetti, 2008, Russell et al., 2009); cholesterol and TAG are abundant lipids in the caseum of the human Mtb granuloma (Kim et al., 2010); and, several genes involved in cholesterol catabolism are essential for in vivo survival (Chang et al., 2009, Pandey & Sassetti, 2008). Mtb has also been shown to acquire and metabolize macrophage derived fatty acids (Lee et al., 2013) . The catabolism of cholesterol and fatty acids is predicted to produce acetyl-CoA, propionyl-CoA, pyruvate, and glycerol (Van der Geize et al., 2007), suggesting Mtb physiology may be regulated by these host-associated carbon sources.
Both the macrophage phagosome and the caseum of a necrotic granuloma can be acidic environments (Dannenberg, 2006); therefore, it is possible that Mtb integrates environmental signals from acidic pH and carbon nutrient availability to modulate its growth and metabolism. Indeed, Baek and colleagues have shown that a TAG synthase mutant (tgs1) has enhanced growth at acidic pH as compared to the wild type (WT) strain, genetically linking acidic pH, carbon metabolism, and growth rate (Baek et al., 2011). In this study, we explore the hypothesis that acidic pH and available carbon sources interact to regulate Mtb growth and physiology.
Results
Mtb exhibits carbon source specific growth arrest at acidic pH
Mtb has been shown to slow its growth at acidic pH in a variety of rich and minimal media (Piddington et al., 2000, Abramovitch et al., 2011, Baek et al., 2011, Vandal et al., 2008). To confirm these observations, Mtb strain CDC1551 was grown in 7H9 (OADC) medium buffered at pH 7.0 or pH 5.7 using 100 mM MOPS or MES, respectively. Following 9 days of incubation at pH 5.7, Mtb exhibited a 4-fold reduction in growth relative to Mtb grown at pH 7.0 (Fig. S1A). We hypothesized that changes in carbon metabolism may be associated with pH-dependent slowed growth. 7H9 (OADC) medium contains a variety of potential carbon sources including glycerol, glucose, oleic acid, albumin, amino acids and tween-80. In order to isolate the role of specific carbon sources, we investigated the growth of Mtb at pH 7.0 and 5.7 in a defined, buffered minimal medium (Lee et al., 2013). We first tested glucose and glycerol as carbon sources and observed that Mtb fully arrests its growth at pH 5.7 in the presence of these carbon sources alone or combined (Figs. S1B and S1C). In glycerol-amended medium, Mtb begins to exhibit slowed growth at pH 6.4, consistent with previous observations in rich medium (Abramovitch et al., 2011).
Given the observation of growth arrest in medium supplemented with glycolytic carbon sources, Mtb growth was examined in the presence of a variety of carbon sources associated with central metabolism (Figs. 1A, S2). For these experiments, Mtb cultures were grown in rich medium, pelleted and then seeded at an initial density of OD 0.05 in standing, vented flasks containing 8 mL of buffered minimal medium and a single carbon source. Cultures were incubated for nine days and growth was measured at three-day intervals. As a control, to determine the effect of residual extracellular or intracellular carbon sources, cultures were also seeded in medium without the addition of a carbon source. In this “No Carbon” control, very little growth was observed at pH 7.0 and no growth was observed at pH 5.7 (Fig. 1A, S2), supporting that growth above this baseline is promoted by metabolism of the specified carbon source. For the carbon sources that supported growth at pH 7.0, it was observed that at pH 5.7, some carbon sources restricted growth while others permitted growth (Fig. 1A, S2). Notably, carbon sources that feed central metabolism at the intersection of glycolysis and the TCA cycle permitted growth at acidic pH, including: phosphoenolpyruvate (PEP), pyruvate, oxaloacetate, and acetate (Fig. 1A). Pyruvate was the preferred carbon source at pH 5.7, with similar growth relative to pH 7.0 (Fig. 1B). In a long-term 36-day growth experiment, Mtb cultured in 10 mM glycerol at pH 7.0 reaches stationary phase, while at pH 5.7 the culture remains growth-arrested, showing that the 9-day trends extend to stationary phase and that differing total biomasses are achieved. In contrast, cultures incubated in 10 mM pyruvate at acidic and neutral pH over 36 days reach a similar optical density at stationary phase (Fig S3A). Mtb cholesterol catabolism is predicted to generate pyruvate, acetyl-CoA and propionyl-CoA and indeed, cholesterol also permitted modest growth at acidic pH (Fig. 1A, S2). Together, these data demonstrate that the ability of Mtb to grow at acidic pH is carbon source-specific. The growth permissive carbon sources all feed central metabolism at a switch point in metabolism known as the PEP-pyruvate-oxaloacetate node or anaplerotic node (Sauer & Eikmanns, 2005). Therefore, our findings suggest that metabolic flexibility afforded by carbon sources feeding the anaplerotic node may play a role in promoting growth in acidic environments (Fig. 1C).
Figure 1. Mtb exhibits carbon source specific growth arrest at acidic pH.
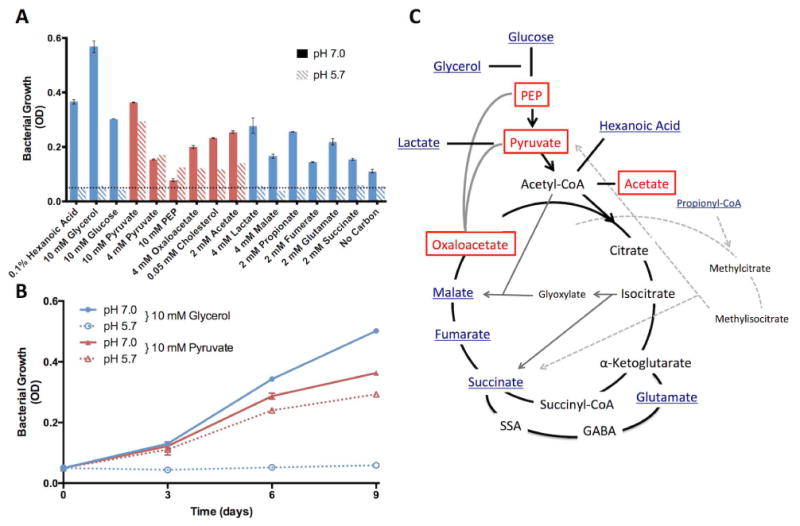
A. Mtb growth on various carbon sources at both neutral and acidic pH. Cultures were seeded at a starting density of 0.05 OD600 (horizontal dotted line) and growth was measured every three days for 9 days. The growth curves are presented in Fig. S2 and the day 9 endpoint data are summarized in this panel. Carbon sources are designated as either permissive (red bars) or restrictive (blue bars) for growth at acidic pH, as compared to the growth baseline in the “No Carbon” control. Only PEP, pyruvate, oxaloacetate, acetate and cholesterol promoted growth at acidic pH. B. Growth curves showing glycerol arrests growth and pyruvate promotes growth of Mtb at acidic pH. C. Model showing the position within central carbon metabolism of carbon sources permissive (boxed) and restricted (underlined) for growth at acidic pH. The panel is modified from Tian et al. (Tian et al., 2005). Error bars represent the standard deviation and the data are representative of two independent experiments.
pH-driven, carbon-source dependent growth arrest is species specific
During pathogenesis, Mtb will encounter environments with acidic pH and restricted carbon sources; therefore we hypothesized that the pH-dependent growth arrest phenotype may have evolved as a pathogenesis-specific adaptation. Previously, Piddington and colleagues observed that Mtb grown in pH 6.0 Sauton's medium (where glycerol is the primary carbon source) exhibits strongly restricted growth at acidic pH, as compared to a modest decrease in growth with the non-pathogenic, environmental species M. smegmatis (Piddington et al., 2000). To determine if pH- and carbon source-specific growth arrest is an evolved pathogenesis trait, the growth of the non-pathogenic species M. smegmatis was examined in a variety of single carbon sources at acidic and neutral pH. In contrast to Mtb, the growth of M. smegmatis was not slowed at pH 5.7 on any of the tested carbon sources, except glycerol, where there was an ∼30% reduction in growth (Fig. S4A). The lack of carbon source-specific growth arrest at acidic pH in M. smegmatis supports an evolutionary model whereby this physiology may function to promote pathogenesis in animals.
Given that differences exist in the physiology and virulence of different Mtb strains (Homolka et al., 2010), we examined if the growth arrest phenotype observed in CDC1551 was conserved in other Mtb strains. The Mtb strains CDC1551, H37Rv, HN878, and Erdman were all grown at pH 7.0 or pH 5.7 in the presence of either glycerol or pyruvate. Consistent with CDC1551, all of the strains grew well on glycerol at pH 7.0, but were arrested for growth at pH 5.7 (Fig. S4B). Pyruvate as a single carbon source allowed growth at both pH 7.0 and pH 5.7 for each strain, albeit with differences in the magnitude of growth (Fig. S4B). This finding supports that the carbon source specific growth arrest observed in CDC1551 is qualitatively consistent with other Mtb strains.
Intracellular pH homeostasis and viability are maintained during growth arrest
To investigate the physiology of pH-dependent growth arrest, we examined the effect of growth arrest on intracellular pH homeostasis and viability. Previously, in rich media at acidic pH, it has been shown that Mtb maintains intracellular pH homeostasis (Vandal et al., 2008). However, it is possible that in minimal medium, Mtb is impaired in maintaining pH homeostasis. To determine if pH-dependent growth arrest was associated with a loss of pH-homeostasis, intracellular pH was quantified using an assay employing the pH sensitive fluorescent dye CMFDA (Purdy et al., 2009). Mtb grown in minimal medium with glycerol or pyruvate at pH 5.7 exhibited a slight acidification of the cytoplasm as compared to growth at pH 7.0 (Fig. 2A). However, at pH 5.7, there was no significant difference between the cytoplasmic pH of Mtb under growth restrictive or permissive conditions. Therefore, Mtb is capable of maintaining pH homeostasis at pH 5.7 in both glycerol and pyruvate, and intracellular pH is not associated with differential growth.
Figure 2. Growth-arrested Mtb is resuscitated with pyruvate.
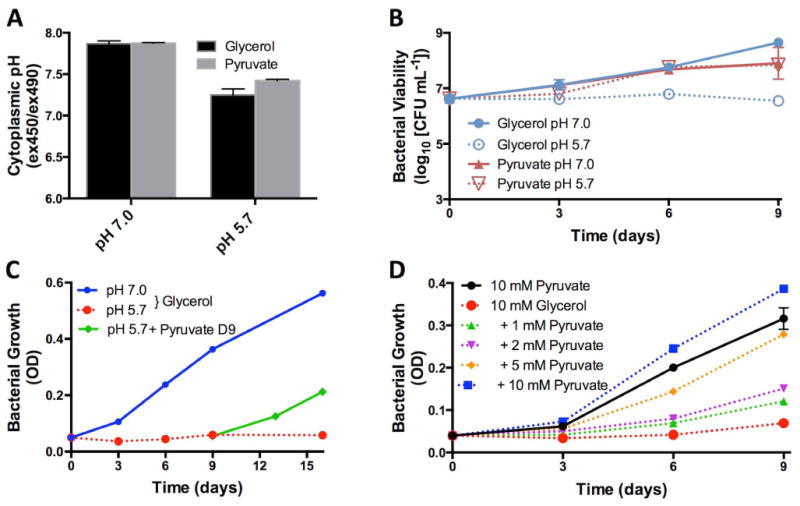
A. Mtb can maintain its cytoplasmic pH homeostasis in response to both glycerol and pyruvate at pH 7.0 and pH 5.7. B. Mtb remains viable during acidic pH growth arrest as measured by colony forming units (CFU). This finding suggests that Mtb enters a state of non-replicating persistence driven by acidic pH and carbon source. C. Following 9 days of growth arrest in minimal medium with 10 mM glycerol at pH 5.7, addition of 10 mM pyruvate resuscitates Mtb growth (green line). Therefore, Mtb growth arrest at acidic pH is reversible and non-lethal. D. Pyruvate promotes Mtb growth in 10 mM glycerol in a concentration dependent manner. Error bars represent the standard deviation and the data are representative of three individual experiments.
To determine if growth-arrested cells were viable, colony-forming units (CFU) were counted for Mtb grown in minimal medium, at pH 7.0 or 5.7, with glycerol or pyruvate as a sole carbon source. No significant reduction in bacterial viability was observed in Mtb cultured at pH 5.7 with glycerol over the 9-day time course, showing that growth-arrested Mtb maintains its viability in the absence of growth (Fig. 2B). Thus, growth arrest is not due to glycerol-mediated toxicity and cell death.
Pyruvate resuscitates growth-arrested Mtb
The viability of growth-arrested Mtb raised the possibility that the bacteria may be resuscitated with a growth permissive carbon source. To test this hypothesis, following 9 days of growth arrest on glycerol at pH 5.7, 10 mM pyruvate was added to the culture. Remarkably, pyruvate resuscitated growth-arrested Mtb (Fig. 2C), even in the continued presence of 10 mM glycerol in the medium, demonstrating bacterial viability and the growth permissive effect of pyruvate is dominant over the growth restrictive effect of glycerol.
To further explore the growth permissive activity of pyruvate, Mtb growth in 10 mM glycerol at pH 5.7 was examined with increasing amounts of pyruvate (from 1 mM to 10 mM). At pH 5.7, pyruvate relieved glycerol-dependent growth arrest in a concentration dependent manner (Fig. 2D). Mtb grown with 10 mM of both pyruvate and glycerol, showed improved growth as compared to 10 mM pyruvate alone, suggesting the addition of pyruvate enables the co-metabolism of glycerol. Together, these findings demonstrate that Mtb integrates environmental pH and available carbon source to control its growth. Indeed, Mtb appears to establish a state of NRP under acidic pH with glycerol and can be resuscitated in the presence of pyruvate.
phoP is required to slow growth in response to acidic pH
Mtb begins to slow its growth in minimal medium with glycerol at pH 6.4, the same pH threshold at which the phoPR regulon is induced by acidic pH (Abramovitch et al., 2011). The phoPR regulon is strongly induced at pH 5.7 and differentially regulates genes associated with carbon and lipid metabolism (Walters et al., 2006, Gonzalo-Asensio et al., 2008, Abramovitch et al., 2011). Therefore, we hypothesized that phoPR may play a role in carbon-source dependent growth arrest. To explore this hypothesis, we examined the response of a CDC1551 phoP transposon mutant (phoP::Tn, (Abramovitch et al., 2011)), a phoPR deletion mutant and the complemented mutant (ΔphoPR and ΔphoPR comp (Tan et al., 2013)) during growth on single carbon sources at acidic pH. Unexpectedly, at pH 7.0, the ΔphoPR mutant exhibited impaired growth on glycerol and pyruvate as single carbon sources as compared to the WT and complemented ΔphoPR mutant (Fig. 3A and 3C). Therefore, phoPR is required for growth in medium with glycerol or pyruvate as single carbon sources at neutral pH. At pH 5.7, the phoP mutants maintained arrested growth on glycerol (Fig. 3B); however, the phoP mutants exhibited significantly enhanced growth on pyruvate as compared to wild type Mtb (Fig. 3D). The enhanced growth on pyruvate at pH 5.7 was complemented in the ΔphoPR mutant. The ability of the phoP mutants to grow better on pyruvate at acidic pH than at neutral pH is an important observation for several reasons. This finding demonstrates that acidic pH, in a phoP-independent manner, remodels Mtb physiology to allow growth on pyruvate, and makes available physiological pathways that are inaccessible at neutral pH. It is also notable that following these adaptations, the ΔphoPR mutant exhibits faster growth on pyruvate at pH 5.7 than the WT in any other tested growth condition. This finding shows that phoPR functions to slow growth at acidic pH and, thus, explains why reduced growth and induction of the phoPR regulon are so closely associated (Abramovitch et al., 2011).
Figure 3. phoPR is required to slow Mtb growth at acidic pH.
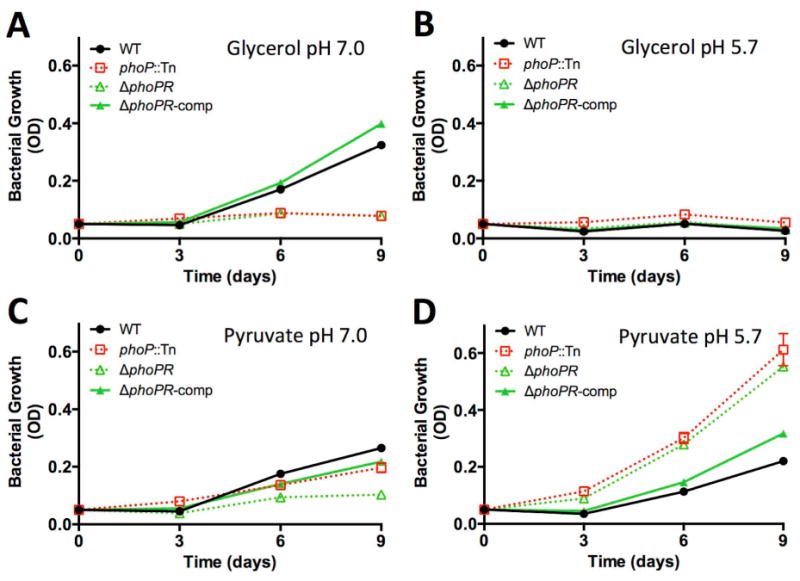
Growth of WT, phoP::Tn mutant, ΔphoPR mutant, and ΔphoPR complemented strains in minimal medium containing 10 mM glycerol at pH 7.0 (A), 10 mM glycerol at pH 5.7 (B), 10 mM pyruvate at pH 7.0 (C), and 10 mM pyruvate at pH 5.7 (D) as a single carbon source. Note that at neutral pH the strains lacking phoP have reduced growth on pyruvate and glycerol as compared to the WT or complemented strains. At pH 5.7, strains lacking phoP have enhanced growth on pyruvate, as compared to the WT and complemented strains. Error bars represent the standard deviation and the data are representative of three biological replicates.
Acidic pH, carbon source and phoP modulate redox homeostasis
The involvement of phoPR in the control of growth in response to changes in pH and carbon metabolism suggests that genes of the phoPR regulon play a role in modulating growth. Several genes in the phoPR regulon, including pks2, pks3, pks4, and aprA have been proposed to control redox homeostasis in Mtb (Singh et al., 2009, Abramovitch et al., 2011). In this model, under conditions that cause an accumulation of reduced cofactors, such as NADH or NADPH, Mtb synthesizes long chain fatty acids using the NADPH consuming fatty acid synthase 1 (fas) enzyme to replenish pools of oxidized cofactors (Singh et al., 2009, Farhana et al., 2010). Long chain fatty acids can then be used for the generation of storage lipids such as TAG and phoP-dependent cell envelope-associated lipids such as sulfolipid. Given this model, we hypothesized that changes in cytoplasmic redox homeostasis may be associated with pH-, carbon source- and phoP-dependent growth arrest.
To characterize the role of redox homeostasis in growth arrest, we examined cytoplasmic redox potential using an Mtb strain expressing a redox sensitive GFP (roGFP). roGFP exhibits ratiometric changes in the excitation wavelength based on the redox state of its disulfide bonds and thus provides a measure of cytoplasmic redox potential (Hanson et al., 2004, Cannon & Remington, 2006). roGFP has recently been shown to function in Mtb as a reporter of cytoplasmic redox potential (Bhaskar et al., 2014). At pH 5.7, glycerol as a sole carbon source resulted in a decreased roGFP ratio (Fig. 4A and B, i.e. a more reduced intracellular environment) showing that acidic pH in the presence of glycerol causes enhanced thiol reduction and, consequently, a reduced cytoplasmic potential. For the growth-arrested phoP::Tn mutant in minimal medium with glycerol at pH 7.0, we observed a reduced cytoplasmic potential that was equal to that of WT Mtb on glycerol at pH 5.7 (Fig. 4B). This finding demonstrates that phoP is required to maintain redox homeostasis during growth on glycerol and that growth arrest is associated with reductive stress. The phoP::Tn mutant grown with glycerol at acidic pH exhibits an even more strongly reduced cytoplasm (Fig. 4B) demonstrating that PhoP functions to counteract acidic pH-associated reductive stress.
Figure 4. Acidic pH, carbon source and phoP modulate redox homeostasis.
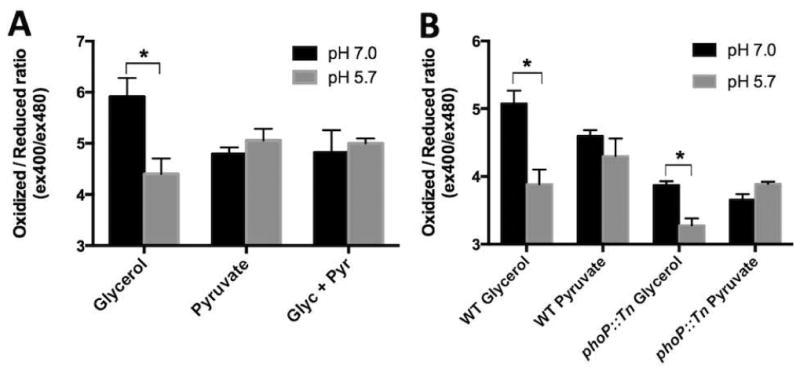
Intracellular redox state was measured using a redox sensitive disulfide bond-containing GFP (roGFP) by calculating the ratio of fluorescence emission from 400nm and 480nm excitation. A lower ratio indicates a more reduced roGFP while a higher ratio indicates a more oxidized roGFP. A. WT Mtb growing on glycerol exhibits a more reduced cytoplasm at acidic pH. However, when pyruvate is present, Mtb does not exhibit a shift in cytoplasmic redox potential. B. The phoP::Tn mutant exhibits a more reduced cytoplasm, as compared to the wild type, at pH 7.0 when grown on both glycerol and pyruvate. At pH 5.7, the phoP mutant exhibits an even more reduced cytoplasm in glycerol, while maintaining it redox potential in pyruvate. Error bars indicate the standard deviation of three biological replicates each calculated from the average of three technical replicates. The data are representative of two individual experiments. *p<0.05 using a student's t-test.
Glycerol-mediated growth arrest at acidic pH is associated with a reduced cytoplasmic potential; therefore, we hypothesized that pyruvate may alleviate acid-mediated reductive stress. When Mtb is grown in pyruvate alone, or glycerol and pyruvate, the redox potential of the cytoplasm remains unchanged at pH 7.0 and 5.7 (Fig. 4A), demonstrating that Mtb does not experience pH-dependent metabolic stress in the presence of pyruvate. Notably, the phoP::Tn mutant grown on pyruvate as a single carbon source exhibits slow growth at neutral pH and enhanced growth at acidic pH; however, the redox potential in both cases was similar to that of growth-arrested Mtb grown on glycerol at pH 5.7. Therefore, we conclude that a reduced cytoplasmic potential is associated with growth arrest on specific carbon sources, but reductive stress, in the absence of phoP, is not sufficient to cause growth arrest. To determine if growth arrest was associated with a shortage of oxidized cofactors, we examined NAD+/NADH and NADP+/NADPH ratios and observed a significant increase in the NAD+/NADH ratio at acidic pH in both 10 mM glycerol or pyruvate and no change in the NADP+/NADPH ratio (Fig S5). These observations demonstrate that Mtb can maintain a cellular pool of oxidized NAD under conditions of pH-induced reductive stress and that the reduced cytoplasmic potential may be driven by a cytoplasmic redox buffer, such as mycothiol or thioredoxin.
Acidic pH causes transcriptional remodeling of pathways associated with anaplerosis, lipid anabolism, and oxidation of redox cofactors
To explore the mechanisms by which acidic pH remodels Mtb physiology, we undertook RNAseq-based transcriptional profiling studies. Mtb transcripts were examined following 3 days incubation in minimal medium under four conditions: glycerol pH 7.0, glycerol pH 5.7, pyruvate pH 7.0 and pyruvate pH 5.7. At pH 7.0, only modest transcriptional changes are associated with growth on glycerol or pyruvate, with 63 genes significantly induced (up >1.5 fold, p< 0.05) and 17 genes significantly repressed in pyruvate as compared to glycerol (Fig. S6A, Table S1). This finding demonstrates limited transcriptional remodeling in response to these carbon sources, perhaps reflecting unrestricted metabolism between glycerol and pyruvate at neutral pH. At acidic pH, substantial transcriptional remodeling is observed in both glycerol and pyruvate, with hundreds of genes exhibiting significant differential regulation (Fig. S6B and S6C, Tables S2, and S3). In contrast to pH 7.0, a direct comparison of transcriptional profiles between pyruvate and glycerol at pH 5.7, revealed 275 and 445 genes with differentially induced or repressed expression, respectively (Fig. S6D and Table S4). Overall, these findings support that acidic pH and carbon source, together, promote substantial remodeling of Mtb physiology.
Previous attempts to characterize pH-regulated genes have been complicated by the association of acidic pH with a strong downregulation of growth and induction of the stress response, thus making it difficult to separate the genes that are specifically responding to pH, from those associated with a shift in growth and stress status (Abramovitch et al., 2011, Fisher et al., 2002). Comparisons of the RNA-seq profiles identified genes with pH-dependent, carbon source-independent differential expression, with 185 acid-induced genes (Fig. 5A, S7A, Table S5A) and 134 acid-repressed genes (Fig. 5B, S7B, Table S5C). These genes represent the Mtb pH-dependent regulon that is independent of growth status. The induced genes are highly represented in pathways associated with carbon metabolism and redox homeostasis. For example, many genes of the phoPR regulon (Walters et al., 2006, Gonzalo-Asensio et al., 2008, Abramovitch et al., 2011) are strongly induced by acidic pH in both glycerol and pyruvate: pks2-mmpL8 locus, pks3-mmpL10 locus, malate dehydrogenase (mez) and NADH dehydrogenase (ndh). Additionally, several genes without evidence of phoP-dependent regulation are induced by acidic pH in both glycerol and pyruvate, including fatty acid synthase (fas), PDIM synthesis (ppsA-ppsE), pyruvate phosphate dikinase (ppdK), and thioredoxin reductase (trxB). These acid regulated genes are associated with the regulation of Mtb carbon metabolism, lipid anabolism, and replenishment of oxidized cofactors and are consistent with a model where acidic pH is remodeling carbon metabolism to produce lipids and oxidize redox cofactors (Fig. S8).
Figure 5. Genes that are induced or repressed by acidic pH in a carbon source independent and dependent manner.
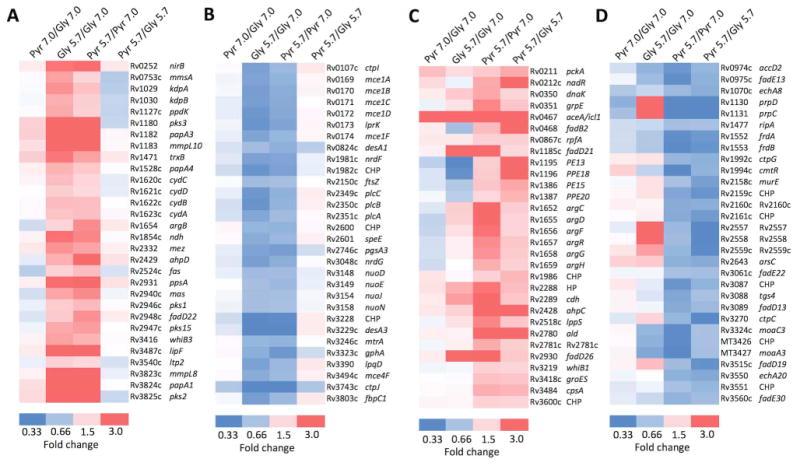
A. Selection of 30 genes (out of 185 total) that are induced by acidic pH in both glycerol and pyruvate without a significant difference in the induction (Table S5A). B. Selection of 30 genes (out of 134 total) that are repressed by acidic pH in both glycerol and pyruvate without difference in the induction (Table S5C). C. Selection of 30 genes (out of 60 total) that are induced at pH 5.7 in pyruvate and the induction is significantly greater in pyruvate as compared to glycerol (Table S5B). D. Selection of 30 genes (out of 75 total) that are repressed at pH 5.7 in pyruvate and the repression is significantly greater in pyruvate as compared to glycerol (Table S5D). CHP, conserved hypothetical protein; HP hypothetical protein.
An additional goal of performing these transcriptional studies was to identify the mechanisms by which pyruvate remodels physiology at acidic pH. Transcriptional profiles consistent with pyruvate- and acidic pH-specialized expression are predicted to exhibit i) differential expression in pyruvate at pH 5.7 as compared to pH 7.0 (Fig. S6C) and ii) differential expression in pyruvate as compared to glycerol at pH 5.7 (Fig., S6D, S7AB). For example, genes that are induced in pyruvate and glycerol at pH 5.7, but exhibit enhanced induction in pyruvate are exhibiting pyruvate- and pH-specialized induction. We identified 16 genes with this profile (Fig. 5C and S7A). Genes exhibiting pyruvate and pH-specialized induction were also identified that are stable in glycerol at pH 5.7 (31 genes) and that are repressed in glycerol at pH 5.7 (13 genes), for a total of 60 genes that are induced in a pyruvate- and pH-specialized manner (Fig. 5C, S7A, Table S5B). Using a similar analysis we identified 75 genes that are repressed in a pyruvate- and pH-specialized manner (Fig. 5D and S7B, Table S5D). Genes were also regulated in a glycerol- and pH-specialized manner, with 46 genes and 26 genes showing enhanced induction or repression in glycerol at acidic pH, respectively (Fig. S7AB, Tables S5E and S5F).
The transcriptional profiling data provide additional support for the hypothesis that Mtb promotes metabolism around the anaplerotic node at acidic pH (Fig. 1A, S2). Many of the genes that are most strongly induced in a pyruvate- and pH-specialized manner are associated with the anaplerotic node, including phosphoenolpyruvate carboxykinase (pckA) and isocitrate lyase (icl1, Fig. 5C, S7C). pckA links the TCA cycle to glycolysis via the reversible metabolism of oxaloacetate to PEP and icl1 acts as a bypass of an oxidative branch of the TCA cycle via the glyoxylate shunt. pckA and icl1 exhibit induction by pyruvate at pH 7.0 and further induction by acidic pH in both glycerol and pyruvate, with the result of 2 fold and 4 fold induction in pyruvate as compared to glycerol at pH 5.7, respectively. These findings are fully consistent with our growth studies and reinforce that acidic pH and pyruvate promote metabolism around the PEP-pyruvate-oxaloacetate node. The observation of icl1 induction at acidic pH is also consistent with prior observations under different pH stress conditions (Fisher et al., 2002, Rohde et al., 2007). Icl also functions as a methylisocitrate lyase that is required for the methylcitrate cycle and Mtb growth on single carbon sources such as acetate and propionate (Eoh & Rhee, 2014). Therefore, it is interesting that the methyl citrate cycle is strongly repressed in a pH- and pyruvate specialized manner, with methyl citrate synthase (prpC) and methylcitrate dehydratase (prpD) both being downregulated ∼29 fold in pyruvate compared to glycerol at pH 5.7. This strong difference is the result of prpCD being induced by acidic pH in glycerol, but repressed in pyruvate (Fig. 5D). The divergent regulation of the methyl citrate cycle further supports pH-dependent modulation of central carbon metabolism and may have consequences for the metabolism of cholesterol during pathogenesis.
Acidic pH remodels Mtb lipid and central carbon metabolism
The transcriptional profiling data identified widespread induction of genes associated with lipid metabolism. For example, in both glycerol and pyruvate at pH 5.7, the mmpL8-pks2 operon (Rv3823c-Rv3825c) is strongly induced (Fig. 5A). This operon has been shown to control the synthesis of sulfolipid (Sirakova et al., 2001) in a phoPR-dependent manner (Asensio et al., 2006, Walters et al., 2006). Therefore, it is predicted that sulfolipid should accumulate at acidic pH. To test this prediction, Mtb was grown in minimal medium amended with 10 mM pyruvate buffered at pH 7.0 and pH 5.7. The culture was incubated for 3 days, to enable the cultures to become pH-adapted, and the lipids were then radiolabeled with a trace amount of 14C acetate. As predicted, in wild type Mtb, sulfolipids were induced ∼ 3 fold at pH 5.7 as compared to pH 7.0 (Fig. 6A, S9AC). The ΔphoPR mutant did not accumulate sulfolipids and this phenotype was complemented (Fig. 6A, S9C). Therefore, acidic pH remodels lipid metabolism by stimulating PhoPR and promoting the accumulation of sulfolipid.
Figure 6. Acidic pH modulates accumulation of mycobacterial lipids and sensitivity to 3NP.
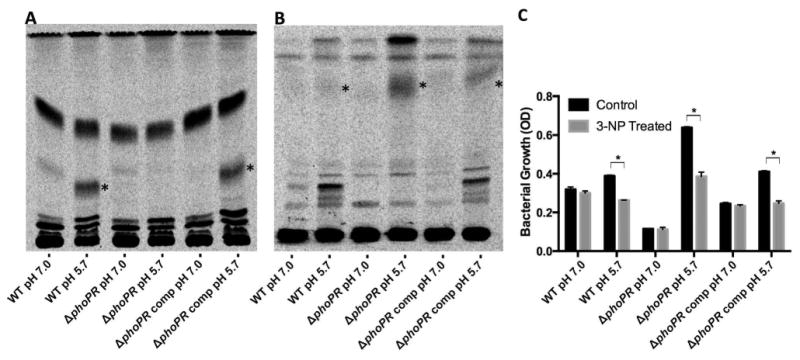
A. Accumulation of sulfolipid at acidic pH. For each strain, 20000 CPM of 14C labeled lipids was spotted at the origin and the TLC was developed three times in chloroform:methanol:water (90:10:1 v/v/v). Sulfolipid is highlighted with the asterisk and accumulates in a pH- and phoPR-dependent manner. B. Accumulation of TAG in the phoPR mutant at acidic pH. For each strain, 20000 CPM of 14C labeled lipids was spotted at the origin and the TLC was developed in hexane:diethyl ether:acetic acid (80:20:1 v/v/v). TAG is highlighted with the asterisk and accumulates in a pH- and phoPR-dependent manner. The data are representative of two independent biological replicates. C. 3-NP inhibits Mtb growth at acidic pH. The data presented are the end-point of culture growth following 9 days of incubation at acidic or neutral pH in the presence or absence of 0.1 mM 3-NP. Data showing the entire time-course are presented in Figure S10. Error bars represent the standard deviation and the data are representative of two biological replicates. *p<0.005 using a student's t-test.
One proposed role for the synthesis of phoPR-dependent lipids is to consume reductants and relieve reductive stress (Singh et al., 2009, Farhana et al., 2010). This model is supported by our roGFP studies (Fig. 4B), where the phoP::Tn mutant has a more reduced cytoplasm. Based on the reductive stress model, it is predicted that the ΔphoPR mutant may accumulate other long chain fatty acids to compensate for the loss of phoPR-dependent lipids. Indeed, enhanced PDIM accumulation has previously been observed in the phoP::Tn mutant (Abramovitch et al., 2011) and, conversely, a loss of PDIM causes an accumulation of sulfolipid (Jain et al., 2007). When grown on pyruvate, relatively low levels of radiolabelled PDIM are observed in all of the tested strains or conditions (Fig. S9B); however, TAG accumulation is induced ∼3 fold in WT Mtb at pH 5.7 and ∼6 fold in the phoPR mutant (Fig. 6B, S9C). Therefore, Mtb accumulates both TAG and sulfolipid at acidic pH, and in the absence of phoPR and sulfolipid, compensates by increasing the accumulation of TAG.
Our data support that environmental pH acts as a checkpoint on Mtb metabolism and that acidic pH restricts some metabolic pathways while making new pathways available to the bacterium. Indeed, the phoPR mutant exhibits restricted growth on pyruvate at pH 7.0 and substantially enhanced growth at pH 5.7 (Fig. 3), strongly supporting that acidic pH makes new metabolic avenues available to the pathogen. We hypothesized that the glyoxylate shunt or methylcitrate cycle may be promoted at acidic pH, based on the strong induction of icl1 at acidic pH (Fig. 5C) and the requirement of carbon sources that fuel the anaplerotic node for growth at acidic pH (Fig. 1A). To test this hypothesis, the effect of the isocitrate lyase inhibitor 3-nitropropionic acid (3-NP) was tested on Mtb grown on pyruvate at pH 7.0 and 5.7. In wild type Mtb, a significant ∼30% reduction of growth was observed at acidic pH in the presence of 3-NP (Fig. 6C, S10). No change in growth was observed at neutral pH, suggesting that icl is required in a pH-dependent manner. In the ΔphoPR mutant, we observed a similar 40% decrease in growth caused by the addition of 3-NP. Notably, almost all of the enhanced growth observed in the ΔphoPR mutant at acidic pH is inhibited by 3-NP (Fig. 6C). Therefore, acidic pH, in a phoP-independent manner, promotes metabolism through a 3-NP sensitive pathway, such as the glyoxylate shunt or methylcitrate cycle.
Discussion
We have shown that acidic pH alone does not slow Mtb growth. When supplied an appropriate carbon source, such as pyruvate, or in the absence of phoPR, Mtb grows about as well, or better, at acidic pH as compared to neutral pH. This reveals that slow growth at acidic pH is regulated by available carbon sources and signal transduction-dependent transcriptional remodeling (Fig. 7). Additional studies examining the mechanisms of slowed growth at acidic pH demonstrate that Mtb exhibits a reduced cytoplasm, promotes the synthesis of sulfolipid, and induces expression of genes associated with anaplerotic metabolism. Together, these findings support that Mtb can link pH and available carbon sources as environmental cues to regulate its growth and metabolism. During infection, this physiological adaptation may enable Mtb to survive in microenvironments that are otherwise inhospitable for microbial colonization.
Figure 7. Schematic diagram summarizing the role of acidic pH in regulating growth and redox homeostasis.
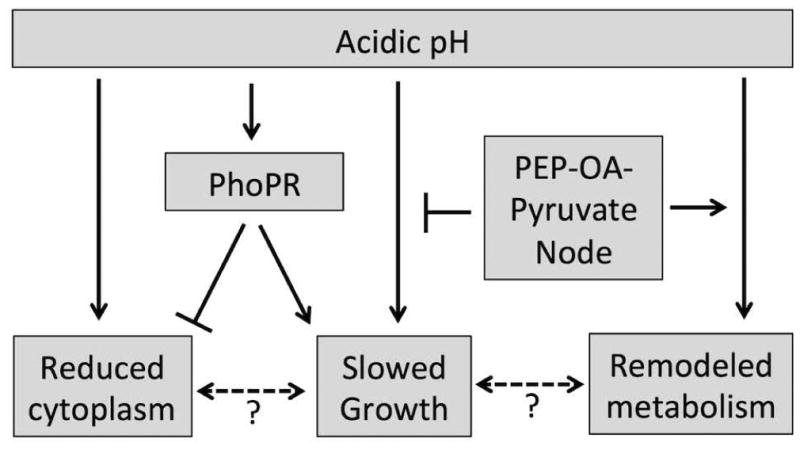
Acidic pH drives a reduction of the cytoplasmic potential and a slowing of Mtb growth. PhoPR functions to mitigate reductive stress and slow Mtb growth. This is possibly achieved by syphoning carbon away from the TCA cycle to promote oxidation of NADPH through lipid anabolism, such as acid inducible sulfolipid accumulation (Fig. 6A). Addition of PEP-oxaloacetate- pyruvate node metabolites may promote growth by fueling the TCA cycle and remodeling central metabolism, including the induction of pckA and icl1.
We have identified two distinct branches of pH-driven adaptation: a phoPR-dependent branch and phoPR-independent branch (Fig. 7). The phoPR-dependent branch plays a role in maintaining redox homeostasis and slowing growth. In glycerol, acidic pH causes a reduced cytoplasmic potential that is associated with slowed growth and induction of the phoPR regulon. Notably, the ΔphoPR mutant grows poorly at pH 7.0 on glycerol or pyruvate, carbon sources that are permissive for growth of WT Mtb at neutral pH (Fig. 3). This growth arrest is associated with a reduction of the cytoplasmic potential (Fig. 4B), demonstrating that phoPR is required for redox homeostasis and growth on glycerol or pyruvate. A possible mechanism for phoPR-dependent maintenance of redox homeostasis is the production of methyl-branched lipids such as sulfolipid. Anabolism of these lipids would oxidize NADPH as well as reduce flux through the TCA cycle, thus decreasing the production of NADH. Consistent with this model, we observe that sulfolipid accumulates in a pH- and phoPR-dependent manner (Fig. 6A). In the absence of phoPR, Mtb accumulates TAG, possibly to compensate for a loss of phoPR-dependent lipid anabolism (Fig. 6B). Similarly, Singh and colleagues have also observed that a whiB3 mutant, that is defective in synthesis of sulfolipid, experiences reductive stress and enhanced TAG accumulation (Singh et al., 2009). Thus, we propose that phoPR may cause slow growth at acidic pH by syphoning carbon towards lipid anabolism as part of its function to maintain redox homeostasis.
The response of the ΔphoPR mutant to acidic pH also supports a role for phoPR-independent mechanisms of pH-driven adaptation. The dramatic shifts in growth phenotypes of the ΔphoPR mutant in pyruvate at pH 5.7 (enhanced growth) as compared to pH 7.0 (restricted growth) support that phoPR-independent remodeling of metabolism promotes growth at acidic pH on select carbon sources. This hypothesis is supported by the observations that at acidic pH: i) addition of 3-NP, an inhibitor of icl, decreases the enhanced growth observed in the ΔphoPR mutant (Fig. 6C), ii) icl1 and pckA expression is induced (Fig. 5C), and iii) Mtb favors carbon sources feeding the anaplerotic node (Fig. 1A). The inhibitory effect of 3-NP on the enhanced growth and induction of icl1 expression supports that the glyoxylate shunt or methylcitrate cycle may be one of the induced metabolic pathways that become available to Mtb at acidic pH. Eoh and Rhee have shown that, when Mtb is grown on glucose or propionate, disruption of icl causes decreased cytoplasmic pH, imbalanced NAD+/NADH ratios and an altered membrane potential (Eoh & Rhee, 2014). Therefore, induction of icl at acidic pH may function to promote metabolism that maintains pH- and redox-homeostasis.
The presented growth, genetic and lipid metabolism studies support a model whereby carbon metabolism is remodeled by acidic pH. Transcriptional profiling experiments reveal that several key genes of central metabolism are induced by acidic pH. Most notably, pckA and icl1 are strongly induced by both acidic pH and pyruvate. Muñoz-Elías and McKinney have suggested that pckA and icl1, which are both essential for growth in animals (McKinney et al., 2000, Munoz-Elias & McKinney, 2005, Marrero et al., 2010), may be required for virulence to promote metabolism via the PEP-glyoxylate cycle (Munoz-Elias & McKinney, 2006). The PEP-glyoxylate cycle has been observed in E. coli during slow growth on glucose limiting medium and enables the full oxidation of carbon sources that fuel the anaplerotic node (Fischer & Sauer, 2003), such as pyruvate or acetyl-CoA. During Mtb infection, these carbon sources are physiologically relevant as they are the products of cholesterol or fatty acid catabolism. In this manner, the PEP-glyoxylate cycle may promote efficient energy producing catabolism, while keeping PEP, pyruvate, oxaloacetate and acetyl-CoA abundant and available for anabolism. Studies from others provide support for this model. For example, Beste and colleagues have shown using 13C-metabolic flux analysis that during slow growth in a chemostat or growth in macrophages Mtb exhibits anaplerotic carbon flux through pckA- and icl1-dependent pathways (Beste et al., 2013, Beste et al., 2011). Additionally, both pckA and icl1 are upregulated during two weeks of growth in macrophages (Rohde et al., 2012) and 50 days of growth in mice (Shi et al., 2010, Timm et al., 2003), demonstrating this physiology is relevant in the context of pathogenesis and may be driven by the combined influence of environmental pH and available carbon sources in animals. Together, these data support a model where acidic pH: 1) induces phoP-dependent lipid anabolism to oxidize redox cofactors and slow growth by diverting carbon from central metabolism, and 2) drives Mtb physiology to adopt the PEP-glyoxylate cycle, to balance energy production and carbon utilization (Fig. S8).
Redox homeostasis was found to play an important role in pH-driven adaptation. The reduced cytoplasmic potential observed at acidic pH (Fig. 4) may be the result of decreased oxidative phosphorylation where acidic pH restricts the efficiency of proton-pumping enzymes in the electron transport chain. In this manner, growth at acidic pH has parallels with hypoxia-driven adaptation, where oxidative phosphorylation is limited due to decreased oxygen as a terminal electron acceptor (Boshoff & Barry, 2005). However, we observed limited pH-dependent changes in the concentration of NAD+ or NADP+ (Fig. S5), demonstrating that Mtb has physiological mechanisms to regenerate oxidized co-factors. Transcriptional profiling experiments provide insights into potential mechanisms of pH-dependent redox homeostasis. Acidic pH, independent of carbon source, causes the induction of the phoPR regulon, fatty acid synthase (fas), PDIM, and whiB3 genes that would promote lipid anabolism and oxidize NADPH (Singh et al., 2009, Lee et al., 2013). Several additional genes induced at acidic pH are predicted to be associated with replenishing oxidized cofactors (Fig S8), including ahpCD (Bryk et al., 2002), NADH dehydrogenase (ndh, (Vilcheze et al., 2005)), and thioredoxin reductase (trxB, (Akif et al., 2008)). Another mechanism of redox homeostasis is the use of thiols, including mycothiol (Vilcheze et al., 2008), as reductive sinks. roGFP measures redox potential via a thiol-based mechanism providing direct evidence for increased thiol reduction at acidic pH or in the phoP mutant (Fig. 4). The mycothiol redox couple oxidizes NADPH and therefore, in combination with mechanisms considered above, may be an important redox buffer at acidic pH. These findings suggest that promoting lipid anabolism and redox cofactor oxidation at acidic pH may be important transcriptional adaptations.
Carbon source specific growth arrest in response to acidic pH appears to be a pathogenesis associated and evolved trait in Mtb, as the non-pathogen M. smegmatis does not share this physiology (Fig. S4). It is possible that, as part of pathogenesis, Mtb is integrating signals from environmental pH and available carbon sources to adapt to specific host microenvironments. Therefore, acidic pH may restrict Mtb from metabolizing specific carbon sources in vivo, and require carbon sources feeding the anaplerotic node, such as cholesterol, as a checkpoint for growth and pathogenesis. phoP, pckA and icl1 are required for virulence in animals (Marrero et al., 2010, Munoz-Elias & McKinney, 2005, McKinney et al., 2000, Perez et al., 2001), suggesting that this pH-driven response is important during pathogenesis. phoP mutants are attenuated for virulence and one demonstrated mechanism for this attenuation is decreased ESAT-6 secretion (Frigui et al., 2008). Notably, in primary human macrophages, deletion of genes required to synthesize phoPR-regulated lipids such as sulfolipid, diacyl- and polyacyltreholose (e.g. pks2, pks3 and pks4), results in a macrophage growth defect in the absence of PDIM (Passemar et al., 2013), suggesting that PDIM synthesis may compensate as a reductive sink during macrophage infection and that phoPR-regulated, pH-inducible lipids such as sulfolipid play a role in pathogenesis. It is possible that the inability of the phoP mutant to modulate redox homeostasis or metabolically constrain Mtb growth in response to acidic pH may also account, in part, for the attenuation of the phoP mutant observed in macrophages and animals (Perez et al., 2001).
Experimental Procedures
Bacterial strains and growth conditions
All Mtb experiments, unless otherwise stated, were performed with Mtb strain CDC1551. The phoP::Tn and ΔphoPR mutants have been previously described (Abramovitch et al., 2011, Tan et al., 2013). Cultures were maintained in 7H9 Middlebrook medium supplemented with 10% OADC and 0.05% Tween-80. All single carbon source experiments were performed in a defined minimal medium as described by Lee et al.(Lee et al., 2013): 1 g/L KH2PO4, 2.5 g/L Na2PO4, 0.5 g/L (NH4)2SO4, 0.15 g/L asparagine, 10 mg/L MgSO4, 50 mg/mL ferric ammonium citrate, 0.1 mg/L ZnSO4, 0.5 mg CaCl2, and 0.05% Tyloxapol. Media was buffered using 100 mM MOPS (pH 6.6-7.0) or MES (pH 5.7-6.5)(Piddington et al., 2000). Following 9 days of Mtb growth, the pH of the medium was tested and there were no significant changes to the pH, demonstrating the strong buffering is sufficient to counteract Mtb modulation of media pH. For 9-day growth experiments, Mtb was seeded in T-25 standing tissue culture flasks in 8 mL of minimal medium at an initial density of 0.05 OD600 and incubated at 37 °C and 500 μL samples were removed every three days for optical density measurements. The 36-day growth experiments were performed as described for the 9 days experiments, except that 250 μL of culture was removed for optical density measurements at each timepoint. Over the 36 day time course, pH was measured at each time point using pH strips sensitive to 0.3 pH units and no changes were observed. At the final day, the pH of the supernatants was measured using a pH meter, and only minimal (<0.2 units) changes in pH were observed (Fig S3B). 3-nitropropionic acid (3NP) was used at 0.1 mM. Growth of M. smegmatis mc2155 was performed as described for Mtb.
Cytoplasmic pH measurement
Cytoplasmic pH was measured using the pH sensitive dye CMFDA as described previously by Purdy et al. (Purdy et al., 2009). Briefly, Mtb was inoculated into its respective conditions at an original OD of 0.05. After three days, samples were collected, pelleted, and resuspended in 500 μl of the same minimal media. 4 μl of 1 μg/mL CMFDA dye was added to each sample and incubated at 37°C for 2 hours. Samples were then washed twice, resuspended at OD 1.2 in the same medium, and transferred to a 96 well microplate. A standard curve was prepared using Mtb in buffered minimal media treated with 10 μM nigericin. Fluorescent emission was measured at 520 nm after excitation at 450 nm and 490 nm.
Measuring intracellular redox poise
The plasmid pVV-16 was modified to constitutively express a redox sensitive GFP roGFP-R12(Cannon & Remington, 2006). This construct was transformed into the CDC1551 background. Mtb was cultured in the indicated media containing 10mM of the carbon source at a starting OD of 0.3. For each experimental condition, CDC1551 containing an empty vector was also cultured to use as a control for background signal subtraction. On day 3, 200 μl of each treatment was transferred in triplicate to a 96 well microplate and fluorescence emission was read at 510 nm after excitation at 400 nm and 480 nm, measuring the relative abundance of the oxidized and reduced roGFP species, respectively.
RNA-seq transcriptional profiling and data analysis
Mtb cultures were grown at 37 °C in T-75 vented, standing tissue culture flasks in 40 ml of a defined minimal medium seeded an initial OD of 0.1. Four conditions were examined with two biological replicates: 1) 10 mM Glycerol, pH 7.0, 2) 10 mM Glycerol pH 5.7, 3) 10 mM Pyruvate pH 7.0 and 4) 10 mM Pyruvate pH 5.7. Following three days incubation, total bacterial RNA was stabilized and extracted as previously described (Rohde et al., 2007). RNA quality and integrity were examined using an Agilent Bioanalyzer prior to subjecting samples to rRNA depletion using the Epicentre Ribo-Zero depletion kit. cDNA libraries were constructed using the Illumina TruSeq RNA library preparation kit (v2), omitting the polyA selection step. After library quality control, sample libraries were pooled and sequenced in one lane of an Illumina HiSeq 2500 Rapid Run flow cell (v1) in 50bp, single-end read format (SE50). After the sequencing run, reads were de-multiplexed and converted to FASTQ format using the Illumina bcl2fastq (v1.8.4) script. The reads in the raw data files were then subjected to trimming of low quality bases and removal of adapter sequences using Trimmomatic (v0.30) (Lohse et al., 2012) with a 4 bp sliding window, cutting when the read quality dropped below 15 or read length was less than 36 bp. Trimmed reads were aligned to the Mtb CDC1551 genome (NCBI accession AE000516) using Bowtie (Langmead et al., 2009) with the -S option to produce SAM files as output. SAM files produced by Bowtie were converted to BAM files and coverage depth was calculated using SAMtools (Li et al., 2009) resulting in >98% coverage across the genome with an average of 172x coverage (ranging between 110x-211x depending on the sample). Aligned reads were then counted per gene feature in the Mtb CDC1551 genome using the HTSeq software suite. Data were normalized by estimating effective library sizes using robust regression within the DESeq package (Anders & Huber, 2010). Statistical analysis and differential gene expression was performed in RStudio (V0.97.551) by fitting a negative binomial model to each set of conditions and testing for differences utilizing the DESeq package. The Magnitude-Amplitude (MA) plots were generated by modifying a function in DESeq and plotting the average expression of differentially expressed genes from each set of conditions tested against the expression ratio. For each comparison (Fig. S6A-D, supplemental tables S1-S4), differentially expressed genes were identified as genes with an average normalized count >100, differential gene expression >1.5 fold, and a p-value <0.05. Venn diagrams were generated using the Venny web tool (http://bioinfogp.cnb.csic.es/tools/venny/). Two biological replicates were performed for each sample and analysis using QualiMap (Garcia-Alcalde et al., 2012) demonstrated excellent agreement between biological replicates with a Pearson's correlation coefficient of ∼1. The transcriptional profiling data have been submitted to the NCBI GEO database (accession number: GSE52020). RNA-seq expression data for pks2, icl1, and pckA was confirmed using quantitative real-time PCR and previously described methods (Abramovitch et al., 2011). The acidic pH induction of pks2 was confirmed to be carbon source independent, and acidic pH induction of icl1 and pckA was confirmed to be enhanced in pyruvate (Fig S7C).
Analysis of mycobacterial lipids
For lipid analysis, bacterial cultures were grown as described above for the transcriptional profiling experiments. Two conditions were examined: 1) 10 mM pyruvate pH 7.0 and 2) 10 mM pyruvate pH 5.7. Following 3 days incubation, lipids were radiolabeled by adding 8 μCi of [1,2 14C] sodium acetate to each culture. The final concentration of acetate used for the labeling is 200 μM, a concentration 50 fold lower than the 10 mM pyruvate. Following 6 days of labeling, the bacteria were pelleted, washed in PBS and the lipids were extracted twice in 2:1 chloroform methanol and Folch washed. 14C incorporation was determined by scintillation counting of the total extractable lipids. To analyze lipid species, 20 000 counts per minute (CPM) of the lipid sample was spotted at the origin of 100 cm2 silica gel 60 aluminum sheets. To separate sulfolipid for quantification, the TLC was analyzed with the chloroform:methanol:water (90:10:1 v/v/v) solvent system (Asensio et al., 2006). To separate TAG for quantification, the TLC was developed with hexane:diethyl ether:acetic acid (80:20:1, v/v/v) solvent system (Abramovitch et al., 2011). To examine PDIM accumulation the TLC was developed in petroleum ether:acetone (98:2 v/v). Radiolabelled lipids were detected and quantified using a phosphor screen and a Storm Imager and ImageJ software (Schneider et al., 2012). Radiolabelling experiments, lipid extractions and TLCs were repeated in two independent biological replicates with similar findings in both replicates.
Supplementary Material
Acknowledgments
We are grateful to the Remington laboratory for providing the roGFP gene, Christopher Colvin for technical assistance, the MSU RTSF for RNA-seq library preparation and sequencing, and Kathy Meek, Martha Mulks, Kyle Rohde and members of the Abramovitch lab for critical reading of the manuscript. The High Performance Computing Cluster and iCER at Michigan State University provided computational support and resources. This research was supported by start-up funding from Michigan State University, AgBioResearch and a Career Development Grant from the Great Lakes Regional Center of Excellence (National Institute of Allergy and Infectious Disease Award U54 AI057153).
References
- Abramovitch RB, Rohde KH, Hsu FF, Russell DG. aprABC: a Mycobacterium tuberculosis complex-specific locus that modulates pH-driven adaptation to the macrophage phagosome. Mol Microbiol. 2011;80:678–694. doi: 10.1111/j.1365-2958.2011.07601.x. [DOI] [PMC free article] [PubMed] [Google Scholar]
- Akif M, Khare G, Tyagi AK, Mande SC, Sardesai AA. Functional studies of multiple thioredoxins from Mycobacterium tuberculosis. J Bacteriol. 2008;190:7087–7095. doi: 10.1128/JB.00159-08. [DOI] [PMC free article] [PubMed] [Google Scholar]
- Anders S, Huber W. Differential expression analysis for sequence count data. Genome Biol. 2010;11:R106. doi: 10.1186/gb-2010-11-10-r106. [DOI] [PMC free article] [PubMed] [Google Scholar]
- Asensio JG, Maia C, Ferrer NL, Barilone N, Laval F, Soto CY, Winter N, Daffe M, Gicquel B, Martin C, Jackson M. The virulence-associated two component PhoP-PhoR system controls the biosynthesis of polyketide-derived lipids in Mycobacterium tuberculosis. J Biol Chem. 2006;281:1313–1316. doi: 10.1074/jbc.C500388200. [DOI] [PubMed] [Google Scholar]
- Baek SH, Li AH, Sassetti CM. Metabolic regulation of mycobacterial growth and antibiotic sensitivity. PLoS Biol. 2011;9:e1001065. doi: 10.1371/journal.pbio.1001065. [DOI] [PMC free article] [PubMed] [Google Scholar]
- Beste DJ, Noh K, Niedenfuhr S, Mendum TA, Hawkins ND, Ward JL, Beale MH, Wiechert W, McFadden J. (13)C-Flux Spectral Analysis of Host-Pathogen Metabolism Reveals a Mixed Diet for Intracellular Mycobacterium tuberculosis. Chem Biol. 2013;20:1012–1021. doi: 10.1016/j.chembiol.2013.06.012. [DOI] [PMC free article] [PubMed] [Google Scholar]
- Beste DJV, Bonde B, Hawkins N, Ward JL, Beale MH, Noack S, Noh K, Kruger NJ, Ratcliffe RG, McFadden J. C-13 Metabolic Flux Analysis Identifies an Unusual Route for Pyruvate Dissimilation in Mycobacteria which Requires Isocitrate Lyase and Carbon Dioxide Fixation. Plos Pathog. 2011;7 doi: 10.1371/journal.ppat.1002091. [DOI] [PMC free article] [PubMed] [Google Scholar]
- Bhaskar A, Chawla M, Mehta M, Parikh P, Chandra P, Bhave D, Kumar D, Carroll KS, Singh A. Reengineering redox sensitive GFP to measure mycothiol redox potential of Mycobacterium tuberculosis during infection. PLoS Pathog. 2014;10:e1003902. doi: 10.1371/journal.ppat.1003902. [DOI] [PMC free article] [PubMed] [Google Scholar]
- Boshoff HI, Barry CE., 3rd Tuberculosis - metabolism and respiration in the absence of growth. Nat Rev Microbiol. 2005;3:70–80. doi: 10.1038/nrmicro1065. [DOI] [PubMed] [Google Scholar]
- Bryk R, Lima CD, Erdjument-Bromage H, Tempst P, Nathan C. Metabolic enzymes of mycobacteria linked to antioxidant defense by a thioredoxin-like protein. Science. 2002;295:1073–1077. doi: 10.1126/science.1067798. [DOI] [PubMed] [Google Scholar]
- Cannon MB, Remington SJ. Re-engineering redox-sensitive green fluorescent protein for improved response rate. Protein science : a publication of the Protein Society. 2006;15:45–57. doi: 10.1110/ps.051734306. [DOI] [PMC free article] [PubMed] [Google Scholar]
- Chang JC, Miner MD, Pandey AK, Gill WP, Harik NS, Sassetti CM, Sherman DR. igr Genes and Mycobacterium tuberculosis Cholesterol Metabolism. J Bacteriol. 2009;191:5232–5239. doi: 10.1128/JB.00452-09. [DOI] [PMC free article] [PubMed] [Google Scholar]
- Dannenberg AM. Pathogenesis of Human Pulmonary Tuberculosis: Insights from the Rabbit Model. Pathogenesis of Human Pulmonary Tuberculosis: Insights from the Rabbit Model. 2006:1–453. [Google Scholar]
- Eoh H, Rhee KY. Methylcitrate cycle defines the bactericidal essentiality of isocitrate lyase for survival of Mycobacterium tuberculosis on fatty acids. Proc Natl Acad Sci U S A. 2014;111:4976–4981. doi: 10.1073/pnas.1400390111. [DOI] [PMC free article] [PubMed] [Google Scholar]
- Farhana A, Guidry L, Srivastava A, Singh A, Hondalus MK, Steyn AJC. Reductive Stress in Microbes: Implications for Understanding Mycobacterium tuberculosis Disease and Persistence. Adv Microb Physiol. 2010;57:43–117. doi: 10.1016/B978-0-12-381045-8.00002-3. [DOI] [PubMed] [Google Scholar]
- Fischer E, Sauer U. A novel metabolic cycle catalyzes glucose oxidation and anaplerosis in hungry Escherichia coli. J Biol Chem. 2003;278:46446–46451. doi: 10.1074/jbc.M307968200. [DOI] [PubMed] [Google Scholar]
- Fisher MA, Plikaytis BB, Shinnick TM. Microarray analysis of the Mycobacterium tuberculosis transcriptional response to the acidic conditions found in phagosomes. J Bacteriol. 2002;184:4025–4032. doi: 10.1128/JB.184.14.4025-4032.2002. [DOI] [PMC free article] [PubMed] [Google Scholar]
- Frigui W, Bottai D, Majlessi L, Monot M, Josselin E, Brodin P, Garnier T, Gicquel B, Martin C, Leclerc C, Cole ST, Brosch R. Control of M. tuberculosis ESAT-6 secretion and specific T cell recognition by PhoP. PLoS Pathog. 2008;4:e33. doi: 10.1371/journal.ppat.0040033. [DOI] [PMC free article] [PubMed] [Google Scholar]
- Galagan JE, Minch K, Peterson M, Lyubetskaya A, Azizi E, Sweet L, Gomes A, Rustad T, Dolganov G, Glotova I, Abeel T, Mahwinney C, Kennedy AD, Allard R, Brabant W, Krueger A, Jaini S, Honda B, Yu WH, Hickey MJ, Zucker J, Garay C, Weiner B, Sisk P, Stolte C, Winkler JK, Van de Peer Y, Iazzetti P, Camacho D, Dreyfuss J, Liu Y, Dorhoi A, Mollenkopf HJ, Drogaris P, Lamontagne J, Zhou Y, Piquenot J, Park ST, Raman S, Kaufmann SH, Mohney RP, Chelsky D, Moody DB, Sherman DR, Schoolnik GK. The Mycobacterium tuberculosis regulatory network and hypoxia. Nature. 2013;499:178–183. doi: 10.1038/nature12337. [DOI] [PMC free article] [PubMed] [Google Scholar]
- Garcia-Alcalde F, Okonechnikov K, Carbonell J, Cruz LM, Gotz S, Tarazona S, Dopazo J, Meyer TF, Conesa A. Qualimap: evaluating next-generation sequencing alignment data. Bioinformatics. 2012;28:2678–2679. doi: 10.1093/bioinformatics/bts503. [DOI] [PubMed] [Google Scholar]
- Gill WP, Harik NS, Whiddon MR, Liao RP, Mittler JE, Sherman DR. A replication clock for Mycobacterium tuberculosis. Nat Med. 2009;15:211–214. doi: 10.1038/nm.1915. [DOI] [PMC free article] [PubMed] [Google Scholar]
- Gonzalo-Asensio J, Mostowy S, Harders-Westerveen J, Huygen K, Hernandez-Pando R, Thole J, Behr M, Gicquel B, Martin C. PhoP: A Missing Piece in the Intricate Puzzle of Mycobacterium tuberculosis Virulence. Plos One. 2008;3:e3496. doi: 10.1371/journal.pone.0003496. [DOI] [PMC free article] [PubMed] [Google Scholar]
- Hanson GT, Aggeler R, Oglesbee D, Cannon M, Capaldi RA, Tsien RY, Remington SJ. Investigating mitochondrial redox potential with redox-sensitive green fluorescent protein indicators. J Biol Chem. 2004;279:13044–13053. doi: 10.1074/jbc.M312846200. [DOI] [PubMed] [Google Scholar]
- Homolka S, Niemann S, Russell DG, Rohde KH. Functional genetic diversity among Mycobacterium tuberculosis complex clinical isolates: delineation of conserved core and lineage-specific transcriptomes during intracellular survival. PLoS Pathog. 2010;6:e1000988. doi: 10.1371/journal.ppat.1000988. [DOI] [PMC free article] [PubMed] [Google Scholar]
- Jain M, Petzold CJ, Schelle MW, Leavell MD, Mougous JD, Bertozzi CR, Leary JA, Cox JS. Lipidomics reveals control of Mycobacterium tuberculosis virulence lipids via metabolic coupling. Proc Natl Acad Sci U S A. 2007;104:5133–5138. doi: 10.1073/pnas.0610634104. [DOI] [PMC free article] [PubMed] [Google Scholar]
- Kim MJ, Wainwright HC, Locketz M, Bekker LG, Walther GB, Dittrich C, Visser A, Wang W, Hsu FF, Wiehart U, Tsenova L, Kaplan G, Russell DG. Caseation of human tuberculosis granulomas correlates with elevated host lipid metabolism. EMBO molecular medicine. 2010;2:258–274. doi: 10.1002/emmm.201000079. [DOI] [PMC free article] [PubMed] [Google Scholar]
- Langmead B, Trapnell C, Pop M, Salzberg SL. Ultrafast and memory-efficient alignment of short DNA sequences to the human genome. Genome Biol. 2009;10:R25. doi: 10.1186/gb-2009-10-3-r25. [DOI] [PMC free article] [PubMed] [Google Scholar]
- Lee W, Vanderven BC, Fahey RJ, Russell DG. Intracellular Mycobacterium tuberculosis exploits host-derived fatty acids to limit metabolic stress. J Biol Chem. 2013 doi: 10.1074/jbc.M112.445056. [DOI] [PMC free article] [PubMed] [Google Scholar]
- Li H, Handsaker B, Wysoker A, Fennell T, Ruan J, Homer N, Marth G, Abecasis G, Durbin R. The Sequence Alignment/Map format and SAMtools. Bioinformatics. 2009;25:2078–2079. doi: 10.1093/bioinformatics/btp352. [DOI] [PMC free article] [PubMed] [Google Scholar]
- Lohse M, Bolger AM, Nagel A, Fernie AR, Lunn JE, Stitt M, Usadel B. RobiNA: a user-friendly, integrated software solution for RNA-Seq-based transcriptomics. Nucleic Acids Res. 2012;40:W622–627. doi: 10.1093/nar/gks540. [DOI] [PMC free article] [PubMed] [Google Scholar]
- Marrero J, Rhee KY, Schnappinger D, Pethe K, Ehrt S. Gluconeogenic carbon flow of tricarboxylic acid cycle intermediates is critical for Mycobacterium tuberculosis to establish and maintain infection. P Natl Acad Sci USA. 2010;107:9819–9824. doi: 10.1073/pnas.1000715107. [DOI] [PMC free article] [PubMed] [Google Scholar]
- Martin C, Williams A, Hernandez-Pando R, Cardona PJ, Gormley E, Bordat Y, Soto CY, Clark SO, Hatch GJ, Aguilar D, Ausina V, Gicquel B. The live Mycobacterium tuberculosis phoP mutant strain is more attenuated than BCG and confers protective immunity against tuberculosis in mice and guinea pigs. Vaccine. 2006;24:3408–3419. doi: 10.1016/j.vaccine.2006.03.017. [DOI] [PubMed] [Google Scholar]
- McKinney JD, Honer zu Bentrup K, Munoz-Elias EJ, Miczak A, Chen B, Chan WT, Swenson D, Sacchettini JC, Jacobs WR, Jr, Russell DG. Persistence of Mycobacterium tuberculosis in macrophages and mice requires the glyoxylate shunt enzyme isocitrate lyase. Nature. 2000;406:735–738. doi: 10.1038/35021074. [DOI] [PubMed] [Google Scholar]
- Munoz-Elias EJ, McKinney JD. Mycobacterium tuberculosis isocitrate lyases 1 and 2 are jointly required for in vivo growth and virulence. Nat Med. 2005;11:638–644. doi: 10.1038/nm1252. [DOI] [PMC free article] [PubMed] [Google Scholar]
- Munoz-Elias EJ, McKinney JD. Carbon metabolism of intracellular bacteria. Cell Microbiol. 2006;8:10–22. doi: 10.1111/j.1462-5822.2005.00648.x. [DOI] [PubMed] [Google Scholar]
- Munoz-Elias EJ, Timm J, Botha T, Chan WT, Gomez JE, McKinney JD. Replication dynamics of Mycobacterium tuberculosis in chronically infected mice. Infect Immun. 2005;73:546–551. doi: 10.1128/IAI.73.1.546-551.2005. [DOI] [PMC free article] [PubMed] [Google Scholar]
- Pandey AK, Sassetti CM. Mycobacterial persistence requires the utilization of host cholesterol. Proc Natl Acad Sci U S A. 2008;105:4376–4380. doi: 10.1073/pnas.0711159105. [DOI] [PMC free article] [PubMed] [Google Scholar]
- Passemar C, Arbues A, Malaga W, Mercier I, Moreau F, Lepourry L, Neyrolles O, Guilhot C, Astarie-Dequeker C. Multiple deletions in the polyketide synthase gene repertoire of Mycobacterium tuberculosis reveal functional overlap of cell envelope lipids in host-pathogen interactions. Cell Microbiol. 2013 doi: 10.1111/cmi.12214. [DOI] [PubMed] [Google Scholar]
- Perez E, Samper S, Bordas Y, Guilhot C, Gicquel B, Martin C. An essential role for phoP in Mycobacterium tuberculosis virulence. Mol Microbiol. 2001;41:179–187. doi: 10.1046/j.1365-2958.2001.02500.x. [DOI] [PubMed] [Google Scholar]
- Piddington DL, Kashkouli A, Buchmeier NA. Growth of Mycobacterium tuberculosis in a defined medium is very restricted by acid pH and Mg2+ levels. Infect Immun. 2000;68:4518–4522. doi: 10.1128/iai.68.8.4518-4522.2000. [DOI] [PMC free article] [PubMed] [Google Scholar]
- Purdy GE, Niederweis M, Russell DG. Decreased outer membrane permeability protects mycobacteria from killing by ubiquitin-derived peptides. Mol Microbiol. 2009;73:844–857. doi: 10.1111/j.1365-2958.2009.06801.x. [DOI] [PMC free article] [PubMed] [Google Scholar]
- Rohde KH, Abramovitch RB, Russell DG. Mycobacterium tuberculosis invasion of macrophages: linking bacterial gene expression to environmental cues. Cell Host Microbe. 2007;2:352–364. doi: 10.1016/j.chom.2007.09.006. [DOI] [PubMed] [Google Scholar]
- Rohde KH, Veiga DF, Caldwell S, Balazsi G, Russell DG. Linking the transcriptional profiles and the physiological states of Mycobacterium tuberculosis during an extended intracellular infection. PLoS Pathog. 2012;8:e1002769. doi: 10.1371/journal.ppat.1002769. [DOI] [PMC free article] [PubMed] [Google Scholar]
- Russell DG, Cardona PJ, Kim MJ, Allain S, Altare F. Foamy macrophages and the progression of the human tuberculosis granuloma. Nat Immunol. 2009;10:943–948. doi: 10.1038/ni.1781. [DOI] [PMC free article] [PubMed] [Google Scholar]
- Sauer U, Eikmanns BJ. The PEP-pyruvate-oxaloacetate node as the switch point for carbon flux distribution in bacteria. FEMS microbiology reviews. 2005;29:765–794. doi: 10.1016/j.femsre.2004.11.002. [DOI] [PubMed] [Google Scholar]
- Savvi S, Warner DF, Kana BD, McKinney JD, Mizrahi V, Dawes SS. Functional characterization of a vitamin B-12-dependent methylmalonyl pathway in Mycobacterium tuberculosis: Implications for propionate metabolism during growth on fatty acids. J Bacteriol. 2008;190:3886–3895. doi: 10.1128/JB.01767-07. [DOI] [PMC free article] [PubMed] [Google Scholar]
- Schneider CA, Rasband WS, Eliceiri KW. NIH Image to ImageJ: 25 years of image analysis. Nature methods. 2012;9:671–675. doi: 10.1038/nmeth.2089. [DOI] [PMC free article] [PubMed] [Google Scholar]
- Shi L, Sohaskey CD, Pfeiffer C, Datta P, Parks M, McFadden J, North RJ, Gennaro ML. Carbon flux rerouting during Mycobacterium tuberculosis growth arrest. Mol Microbiol. 2010;78:1199–1215. doi: 10.1111/j.1365-2958.2010.07399.x. [DOI] [PMC free article] [PubMed] [Google Scholar]
- Singh A, Crossman DK, Mai D, Guidry L, Voskuil MI, Renfrow MB, Steyn AJC. Mycobacterium tuberculosis WhiB3 Maintains Redox Homeostasis by Regulating Virulence Lipid Anabolism to Modulate Macrophage Response. Plos Pathog. 2009;5:e1000545. doi: 10.1371/journal.ppat.1000545. [DOI] [PMC free article] [PubMed] [Google Scholar]
- Sirakova TD, Thirumala AK, Dubey VS, Sprecher H, Kolattukudy PE. The Mycobacterium tuberculosis pks2 gene encodes the synthase for the hepta- and octamethyl-branched fatty acids required for sulfolipid synthesis. J Biol Chem. 2001;276:16833–16839. doi: 10.1074/jbc.M011468200. [DOI] [PubMed] [Google Scholar]
- Tan S, Sukumar N, Abramovitch RB, Parish T, Russell DG. Mycobacterium tuberculosis Responds to Chloride and pH as Synergistic Cues to the Immune Status of its Host Cell. PLoS Pathog. 2013;9:e1003282. doi: 10.1371/journal.ppat.1003282. [DOI] [PMC free article] [PubMed] [Google Scholar]
- Tian J, Bryk R, Itoh M, Suematsu M, Nathan C. Variant tricarboxylic acid cycle in Mycobacterium tuberculosis: identification of alpha-ketoglutarate decarboxylase. Proc Natl Acad Sci U S A. 2005;102:10670–10675. doi: 10.1073/pnas.0501605102. [DOI] [PMC free article] [PubMed] [Google Scholar]
- Timm J, Post FA, Bekker LG, Walther GB, Wainwright HC, Manganelli R, Chan WT, Tsenova L, Gold B, Smith I, Kaplan G, McKinney JD. Differential expression of iron-, carbon-, and oxygen-responsive mycobacterial genes in the lungs of chronically infected mice and tuberculosis patients. P Natl Acad Sci USA. 2003;100:14321–14326. doi: 10.1073/pnas.2436197100. [DOI] [PMC free article] [PubMed] [Google Scholar]
- Upton AM, McKinney JD. Role of the methylcitrate cycle in propionate metabolism and detoxification in Mycobacterium smegmatis. Microbiology. 2007;153:3973–3982. doi: 10.1099/mic.0.2007/011726-0. [DOI] [PubMed] [Google Scholar]
- Van der Geize R, Yam K, Heuser T, Wilbrink MH, Hara H, Anderton MC, Sim E, Dijkhuizen L, Davies JE, Mohn WW, Eltis LD. A gene cluster encoding cholesterol catabolism in a soil actinomycete provides insight into Mycobacterium tuberculosis survival in macrophages. Proc Natl Acad Sci U S A. 2007;104:1947–1952. doi: 10.1073/pnas.0605728104. [DOI] [PMC free article] [PubMed] [Google Scholar]
- Vandal OH, Nathan CF, Ehrt S. Acid Resistance in Mycobacterium tuberculosis. J Bacteriol. 2009a;191:4714–4721. doi: 10.1128/JB.00305-09. [DOI] [PMC free article] [PubMed] [Google Scholar]
- Vandal OH, Pierini LM, Schnappinger D, Nathan CF, Ehrt S. A membrane protein preserves intrabacterial pH in intraphagosomal Mycobacterium tuberculosis. Nat Med. 2008;14:849–854. doi: 10.1038/nmXXXX. [DOI] [PMC free article] [PubMed] [Google Scholar]
- Vandal OH, Roberts JA, Odaira T, Schnappinger D, Nathan CF, Ehrt S. Acid-Susceptible Mutants of Mycobacterium tuberculosis Share Hypersusceptibility to Cell Wall and Oxidative Stress and to the Host Environment. J Bacteriol. 2009b;191:625–631. doi: 10.1128/JB.00932-08. [DOI] [PMC free article] [PubMed] [Google Scholar]
- Vilcheze C, Av-Gay Y, Attarian R, Liu Z, Hazbon MH, Colangeli R, Chen B, Liu W, Alland D, Sacchettini JC, Jacobs WR., Jr Mycothiol biosynthesis is essential for ethionamide susceptibility in Mycobacterium tuberculosis. Mol Microbiol. 2008;69:1316–1329. doi: 10.1111/j.1365-2958.2008.06365.x. [DOI] [PMC free article] [PubMed] [Google Scholar]
- Vilcheze C, Weisbrod TR, Chen B, Kremer L, Hazbon MH, Wang F, Alland D, Sacchettini JC, Jacobs WR., Jr Altered NADH/NAD+ ratio mediates coresistance to isoniazid and ethionamide in mycobacteria. Antimicrob Agents Chemother. 2005;49:708–720. doi: 10.1128/AAC.49.2.708-720.2005. [DOI] [PMC free article] [PubMed] [Google Scholar]
- Walters SB, Dubnau E, Kolesnikova I, Laval F, Daffe M, Smith I. The Mycobacterium tuberculosis PhoPR two-component system regulates genes essential for virulence and complex lipid biosynthesis. Mol Microbiol. 2006;60:312–330. doi: 10.1111/j.1365-2958.2006.05102.x. [DOI] [PubMed] [Google Scholar]
Associated Data
This section collects any data citations, data availability statements, or supplementary materials included in this article.