Abstract
Our previous imaging research performed as part of a Urea Cycle Rare Disorders Consortium (UCRDC) grant, has identified specific biomarkers of neurologic injury in ornithine transcarbamylase deficiency, OTCD. While characterization of mutations can be achieved in most cases, this information does not necessarily predict the severity of the underlying neurological syndrome. The biochemical consequences of any mutation may be modified additionally by a large number of factors, including contributions of other enzymes and transport systems that mediate flux through the urea cycle, diet and other environmental factors. These factors likely vary from one patient to another, and they give rise to heterogeneity of clinical severity. Affected cognitive domains include non-verbal learning, fine motor processing, reaction time, visual memory, attention, and executive function. Deficits in these capacities may be seen in symptomatic patients, as well as asymptomatic carriers with normal IQ and correlate with variances in brain structure and function in these patients. Using neuroimaging we can identify biomarkers that reflect the downstream impact of UCDs on cognition. This manuscript is a summary of the presentation from the 4th International Consortium on Urea cycle disorders held in, Barcelona, Spain, September 2, 2014.
Keywords: ammonia, cognitive, diffusion tensor imaging, FLAIR imaging, glutamine, magnetic resonance imaging, magnetic resonance spectroscopy, myoinositol, neuroimaging
1. Introduction
The urea cycle disorders cause damage to the brain due to repeated exposure to toxic intermediates of metabolism. Although the exact mechanism may not be elucidated, the cognitive consequences of this are significant [1, 2]. Because of the frequency of brain damage due to hyperammonemia in this condition, noninvasive measures to assess neurological function must be developed because peripheral markers of metabolism (plasma ammonia and glutamine levels) cannot serve as surrogate markers due to the effects of ammonia on the blood brain barrier. Surrogate brain markers which can be used clinically to predict severity of insult and potential treatment response will have impact on management decisions and serve as an impetus to development of neuroprotective strategies that can be used within a critical time window. Currently, the time course leading to brain biochemical changes after protein load in OTCD and related urea cycle disorders is not known and has not been investigated beyond a few clinical cases in the hepatic encephalopathy literature [3].
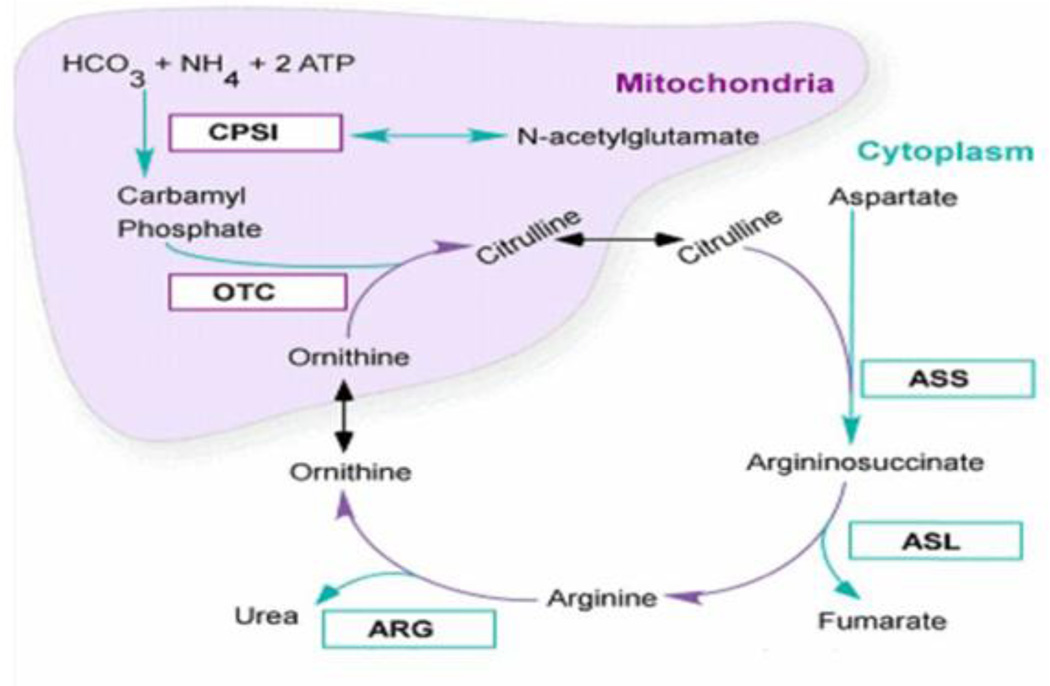
For the proximal UCDs (Figure 1), hyperammonemia (HA) is involved in a downstream cascade of damage that ultimately leads to severe neurocognitive sequelae. HA is due to inability to scavenge nitrogen derived from protein breakdown in the diet, and may result from either inherited metabolic disorders (UCD) or sub-acute chronic hepatic encephalopathy (SCHE) [4–6]. In both conditions, HA results in dysfunction to the central nervous system (CNS). While the exact pathophysiology remains unclear, current theories have focused on: 1) glutamine accumulation, with associated impaired cerebral osmoregulation, and 2) glutamate/NMDA receptor activation, with resultant excitotoxic injury and energy deficit [7]. Neuropathological changes in UCD are similar to those in hepatic encephalopathy and hypoxic ischemic encephalopathy. The white matter is preferentially affected in proximal UCD, and the extent of injury has been shown to depend upon the duration of HA coma and the interval between coma and death [8].
Figure 1.
The urea cycle. Reprinted with permission from Urea cycle rare disorders consortium materials. Abbreviations: CPS1: Carbamoyl phosphate synthetase 1; OTC: ornithine transcarbamylase deficiency; ASS: arginosuccinate synthase; ASL: arginosuccinate lyase; ARG: arginase.
There are currently no specific treatments to protect the brain from the effects of HA proactively, but this is a focus of the UCDC [9–11]. The use of nitrogen scavengers has resulted in improved survival rates in these patients, but neurological outcome remains poor in some cases, especially in neonatal onset cases [12]. Our consortium has previously shown that half of the infants who present with hyperammonemic coma in the newborn period die of cerebral edema; and those who survive three days or more of coma, ultimately will have intellectual disability [13–15]. Noninvasive, repeatable and quantitative studies documenting these changes are not universally available in patients with UCD. Noninvasive biomarkers that allow study of pathogenesis of brain injury and demonstrate changes that are associated with and may allow prediction of patient neurocognitive outcome are necessary to optimize individual treatment and address neuroprotection. The use of multiplatform neuroimaging to achieve this gap has been the focus of the Urea cycle rare disorders consortium and this goes beyond routine neuroimaging that is available in most centers. For the past seven years our UCDC has researched the development of noninvasive biomarkers to monitor early signs of injury and recovery which are needed to understand the time course of damage and provided information regarding critical time periods for intervention. The results of this research will be discussed as well as future directions and needs in the field.
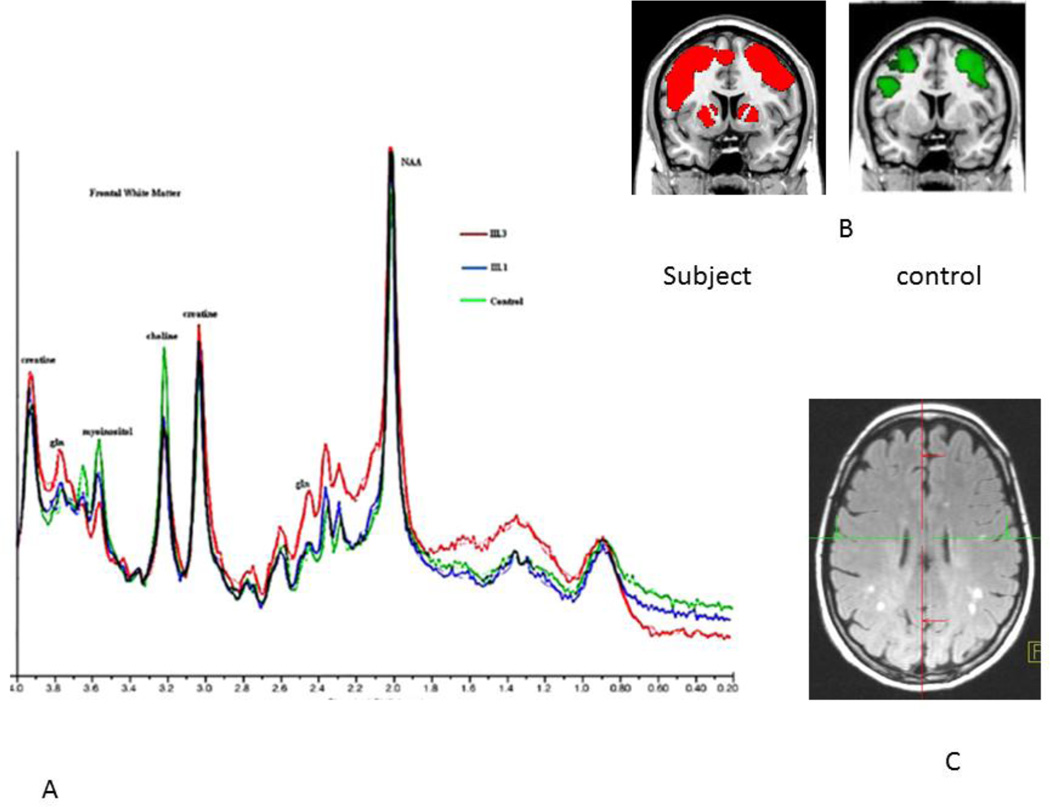
We have established a Urea Cycle Rare disorders Consortium to study outcomes in patients with the UCDs. This consortium is comprised of multiple centers across the country and world, each comprised of a team of experts with complementary expertise in metabolism, neurology, imaging, and neuropsychology. As a result of this collaborative effort, we able to image the largest cohort of UCD subjects to date. Currently, there are 698 patients with all UCDs enrolled in a natural history study and of those eligible subjects. We focused our imaging studies on OTCD, the only X-linked UCD, and the most common of the UCDs. We have recruited and imaged a total of 44 subjects with OTCD, one with arginase deficiency, and we have not imaged other UCDs, this is planned in our subsequent research cycle. We have presented this data elsewhere. In summary, our imaging studies provided evidence that alterations of brain biochemistry, white matter integrity, and cognitive function occur even in patients with late onset (partial) OTCD [16] who appear grossly intact neurologically and by conventional MRI (Figure 2). This is a significant as most patients with partial OTCD are not treated with nitrogen scavenging or dietary protein restriction and treatment decisions in this population may require reappraisal and revision. We believe this research has new and significant knowledge in this field and will address and advance the need for brain surrogate endpoints for clinical decision making and drug studies. This manuscript reflects the content of a talk given at the 4th International Consortium on Urea cycle disorders held in, Barcelona, Spain, September 2, 2014 and summarizes previously published data and plans for future investigations. Included are new examples where the use of noninvasive imaging led to changes in clinical management in two research subjects who had subclinical symptoms of HA .
Figure 2.
This composite shows changes observed in subjects with OTCD. In panel A, spectroscopy demonstrating overlapping spectra in three subjects. In Red, an affected female, in blue, her carrier sister who is unaffected, and in green an age matched control. Glutamine is elevated in the symptomatic subject, intermediate in the carrier, asymptomatic and normal in the control. Likewise, choline is decreased equally in both sisters. For myoinositol, the concentration follows the clinical symptoms, normal in the control, intermediate in the asymptomatic carrier, and low in the affected patient. In panel B, activation map from fMRI working memory task shows increased frontal and basal ganglia activation in subjects but not controls and in panel C, discrete areas of T2 signal seen on FLAIR seen with increased frequency in OTCD patients versus age matched controls. Reprinted with permission from Mol Genet Metab. 2008; 94(1): 52–60.
2. What is the background of neuroimaging in UCDs?
The majority of early studies that contributed to the field of neuroimaging in UCDs involved small case series using clinical CAT scan and magnetic resonance imaging (CT/MRI). Many of those patients undergoing neuroimaging (mainly with CT scan) were survivors of prolonged hyperammonemic coma. Structural MRI was notable for ventriculomegaly and cortical atrophy, which was the result of neonatal onset disease, high ammonia levels and prolonged intoxication [17]. The very earliest use of Magnetic resonance spectroscopy (MRS) which can measure brain biochemistry showed that elevated glutamine contributed to the acute encephalopathy, with high levels reported in these infants [17]. However, in those individuals with onset after the newborn period, and with development of imaging modalities with improved resolution and scope, it became apparent that those patients presenting later had MRI scans, not demonstrating the devastating findings of the neonatal disease, but rather showing bilateral, low density white matter lesions, some of which were found to be reversible with treatment. In later studies using 1H MRS in patients with late onset OTCD, a triad of findings similar to those that had been previously reported in HE was observed namely, decreased myoinositol, increased Glx (glutamine/glutamate), decreased choline [18].
2.1. HA: mechanisms of brain edema
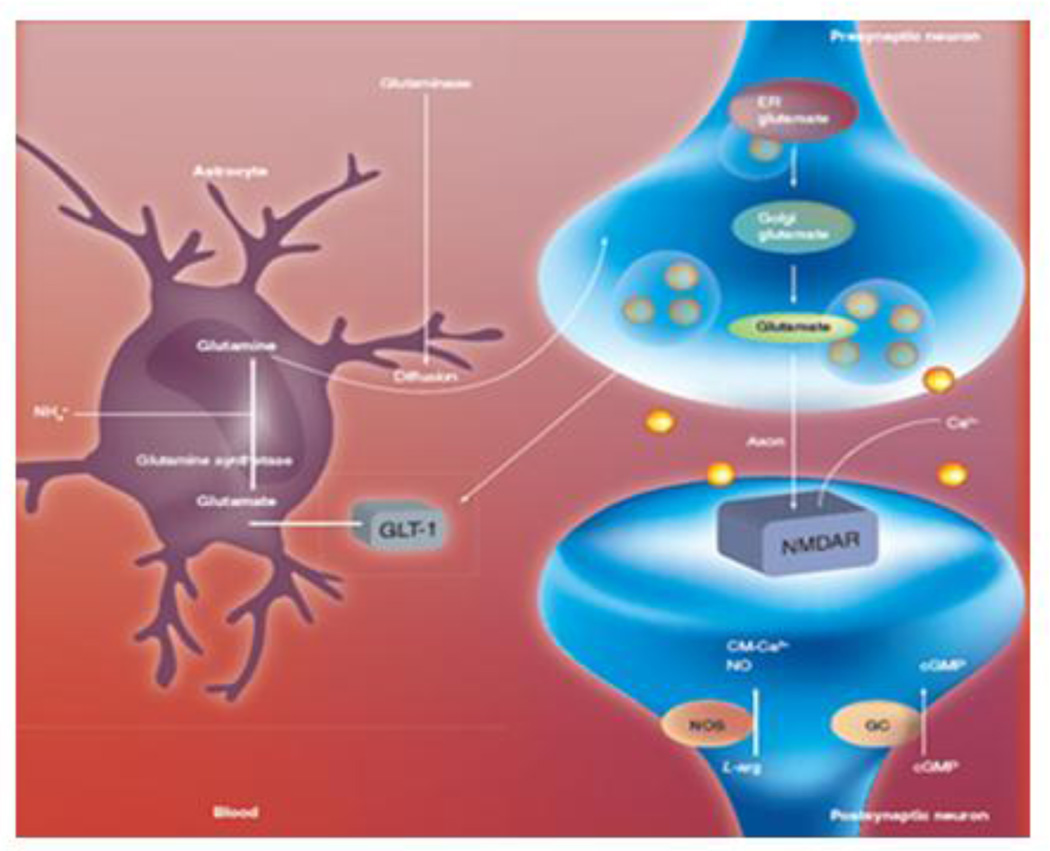
Glutamine has been proposed to be an osmolyte in the brain. It is generally believed that ammonia plays a key role in the process of brain edema, although the mechanism by which ammonia brings about such swelling is yet to be defined. It has been postulated that glutamine accumulation in astrocytes subsequent to ammonia detoxification leads to increased osmotic forces accounting for cell swelling. While the hypothesis is plausible and has gained support, it has never been critically tested. Ammonia is able to diffuse freely across the blood–brain barrier into the brain in amounts proportional to the arterial blood concentration and blood flow and as a result metabolic trapping can occur with the concentration in the brain tending to be higher than in peripheral blood [5, 6]. Ammonia in the bloodstream rapidly enters the brain and almost all is quickly converted to glutamine, which can offer only short-term buffering of excess ammonia. This occurs in the astrocyte via glutamine synthetase (GS). ]. While glutamine may not be acting as an osmolyte, studies in cell culture models suggest that glutamine-mediated oxidative stress and/or the MPT may be responsible for the astrocyte swelling by ammonia [19]. Studies in which the GS inhibitor methionine sulfoximine is administered demonstrate reduced ammonia-induced brain edema in both in vivo [20–22]. The astrocyte, therefore, is an important intermediate in the interactions of glutamine and ammonia via the glutamate–glutamine cycle (Figure 3).
Figure 3.
the glutamine-glutamate cycle. Reprinted with permission from Pediatric Health, 2008, 2 (6):701–713.
This osmotic disruption has been well studied in hepatic encephalopathy [23]. The speed with which osmotic disruption occurs and its duration will determine the clinical outcome to a large part. The astrocyte is the cell in the brain that is sensitive and altered in response to this osmolar disruption.
2.2. Previous work in brain edema in HA
Previous work to elucidate molecular mechanisms of edema after HA has identified altered expression of genes that play a role in development of brain edema such as water channel proteins. These include NO, Na-K-Cl co-transporter-1, K-Cl co-transporters, Kir4.1 channels, and AQP-4. AQP4 and AQP9 have been reported to involve in the brain water accumulation in the brain edema [24]. Studies of transgenic mouse and brain injury models reveal that AQP4 may play a role not in the edema formation, but in the fluid elimination.
Because the downstream effects of HA and related processes will impact neurocognition, our neuroimaging study entails validation of biomarkers of brain dysfunction in OTCD studied by neuroimaging. We are very interested in following the pathology by using imaging that captures important information about alterations in biochemistry, white matter injury and functional connectivity. We hope to learn more about the timing and recovery from injury and to use stable biomarkers to eventually assess drug effect.
3. Imaging tools
Neuroimaging is a powerful diagnostic and research tool that can provide information about the timing, extent, reversibility and possible mechanism of neural injury in a noninvasive manner. Magnetic resonance imaging (MRI) is well established as a primary technique allowing for anatomical and structural imaging that may assist in diagnosis, longitudinal assessment, treatment and patient management. However, several newer imaging modalities have shown promise in contributing to the knowledge of brain function, injury and recovery in metabolic disorders and are starting to be used in patients with UCDs. In addition, various modalities can be combined to provide complementary information. Some of the tools available to assess the effects of metabolic disorders on the brain include functional MRI (fMRI), which can assess the integrity of neural networks, diffusion tensor imaging (DTI), which measures microscopic white matter integrity, and magnetic resonance spectroscopy (MRS), which provides biochemical information and allows a noninvasive measure of brain metabolism under different conditions (steady state, dynamic conditions) [25].
3.1. Magnetic resonance imaging (MRI)
MRI is a technique based on interrogation of tissue water protons through differential populations of proton spins that result when a sample is placed in a large magnetic field. From an anatomic standpoint one can characterize gray matter and white matter microstructural and macro-structural changes which are read as signal abnormalities on T1 and T2 weighted images which correspond with tissue pathologies. With MRI one can detect damage at macroscopic level. MRI findings may lag behind clinical changes-disease as well as recovery.
3.2. Fluid-attenuated inversion recovery (FLAIR)
Fluid-attenuated inversion recovery (FLAIR) imaging is a technique that increases the sensitivity of magnetic resonance imaging to detect central nervous system (CNS) diseases characterized by an increase in interstitial water content such as brain tumors, Multiple sclerosis, cerebral infarcts, gliotic scars and metabolic white matter diseases.
3.3. Diffusion weighted imaging (DWI) and Diffusion tensor imaging (DTI)
Diffusion MRI is a magnetic resonance imaging (MRI) method allowing the mapping of the diffusion process of molecules, mainly water, in biological tissues, in vivo non-invasively. Molecular diffusion in tissues is not free, and is impacted by obstacles, such as macromolecules, fibers, and cell membranes. Water molecule diffusion patterns can therefore reveal microscopic details about the integrity tissue architecture in the normal and diseased brain.
DTI relates image intensities to the relative mobility of water molecules in tissue and the direction of the motion [26]. Motion of water molecules is a random walk (Brownian motion) Areas with relatively high mean diffusion will appear dark on the diffusion weighted MRI images Because the cellular diffusion of water corresponds to cell geometry in axons, diffusion MRI can also be used to make inferences about white matter architecture. Cytotoxic edema appears following sodium/potassium pump failure, which results from energy metabolism failure due to ischemic insult. This occurs within minutes of the onset of ischemia and produces an increase in brain tissue water of up to 3–5%. Reduction in intracellular and extracellular water molecule movement is the presumed explanation for the drop in ADC values. Water allows one to image the integrity of the brain structures against which it diffuses. High spatial resolution allows the identification and quantification of micro-structural abnormalities in the brain’s white matter that are not visible on traditional MRI images. With DTI we can query whether patients differ with respect to white matter integrity, assess functional connectivity and differences between patients and over time with regard to disease progression and/or therapies.
3.4. Magnetic resonance spectroscopy (MRS)
MRS is a noninvasive analytic method which can be paired with MR imaging in the clinical setting. It is capable of identifying and measuring the individual brain chemicals in various brain regions, thereby allowing interrogation of the molecular process within tissues and fluids in vivo and in vitro. 1H–MR spectroscopy is widely used in clinical practice to provide information on brain metabolites such as Cho, Cr, NAA, glutamine, and the osmolytes, such as myoinositol and taurine. Detectable metabolites have a unique frequency resonance called chemical shift reported as a part per million (ppm) which is the same at any magnetic field strength [27]. The signal is derived from Larmor frequency and coupling. The frequency of individual nuclei is compared relative to a reference compound (TMS). The spectrum is read from right to left. The most common metabolites that are perturbed in OTCD are glutamine, choline and myoinositol [16, 18]. Quantitation is possible and may be achieved by in house software or commercially available programs [27].
The MR signal detectable from a voxel is directly proportional to the concentration of the nuclei. A concentrated chemical such as water at 55.5 mmol per gram can be detected by MR imaging using voxels from about 1 mm3 to 5 mm3. Concentrations of biochemicals such as NAA or PCr in the human brain are on the order of 1.5 × 10⁻² and 5 × 10ı mmol per gram of tissue, respectively. Major metabolites in proximal UCDs include Glutamate-glutamine: a mixture of closely related amino acids, amines and derivatives closely involved in excitatory and inhibitory neurotransmission that lies between 2.1 and 2.4 ppm. Integral products of intact TCA (Krebs) cycle activity and mitochondrial redox systems. Glx offers marker in metabolic brain disorders associated with HA. A second important metabolite is Myoinositol, a previously little-known polyol that resonates at 3.6 ppm and is believed to be the missing osmolyte of the early neurological literature for brain volume regulation, a diagnostic modifier in those diseases that affect choline; mI adds specificity to monitoring hepatic encephalopathy and urea cycle disorders. Choline (Cho) reduction in frontal white matter was observed in our cohort with long standing repeated HA. As Cho-containing compounds relate to membrane turnover, membrane dysfunction is suggested to occur in the frontal cortex in OTCD heterozygotes. This dysfunction may be responsible for some of the neurocognitive deficits observed in this disorder.
3.4.1. Metabolites of interest in UCD
Several metabolites are altered in UCD due to HA. They are discussed below.
3.4.2 Glutamate-glutamine (Glx)
This complex is a mixture of closely related amino acids, amines and derivatives closely involved in excitatory and inhibitory neurotransmission. The resonance frequency is between 2.1 and 2.4 ppm. They are integral products of intact TCA (Krebs) cycle activity and mitochondrial redox systems. Glx offers a marker in metabolic brain disorders. Elevations of gln are seen in relation to disorders that are associated with HA such as UCDs and Hepatic encephalopathy. Glutamate may be elevated in disorders associated with neurotoxic injury due to overstimulation of NMDA receptor.
3.4.3 Choline (cho)
The Cho peak represents several soluble components of brain myelin and fluid-cell membranes that resonate at 3.2 ppm. The majority of choline-containing brain constituents are not normally soluble. Pathological alterations in membrane turnover result in a massive increase in MRS-visible Cho as well as tumor, leukodystrophy and multiple sclerosis. Low choline, on the other hand, which is seen in some OTCD cases, is reflective of disrupted osmolar state.
3.4.4. Myoinositol
Myoinositol is a previously little-known polyol that resonates at 3.6 ppm as a complex of peaks. It is believed to be the missing osmolyte of the early neurological literature for brain volume regulation. Myoinositol is a diagnostic modifier in those diseases that affect choline. It serves as an astrocyte marker and osmolyte; it adds specificity to monitoring hepatic encephalopathy and urea cycle disorders.
3.4.5. Why study mI and glutamine in OTCD?
A number of observations allude to the potential role of myoinositol as an important osmolyte in ornithine transcarbamylase deficiency. Our previous MRS studies show significant decrease in myoinositol which may serve as a surrogate marker of prior HA episodes as well as an inverse relationship between glutamine and myoinositol. This relationship does not exist in age matched controls [16] (Figures 1, 4).
Figure 4.
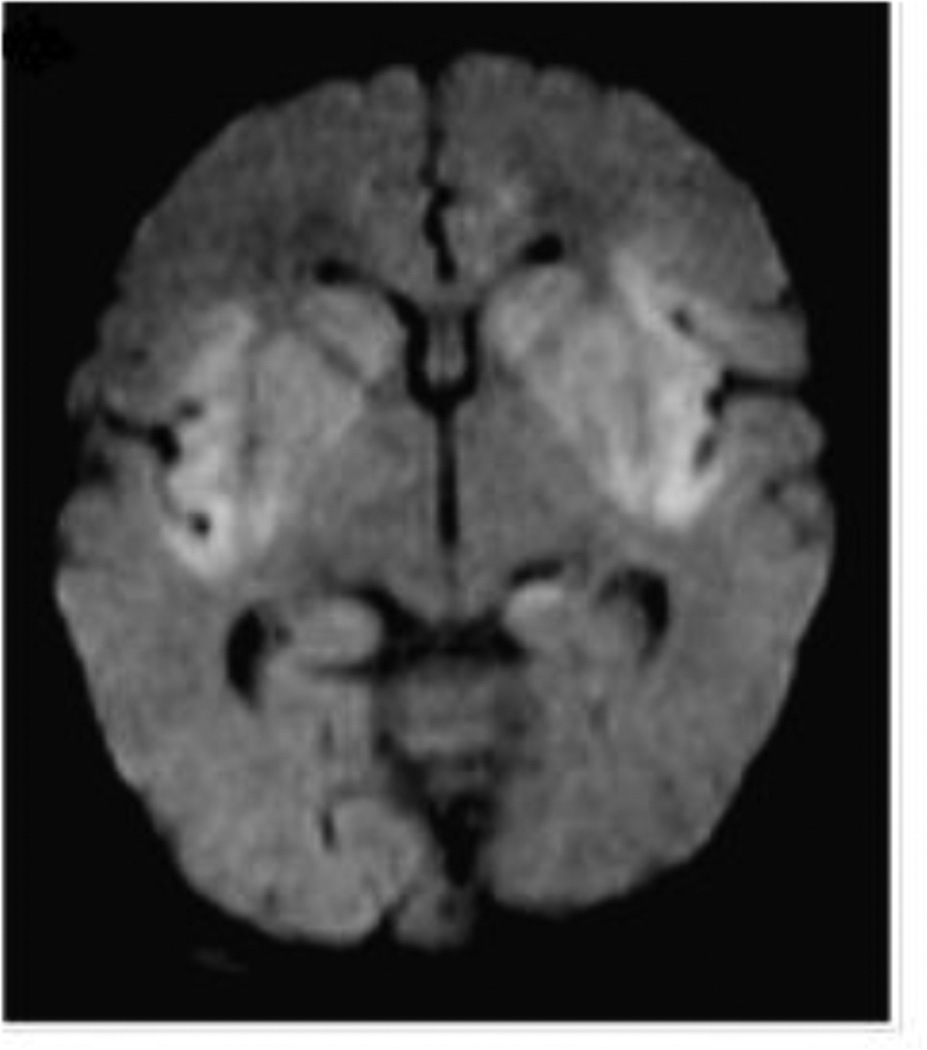
DWI shows restricted diffusion in the perinsular region. Reprinted with permission from Pediatr Radiol. 2012; 42(4):455–462.
The role of myoinositol in the brain is unclear. Inositol diphosphates or triphosphates are important cellular messengers involved in hormone receptor biding that influence many cellular activities. More recent studies implicate mI as an osmolyte in the brain. Glial swelling occurs in response to HA, and the cell volume regulation in astrocytes involves not only ion fluxes, but also organic osmolytes or compounds that accumulate in the cells in response to cell shrinkage or are released in cell swelling. In vitro studies show that astrocytes contain large amounts of mI relative to neurons [28]. Release of mI from astrocytes may reflect a disturbance in cell volume homeostasis introduced by intracellular accumulation of glutamine in response to HA. Excessive ammonia leads to a rapid and substantial increase in gln. The only route of ammonia disposal is via the glutamine synthesis pathway and astrocytes are the only cellular compartment in the brain capable of gln synthesis. Gln is a prime suspect in the list of neurotoxins associated with the neurological aspects of OTCD.
3.5. Functional Magnetic Resonance Imaging (fMRI)/BOLD MRI
3.5.1. fMRI properties
Functional MRI is based on the increase in blood flow to the local blood vessels that accompanies neural activity in the brain. When blood has oxygen in it is referred to as oxyhemoglobin. When blood loses its oxygen it becomes deoxyhemoglobin. Deoxyhemoglobin is paramagnetic. Brain activation leads to a local reduction in deoxyhemoglobin because of the increase in blood flow. Deoxyhemoglobin gives a signal seen on the MRI. Increase in blood flow to the local vasculature that accompanies neural activity in the brain. Deoxyhemoglobin is paramagnetic and alters the T2* weighted magnetic resonance image signal. As such it serves as the source of the signal for fMRI. Coupling between neural activity and changes in blood flow was first reported in 1890 [29]. The BOLD signal in turn represents a qualitative signalthat depends on the combined physiological changes of blood flow and oxygen metabolism which are complex.
fMRI has emerged as a powerful tool for investigating human brain function in vivo. It exploits the magnetic contrast between oxygenated and deoxygenated hemoglobin referred to as a blood oxygen level dependent contrast (BOLD) signal to index metabolically active brain regions as a function of regional cerebral blood flow.
3.5.2. Working memory in UCD
One of the major cognitive consequences of UCD is on working memory. Working memory requires storage, manipulation and retrieval of information in conscious awareness over brief intervals. It is a critical component of executive cognition. A network of brain structures sub serves working memory with the dorsolateral prefrontal cortex (DLPFC) functioning as its central executive.
3.5.3. Use of fMRI to define networks
Although clinically overt brain edema and intracranial pressure cannot be detected with conventional T1- and T2- weighted imaging, small increases in astrocyte water content, present in HA, may have important functional consequences by causing a disturbance of oscillatory networks. Our work has identified abnormal brain network in patients with OTCD by using BOLD fMRI. Using 3D imaging and high spatial resolution capabilities, with fMRI we have examined task-related and resting-state fMRI experimental paradigms. In a task-related fMRI design, a subject is placed in the magnet and scanned while performing various types of cognitive or motor tasks. We used two working memory tasks, the color STROOP and N-back which we have previously described [30].
4. Lessons learned from seven years of imaging OTCD and related conditions, multimodal study of UCDs
4.1. Structural MRI including DTI
There is a specific pattern of brain injury in UCDs. In the proximal disorders, early onset disease in the newborn period results in both gray matter and white matter injury. Because of differences in brain maturity at time of insult, and duration of insult, there are distinct patterns of brain injury seen in neonatal versus late onset disease. The injury pattern reflects degree of maturity of brain and vulnerabilities. Similar to hypoxic ischemic encephalopathy, the basal ganglia and white matter are preferentially involved.
Recently in the face of improved therapies and access to better imaging, Bireley and colleagues described a trend in the distribution of brain MRI abnormalities in infants as as function of severity. In keeping with what is known about the later onset cases, as the severity of neurological sequelae increased the peri-insular region is first involved then followed by, frontal, parietal, temporal and, finally, the occipital lobes. In children with prolonged HA, by DWI, there is evidence of thalamic restriction [31] (Figure 4).
Late onset disease affects the white matter of the brain. Lesions, similar to those seen in HE are best seen with FLAIR imaging as routine T1, T2 MRI may be normal. Lesions can come and go, felt to reflect edema from HA. Adult patients with partial deficiencies may present with reversible signal abnormalities such as increased signal intensities on T2-weighted images in the cingulate gyri, frontal and temporal lobes and insular regions [32, 33]. During an acute HA episode, computed tomography (CT) and MRI reveal cerebral swelling and symmetrical parenchymal lesions, with sparing of the brainstem and cerebellar hemispheres. Chronic changes, as seen on follow-up studies, may demonstrate persistent foci of leukoencephalopathy or other white-matter changes [34]. Additionally, ischemic infarcts in parenchymal areas not served by a specific vascular territory (Fig. 2) are suspicious for metabolic etiology, and strokes have been reported in females with partial deficiency [35].
During our imaging study of patients at “baseline” we observed several examples of impending HA in subjects felt to be at baseline, revealed by elevated brain gln on MRS. In one patient with a movement disorder diagnosed as Parkinson disease, unresponsive to Sinemet with a unilateral tremor, but found a white matter lesion abutting the head of the right caudate, anatomically accounting for a unilateral, left hand tremor. This information is critical in recognizing the true deficit and not assigning an incorrect disorder, the treatment of which has side effects. 1H MRS has shown alterations in brain glutamine (increase), myoinositol (decrease) and choline (decreased in patients with repeated HA). These metabolites may stay abnormal even after recovery. Elevated gln was seen in patients who were not felt to be having any clinical problems at the time of scanning and in asymptomatic females [16] who had normal plasma ammonia and gln at the time. As these subjects were accompanied by caregivers, often a family member, they were heretofore astonished to note that brain gln was elevated in their family member in whom they did not recognize symptoms of neurocognitive decline. In one subject, she subsequently (2 days later) was hospitalized with a florid HA event and had elevated plasma levels at that time, thus demonstrating the utility of measuring brain gln as it may be disparate with plasma levels given a two compartment model .
4.2. White matter injury and relationship to cognitive performance: downstream effects
4.2.1. Diffusion Tensor Imaging (DTI)
DTI relates image intensities to the relative mobility of water molecules in tissue and the direction of the motion. The motion of a water molecule is a random walk (Brownian motion). Areas with relatively high mean diffusion will appear dark on the diffusion weighted MRI images. Because the cellular diffusion of water corresponds to cell geometry in axons, diffusion MRI can also be used to make inferences about white matter architecture. In our cohort of adults and children with OTCD, diffusion tensor imaging shows evidence of white matter injury in motor tracts that connect parts of the brain important in attention and memory. White matter injury and relationship to cognitive performance: downstream effects. Progressive white matter injury predicts cognitive decline with the most pronounced effects on processing speed and executive function. These changes result from white matter tract disruption and related cortical disconnection.
The relationship between white matter damage and clinical findings is influenced by high inter-individual variability. White matter injury is related to cognitive performance as a downstream effect. White matter signal abnormalities detected on routine MRI are only the tip of the iceberg because there are more subtle changes that will be missed on routine imaging. Quantitative data on the white matter microstructure provide a more direct measurement of brain tissue integrity than standard MRI sequences. They provide quantitative measures of the extent of tissue water mobility and early morphological changes such as myelin loss and axonal damage in vivo.
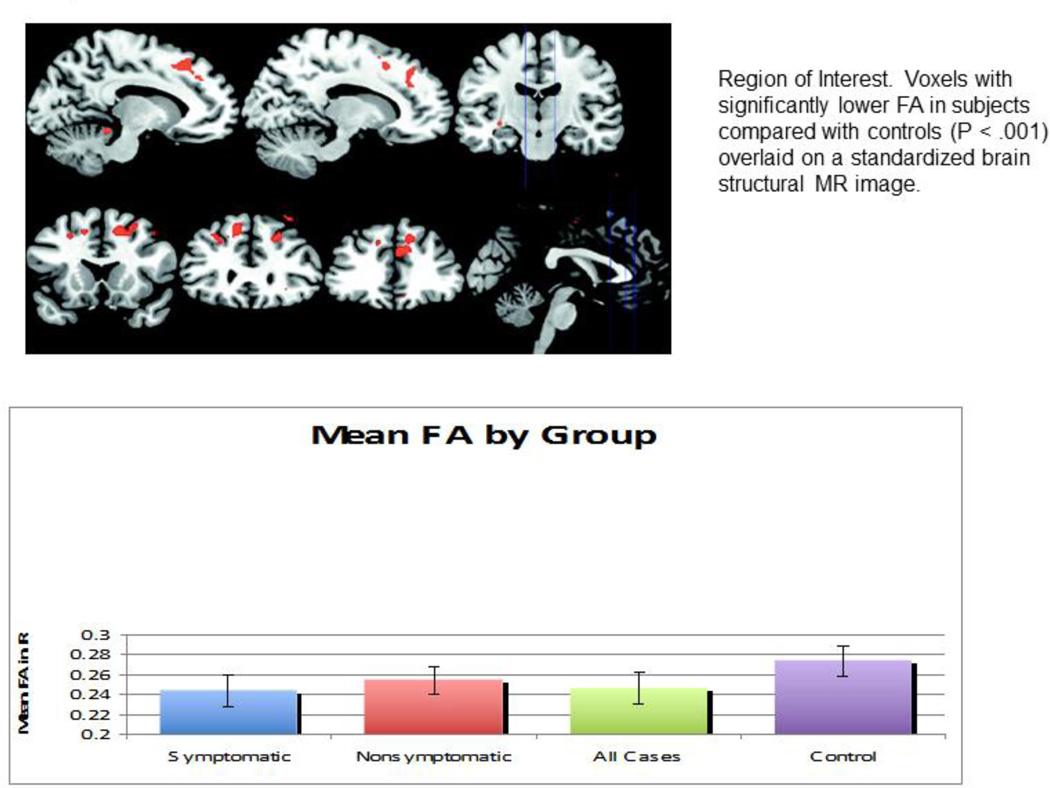
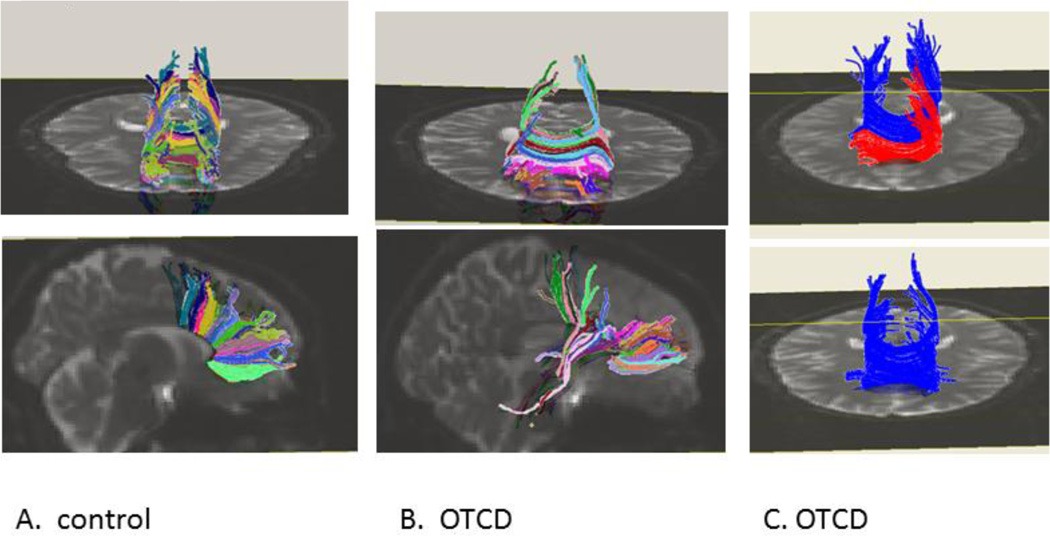
The most commonly used indices for the measurement of anisotropic diffusions by DTI include the relative anisotropy measure, fractional anisotropy (FA), and the volume ratio indices. These indices provide quantitative measurements of the changes of white matter integrity in brain regions that are affected by diseases. Using DTI techniques together with advanced fiber tracking algorithms, (mathematical approaches to derive white matter tractography from DTI data) we have been able to construct 3D trajectories of neural tracts noninvasively, allowing the modeling of white matter neural connectivity in UCDs. We utilized DTI in order to determine whether there are white matter microstructural abnormalities in partial OTCD that could underlie the cognitive phenotype. We focused on WM alterations because prior neuropathology studies in HA showed the WM to be primarily affected, and there is a known relationship between Gln toxicity and WM damage [36]. Anisotropy was calculated from the eigenvalues of the diffusion tensor by using the FA metric and was compared between the study and control groups. FA of the frontal white matter was significantly decreased in subjects, indicating changes in white matter microstructure (Figure 5). There was an inverse relationship between FA and disease severity, but not with age. Based on this, we concluded that findings of MR imaging in OTCD are often normal in patients with late-onset disease, heterozygotes, or in those not in hyperammonemic crisis. DTI was more sensitive than fast spin echo (FSE) T2-weighted imaging for detecting abnormalities in normal-appearing white matter. The extent of abnormality correlated with cognitive deficits. The location of the deficits in the frontal white matter is important because this area connects fibers that are vital to executive function, attention, and working memory. Using DTI, we were able to separate our OTCD symptomatic subjects reliably from controls [37]. We also found many abnormal tracts in patients with OTCD versus controls (Figure 6).
Figure 5.
Region of Interest. Voxels with significantly lower FA in subjects compared with controls (P < .001) overlaid on a standardized brain structural MR image. Reproduced with permission from AJNR 2010; 31(9):1719–1723.
Figure 6.
Normal control (A) and OTCD (B and C) : tractography shows more robust fiber density in control subject in corpus callosum fibers. Additionally in panel C patient with OTCD has absence of anterior crossing fibers in corpus callosum. Modified and reprinted from Mol Genet Metab. 2011; 104(3): 195–205.
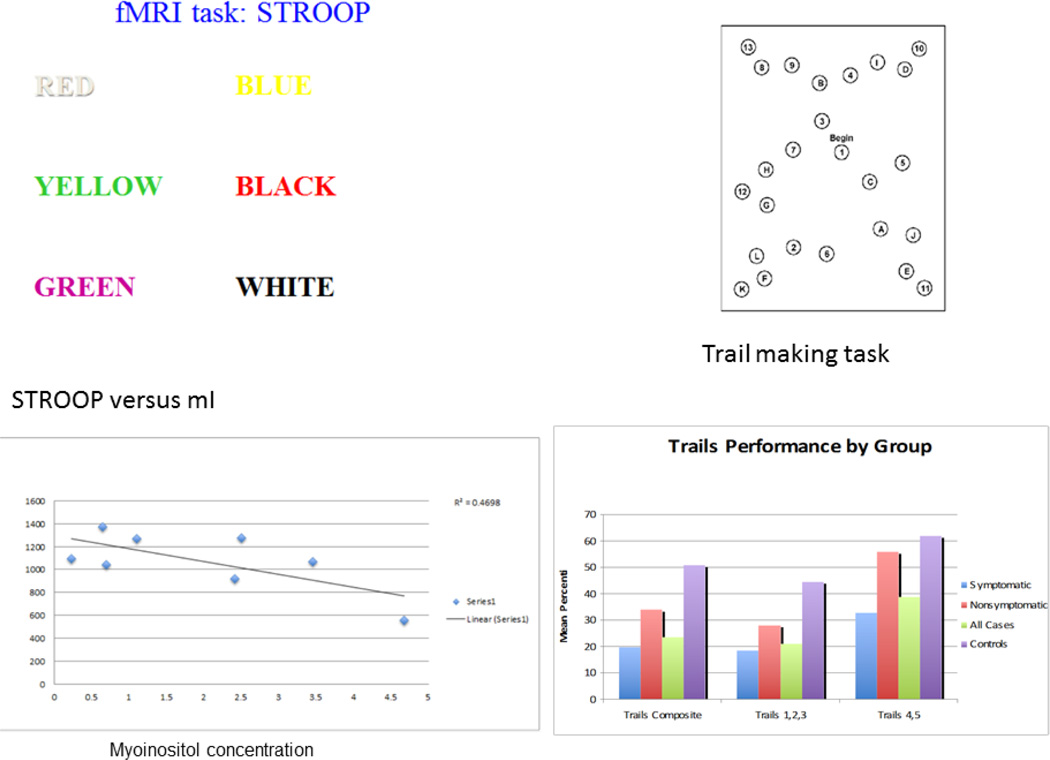
Progressive white matter injury predicts cognitive decline with the most pronounced effects on processing speed and executive function. These changes result from white matter tract disruption and related cortical disconnection. The relationship between white matter damage and clinical findings is influenced by high inter-individual variability. White matter signal abnormalities detected on routine MRI are only the tip of the iceberg because there are more subtle changes that will be missed on routine imaging. Quantitative data on the white matter microstructure provide a more direct measurement of brain tissue integrity than standard MRI sequences. They provide quantitative measures of the extent of tissue water mobility and early morphological changes such as myelin loss and axonal damage in vivo. With our research we have shown DTI evidence of white matter injury in motor tracts that subserve executive attention and working memory and can correlate measures of FA with specific working memory tasks (Figure 7). Similarly in a patient with studied with Arginase deficiency, in who HA would not be expected to play a major role in the clinical sequelae of a spastic diplegia, DTI identified loss of white matter integrity in the corticospinal tracts (leg fibers) which were reduced in number and integrity.
Figure 7.
fMRI working memory tasks and correlation with other measures. In the top panel the Stroop is used to assess executive function levels through measurements of processing speed, simple and complex reaction time, speed-accuracy trade off, and inhibition and selective attention. Participants are required to indicate the color of a word flashed on a screen. The words, “red,” “blue,” or “green,” are displayed in either the corresponding color (congruent trials, e.g. “red” is written in the color red) or a conflicting color (incongruent trials, e.g. “blue” is written in the color green). Longer reaction time to give an answer was associated with low myoinositol. The Comprehensive Trail-Making Test (CTMT is a measure of set-shifting, working memory, divided attention, and cognitive flexibility. Trails 4 and 5 (Part B) require the examinee to connect a series of numbers and letters in a specific sequence as quickly as possible without crossing lines. Numbers are presented as Arabic numerals (e.g. 1, 8) or spelled out in English (i.e. three). This easily administered set of tasks is remarkably sensitive to neuropsychological deficits of many types. CTMT trials 1–3 require only simple sequencing skills. Trials 4 and 5, in contrast, require a higher level of “set shifting” or cognitive flexibility analysis.
4.3. MRS
Elevations of gln and reduced levels of mI in white matter were observed in women with OTCD who were both symptomatic and asymptomatic and suggest the possibility of unrecognized biochemical disturbances (such as edema and volume changes in the astrocyte) in the latter group). The reduction of mI also correlated with cognitive impairments in a pattern suggesting a white matter injury model (submitted). Low mI may be a biomarker of a prior neurological injury represents a compensatory mechanism to correct astrocytic swelling due to high gln [3].
Choline (Cho) reduction in frontal white matter was observed in our cohort with long standing repeated HA. As Cho-containing compounds relate to membrane turnover, membrane dysfunction is suggested to occur in the frontal cortex in OTCD heterozygotes. This dysfunction may be responsible for some of the neurocognitive deficits observed in this disorder.
4.3.1. Metabolites and IQ
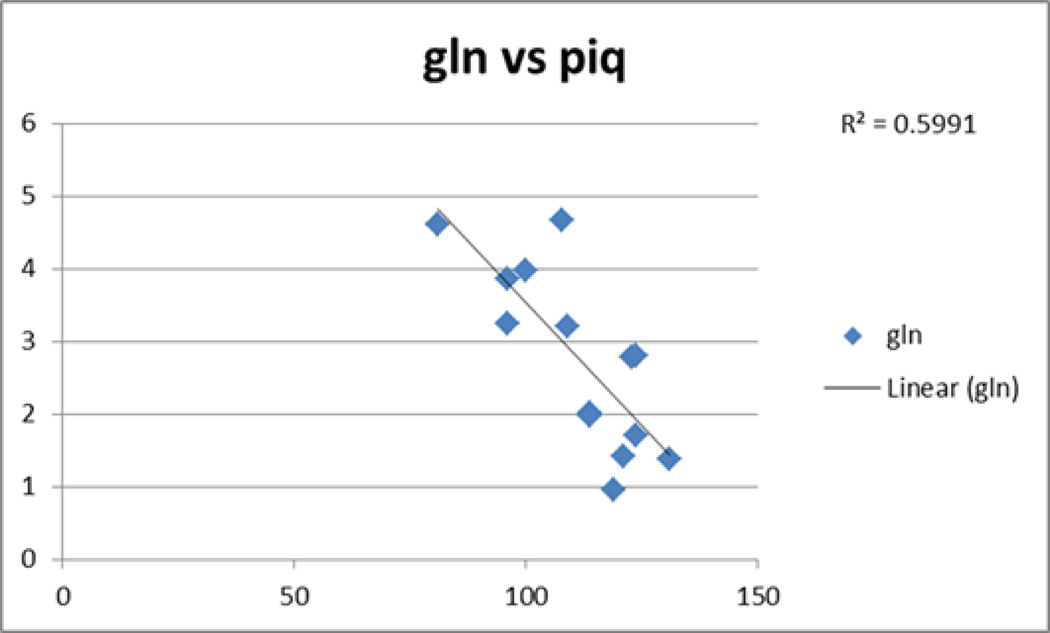
In our cohort, we observed as gln increases, we saw decrease in PIQ (figure 8).
Figure 8.
as gln increases (as measured by 1H MRS), performance IQ (PIQ) decreases
4.4. fMRI
We used fMRI to compare task-dependent neural activation between subjects with OTCD and age-matched controls. During fMRI testing, subjects completed a scanner adapted N-back working memory paradigm, shown to probe cognitive resources that are subserved by the Prefrontal cortex (PFC).
White matter dysfunction (disconnection) affects dexterity, executive function/attention/cognitive control and visuospatial performance. Executive deficits encompass abilities in working memory, attention, task shifting and cognitive flexibility. These functions are closely related to function of brain’s prefrontal cortex, which relies heavily on dopamine for intercellular neurotransmission. Severe intellectual disability is seen in untreated or poorly managed patients, thus, one is unable to make these fine distinctions. However, deficits in these cognitive domains in well managed patients were observed despite normal global IQ.
To test for differences in BOLD signal activation between subjects with OTCD and healthy controls during a working memory task, we imaged 19 subjects with OTCD and 21 healthy controls using a scanner based N-back working memory task in a 3T scanner. In subjects with OTCD we observed increased BOLD signal in the right dorsolateral prefrontal cortex (DLPFC) and anterior cingulate cortex (ACC) relative to healthy age matched controls. Using fMRI we demonstrated that when memory performance is controlled for, OTCD patients have to do more “brain work” to do the same cognitive task relative to healthy controls, indicating “inefficient” neuronal activation. There was reduced BOLD activation in OTCD when performing a working memory selective attention task, particularly in the more demanding settings there is decreased reaction time, accuracy trade off. In addition, we observed accessory activation of regions not seen in controls. The effects of cognitive inefficiency intensified in the 2 back conditions of the testing [30].
Increased neuronal activation in OTCD subjects despite equivalent task performance points to sub-optimal activation of the working memory network in these subjects, most likely reflecting damage caused by hyperammonemic events. These increases directly relate to our previous finding of reduced frontal white matter integrity in the superior extents of the corpus callosum; key hemispheric connections for these areas.
4.4.1. Development of alternative networks
Significant correlations have been identified between cognitive decline in OTCD and degree of exposure to HA [31]. While work remains to characterize the specific nature of neurotransmitter imbalance and neurocognitive pathways affected in OTCD, it is plausible that structural damage to cholinergic neurons depletes these patients’ stores of prefrontal dopamine, and that increased neural activation during prefrontal mediated cognitive operations is employed as a compensatory response.
Callicott et al. have previously shown that PFC activation during working memory follows an inverted U-shaped curve, with BOLD signal increasing with cognitive load until the demands of the task overwhelm an individual’s capacity, and as a result, BOLD signal decreases [38]. It has also been shown that the peak of this curve may be shifted in disorders affecting neurocognition, so that peak activation is reached at a lower load in patients compared with control subjects [39]. Our finding of increased DLPFC activity for a given level of task performance in OTCD patients suggests prefrontal inefficiency. OTCD patients experience peak DLPFC activation at lower cognitive load than age matched controls. Additionally, OTCD patients exhibited higher ACC activation than controls. The ACC is a key regulator of cognitive control and error monitoring [40]. Activation of ACC increases with activation of DLPFC when cognitive load is increased on an N-back paradigm [41]. Increased ACC activation may be a biomarker of increase in cognitive demand in OTCD patients. Increased demand on neuronal activity for equivalent performance and the decreased performance on three neuropsychological measures of PFC based executive cognition denote a neurocognitive deficit in OTCD, likely arising from damage to prefrontal neurons and white matter tracts caused by hyperammonemic events [42]. Not surprisingly, the areas with increased activation in the OTCD patients have hemispheric connections that overlap with our prior findings of reduced white matter integrity in the superior projections of the genu and rostrum of the corpus callosum [37].
5. Conclusions
Our understanding of the neurocognitive challenges of OTCD has been improved with the study of advanced MR imaging techniques; however, many issues remain unresolved. The UCD consortium represents the unchallenged opportunity to study well characterized UCD patients. Moving into the next five years, it will be crucial to define the nature of low-grade brain edema in patients with chronic, acute, and acute-on-chronic OTCD as well as look at the contribution of neurotoxic metabolites and their downstream effects in the distal UCDs. Perfusion-weighted MR imaging, such as arterial spin-labeling, a noninvasive MR imaging technique in which the blood is used as an endogenous contrast agent, can be used to investigate the hemodynamic changes that accompany HA. fMRI should also be further investigated in defining the neural basis of cognitive and functional impairment of patients UCDs.
New Research Highlights.
Multimodal imaging shows increased glutamine and low myo inositol in an inverse ratio
DTI shows loss of frontal white matter integrity in late onset (partial) OTCD
fMRI shows decreased cognitive efficiency with complex attentional tasks
Acknowledgments
Contract grant sponsor: National Center for Research Resources (NCRR); Contract grant number: K12RR17613, 5M01RR020359; Contract grant sponsor: National Institute of Child Health and Human Development; Contract grant number: 9U54HD061221; Contract grant sponsor: O’Malley Foundation.
Footnotes
Publisher's Disclaimer: This is a PDF file of an unedited manuscript that has been accepted for publication. As a service to our customers we are providing this early version of the manuscript. The manuscript will undergo copyediting, typesetting, and review of the resulting proof before it is published in its final citable form. Please note that during the production process errors may be discovered which could affect the content, and all legal disclaimers that apply to the journal pertain.
Presented at the International UCD symposium, Barcelona, Spain September 2, 2013
References
- 1.Bachmann C. Mechanisms of hyperammonemia. Clin Chem Lab Med. 2002;40:653–662. doi: 10.1515/CCLM.2002.112. [DOI] [PubMed] [Google Scholar]
- 2.Gropman AL, Batshaw ML. Cognitive outcome in urea cycle disorders. Mol Genet Metab. 2004;81(Suppl 1):S58–S62. doi: 10.1016/j.ymgme.2003.11.016. [DOI] [PubMed] [Google Scholar]
- 3.Mardini H HC, Record C. Pathogenesis of hepatic encephalopathy: lessons from nitrogen challenges in man. Metab Brain Dis. 2013;28:201–207. doi: 10.1007/s11011-012-9362-2. [DOI] [PubMed] [Google Scholar]
- 4.Butterworth RF, Giguere JF, Michaud J, Lavoie J, Layrargues GP. Ammonia: key factor in the pathogenesis of hepatic encephalopathy. Neurochem Pathol. 1987;6:1–12. doi: 10.1007/BF02833598. [DOI] [PubMed] [Google Scholar]
- 5.Ott P, Clemmesen O, Larsen FS. Cerebral metabolic disturbances in the brain during acute liver failure: from hyperammonemia to energy failure and proteolysis. Neurochem Int. 2005;47:13–18. doi: 10.1016/j.neuint.2005.04.002. [DOI] [PubMed] [Google Scholar]
- 6.Felipo V, Butterworth RF. Mitochondrial dysfunction in acute hyperammonemia. Neurochem Int. 2002;40:487–491. doi: 10.1016/s0197-0186(01)00119-x. [DOI] [PubMed] [Google Scholar]
- 7.Butterworth RF. Effects of hyperammonaemia on brain function. J Inherit Metab Dis. 1998;21(Suppl 1):6–20. doi: 10.1023/a:1005393104494. [DOI] [PubMed] [Google Scholar]
- 8.Brusilow SW, Maestri NE. Urea cycle disorders: diagnosis, pathophysiology, and therapy. Adv Pediat,r. 1996;43:127–170. [PubMed] [Google Scholar]
- 9.Batshaw ML, MacArthur RB, Tuchman M. Alternative pathway therapy for urea cycle disorders: twenty years later. J Pediatr. 2001;138:S46–S54. doi: 10.1067/mpd.2001.111836. discussion S54–45. [DOI] [PubMed] [Google Scholar]
- 10.Brusilow SW SW, Danney M, Waber LJ, Batshaw M, Burton B, Levitsky L, Roth K, McKeethren C, Ward J. Treatment of episodic hyperammonemia in children with inborn errors of urea synthesis. NEJM. 1984;310:1630–1634. doi: 10.1056/NEJM198406213102503. [DOI] [PubMed] [Google Scholar]
- 11.Brusilow SW, Valle DL, Batshaw M. New pathways of nitrogen excretion in inborn errors of urea synthesis. Lancet. 1979;2:452–454. doi: 10.1016/s0140-6736(79)91503-4. [DOI] [PubMed] [Google Scholar]
- 12.Enns GM, Berry SA, Berry GT, Rhead WJ, Brusilow SW SW, Hamosh A. Survival after treatment with phenylacetate and benzoate for urea-cycle disorders. N EJM. 2007;356:2282–2292. doi: 10.1056/NEJMoa066596. [DOI] [PubMed] [Google Scholar]
- 13.Msall M, Batshaw ML, Suss R, Brusilow SW, Mellits ED. Neurologic outcome in children with inborn errors of urea synthesis. Outcome of urea-cycle enzymopathies. NEJM. 1984;310:1500–1505. doi: 10.1056/NEJM198406073102304. [DOI] [PubMed] [Google Scholar]
- 14.Msall M, Monahan PS, Chapanis N, Batshaw ML. Cognitive development in children with inborn errors of urea synthesis. Acta Paediatr Jpn. 1988;30:435–441. doi: 10.1111/j.1442-200x.1988.tb02534.x. [DOI] [PubMed] [Google Scholar]
- 15.Nagata N, Matsuda I, Matsuura T T, Oyanagi K, Tada K, Narisawa K, Kitagawa T, Sakiyama T, Yamashita F, Yoshino M. Retrospective survey of urea cycle disorders: Part 2. Neurological outcome in forty-nine Japanese patients with urea cycle enzymopathies. Am J Med Genet. 1991;40:477–481. doi: 10.1002/ajmg.1320400421. [DOI] [PubMed] [Google Scholar]
- 16.Gropman AL, Fricke ST, Seltzer RR, Hailu A, Adeyemo A, Sawyer A, van Meter J, Gaillard WD, McCarter R, Tuchman M, Batshaw M. Urea Cycle Disorders Consortium, 1H MRS identifies symptomatic and asymptomatic subjects with partial ornithine transcarbamylase deficiency. Mol Genet Metab. 2008;95:21–30. doi: 10.1016/j.ymgme.2008.06.003. [DOI] [PMC free article] [PubMed] [Google Scholar]
- 17.Choi CG, Yoo HW. Localized proton MR spectroscopy in infants with urea cycle defect. AJNR. 2001;22:834–837. [PMC free article] [PubMed] [Google Scholar]
- 18.Connelly A, Cross JH, Gadian DG DG, Hunter JV, Kirkham FJ FJ, Leonard JV. Magnetic resonance spectroscopy shows increased brain glutamine in ornithine carbamoyl transferase deficiency. Pediatr Res. 1993;33:77–81. doi: 10.1203/00006450-199301000-00016. [DOI] [PubMed] [Google Scholar]
- 19.Norenberg MD, Jayakumar AR, Rama Rao KV, Panickar KS. New concepts in the mechanism of ammonia-induced astrocyte swelling. Metab Brain Dis. 2007;22:219–234. doi: 10.1007/s11011-007-9062-5. [DOI] [PubMed] [Google Scholar]
- 20.Takahashi H, Koehler RC, Brusilow SW, Traystman RJ. Inhibition of brain glutamine accumulation prevents cerebral edema in hyperammonemic rats. Am J Physiol. 1991;261(3 Pt 2):H825–H829. doi: 10.1152/ajpheart.1991.261.3.H825. [DOI] [PubMed] [Google Scholar]
- 21.Blei AT. The pathophysiology of brain edema in acute liver failure. Neurochem Int. 2005;47:71–77. doi: 10.1016/j.neuint.2005.04.009. [DOI] [PubMed] [Google Scholar]
- 22.Norenberg MD, Bender AS. Astrocyte swelling in liver failure: role of glutamine and benzodiazepines. Acta Neurochir Suppl (Wien) 1994;60:24–27. doi: 10.1007/978-3-7091-9334-1_6. [DOI] [PubMed] [Google Scholar]
- 23.Zielińska M, Popek M, Albrecht J. Roles of Changes in Active Glutamine Transport in Brain Edema Development during Hepatic Encephalopathy: An Emerging Concept. Neurochemical Res. 2013 Sep 26; doi: 10.1007/s11064-013-1141-x. [Epub ahead of print] [DOI] [PMC free article] [PubMed] [Google Scholar]
- 24.Lichter-Konecki U, Mangin JM, Gordish-Dressman H, Hoffman EP, Gallo V. Gene expression profiling of astrocytes from hyperammonemic mice reveals altered pathways for water and potassium homeostasis in vivo. Glia. 2008;56:365–377. doi: 10.1002/glia.20624. [DOI] [PMC free article] [PubMed] [Google Scholar]
- 25.Gropman AL. Expanding the diagnostic and research toolbox for inborn errors of metabolism: the role of magnetic resonance spectroscopy. Mol Genet Metab. 2005;86:2–9. doi: 10.1016/j.ymgme.2005.07.009. [DOI] [PubMed] [Google Scholar]
- 26.Basser PJ, Mattiello J, LeBihan D. MR diffusion tensor spectroscopy and imaging. Biophys J. 1994;66:259–267. doi: 10.1016/S0006-3495(94)80775-1. [DOI] [PMC free article] [PubMed] [Google Scholar]
- 27.Provencher SW. Estimation of metabolite concentrations from localized in vivo proton NMR spectra. Magn. Reson. Med. 1993;30:672–679. doi: 10.1002/mrm.1910300604. [DOI] [PubMed] [Google Scholar]
- 28.Lee JH, Ross BD. Quantification of idiogenic osmoles in human brain. Abstr Commun 12th annual Meet Soc MR med. 1993;1553 [Google Scholar]
- 29.Roy CS, Sherrington CS. On the Regulation of the Blood-supply of the Brain. J Physiol. 11(1890):85–108. 158–217. doi: 10.1113/jphysiol.1890.sp000321. [DOI] [PMC free article] [PubMed] [Google Scholar]
- 30.Gropman AL, Shattuck K, Prust MJ, Seltzer RR, Breeden AL AL, Hailu A, Rigas A, Hussain R, VanMeter J J. Altered neural activation in ornithine transcarbamylase deficiency during executive cognition: an fMRI study. Hum Brain Mapp. 2013;34:753–761. doi: 10.1002/hbm.21470. [DOI] [PMC free article] [PubMed] [Google Scholar]
- 31.Bireley WR, Van Hove JLK, Gallagher RC, Fenton LZ. Urea cycle disorders: brain MRI and neurological outcome. Pediatr Radiol. 2012;42:455–462. doi: 10.1007/s00247-011-2253-6. [DOI] [PubMed] [Google Scholar]
- 32.Chen YF, Huang YC, Liu HM, Hwu WL. MRI in a case of adult-onset citrullinemia. Neuroradiology. 2001;43:845–847. doi: 10.1007/s002340100608. [DOI] [PubMed] [Google Scholar]
- 33.Gaspari R, Arcangeli A, Mensi S, Wismayer DS, Tartaglione T, Antuzzi D, Conti G, Proietti R. Late-onset presentation of ornithine transcarbamylase deficiency in a young woman with hyperammonemic coma. Ann Emerg Med. 2003;41:104–109. doi: 10.1067/mem.2003.6. [DOI] [PubMed] [Google Scholar]
- 34.Takanashi J, Barkovich AJ, Cheng SF, Weisiger K, Zlatunich CO, Mudge C, Rosenthal P, Tuchman M, Packman S. Brain MR imaging in neonatal hyperammonemic encephalopathy resulting from proximal urea cycle disorders. AJNR. 2003;24:1184–1187. [PMC free article] [PubMed] [Google Scholar]
- 35.Mamourian AC, du Plessis A. Urea cycle defect: a case with MR and CT findings resembling infarct. Pediatr Radiol. 1991;21:594–595. doi: 10.1007/BF02012608. [DOI] [PubMed] [Google Scholar]
- 36.Albrecht j, Zielińska M, Norenberg MD. Glutamine as a mediator of ammonia neurotoxicity: A critical appraisal. BiochemPharmacol. 2010;80:1303–1308. doi: 10.1016/j.bcp.2010.07.024. [DOI] [PMC free article] [PubMed] [Google Scholar]
- 37.Gropman AL, Gertz B, Shattuck K, Kahn IL, Seltzer R, Krivitsky L, Van Meter J. Diffusion tensor imaging detects areas of abnormal white matter microstructure in patients with partial ornithine transcarbamylase deficiency. AJNR. 2010;31(9):1719–1723. doi: 10.3174/ajnr.A2122. [DOI] [PMC free article] [PubMed] [Google Scholar]
- 38.Callicott JH, Mattay VS, Bertolino A, Finn K, Coppola R, Frank JA, Goldberg TE, Weinberger DR. Physiological characteristics of capacity constraints in working memory as revealed by functional MRI. Cereb Cortex. 1999;9:20–26. doi: 10.1093/cercor/9.1.20. [DOI] [PubMed] [Google Scholar]
- 39.Callicott JH, Weinberger DR. Brain imaging as an approach to phenotype characterization for genetic studies of schizophrenia. Methods Mol Med. 2003;77:227–247. doi: 10.1385/1-59259-348-8:227. [DOI] [PubMed] [Google Scholar]
- 40.Kerns JG, Cohen JD, MacDonald AW, 3rd, Cho RY, Stenger VA, Carter CS. Anterior cingulate conflict monitoring and adjustments in control. Science. 2004;303:1023–1026. doi: 10.1126/science.1089910. [DOI] [PubMed] [Google Scholar]
- 41.Jansma JM, Ramsey NF, Coppola R, Kahn RS. Specific versus nonspecific brain activity in a parametric N-back task. Neuroimage. 2000;12:688–697. doi: 10.1006/nimg.2000.0645. [DOI] [PubMed] [Google Scholar]
- 42.Braissant O. Current concepts in the pathogenesis of urea cycle disorders. Mol Genet Metab. 2010;100(Suppl 1):S3–S12. doi: 10.1016/j.ymgme.2010.02.010. [DOI] [PubMed] [Google Scholar]


