

Abstract
Obesity has been associated with alterations of both functional and structural aspects of the human central nervous system. In obese individuals both fat mass (FM; primarily consisting of adipose tissue) and fat-free mass (FFM; all non-adipose tissues) are increased and it remains unknown whether these compartments have separate effects on human brain morphology. We used voxel-based morphometry to investigate the relationships between measures of body composition and regional gray matter volume (GMV) in 76 healthy adults with a wide range of adiposity (24F/52M; age 32.1±8.8y; percentage of body fat [PFAT%] 25.5±10.9%; BMI 29.8±8.9). Faf-free mass index (FFMI kg*m-2) showed negative associations in bilateral temporal regions, the bilateral medial and caudolateral OFC, and the left insula. Fat mass index (FMI kg*m-2) showed similar, but less extensive negative associations within temporal cortical regions and the left caudolateral orbitofrontal cortex (OFC). In addition, negative associations were seen for FMI with GMV of the cerebellum. Associations of FFMI with temporal and medial orbitofrontal GMV appeared to be independent of adiposity. No associations were seen between measures of adiposity (i.e. FM and PFAT) and GMV when adjusted for FFM. The majority of regions that we find associated with FFM have been implicated in the regulation of eating behavior and show extensive projections to central autonomic and homeostatic core structures. These data indicate that not adipose tissue or relative adiposity itself, but obesity related increases in absolute tissue mass and particularly FFM may have a more predominant effect on the human brain. This might be explained by the high metabolic demand of FFM and related increases in total energy needs.
Keywords: Fat-free mass, fat mass, obesity, VBM, MRI, gray matter, prefrontal cortex
Introduction
The obesity epidemic is an ongoing and increasing problem in Western societies. Excessive overweight is associated with an increased risk for numerous diseases including cardio- and cerebrovascular disease, diabetes mellitus, certain types of cancer (Flegal et al., 2002, 2010) as well as neurodegenerative diseases such as Alzheimer’s disease (Gustafson et al., 2003) and Parkinsons’s disease (Hu et al., 2006). Dysfunction of the brain reward system is believed to play a central role in the development and/or maintenance of human obesity, leading to compensatory increases in food intake, and consequently resulting in a chronically positive energy balance and accumulation of excess body fat (e.g. Berridge et al., 2010). In the past decade, there has been an increasing number of neuroimaging studies investigating the effects of excessive overweight on brain morphology and function. Positron emission tomography revealed reduced dopamine D2 receptor and dopamine transporter (DAT) availability in the striatum of obese individuals (Wang et al., 2001; Chen et al., 2008) while striatal D2 receptor availability was positively correlated with prefrontal metabolic activity (Volkow et al., 2008). The same group showed that BMI was inversely associated with prefrontal metabolism (Volkow et al., 2009). Using voxel based morphometry, obese individuals have been shown to have less regional gray matter volume (GMV) in the cerebellum, striatum, parietal and prefrontal regions compared to lean individuals (Pannacciulli et al., 2006). In a large study in Japan, BMI in men was negatively associated with regional GMV in the bilateral temporal lobes, anterior lobe of the cerebellum, occipital lobe, frontal lobe, and precuneus and positively associated with GMV of the inferior frontal gyri, posterior lobe of the cerebellum, frontal lobes, temporal lobes, thalami, and caudate heads (Taki et al., 2008). In a sample of cognitively normal older females, BMI was also negatively associated with regional GMV of the inferior frontal and orbitofrontal cortex (OFC), right posterior cortex including the parahippocampal gyrus of the occipital lobe, and the right cerebellum (Walther et al., 2010). In a larger sample of elderly obese men an women, less extensive GM reductions were reported compared with other studies although there was significantly less GMV in the left dorsolateral-prefrontal coretx (DLPFC) (Brooks, Benedict, et al., 2012).
All the above findings have been attributed to excess adiposity. However, both fat mass (FM) and fat-free mass (FFM) are increased in obesity and may exert differential effects on brain morphology and function.
Fat mass primarily consists of adipose tissue, while fat-free mass comprises all non fat tissues including skeletal muscle, bones and parenchymal organs. FFM has been shown to strongly predict energy expenditure (24 hour and resting), accounting for more than 80% of the variance and increased FFM is the primary reason for the increased energy needs in obese individuals (Ravussin et al., 1982, 1986). Thus, as a crucial factor in energy homeostasis, increases in FFM may be associated with changes in brain regions involved in homeostatic control.
In this exploratory study, we aimed to investigate the relationship of body composition with brain structure, hypothesizing differential associations of FFM and adiposity (i.e. FM and PFAT) with regional GMV. We performed voxel-based morphometry (VBM) (Ashburner and Friston, 2000) of volumetric brain magnetic resonance images in a population of 76 individuals with a wide range of adiposity. VBM is an automated brainmapping technique that reliably allows to assess differences in brain structure (i.e. regional gray matter volume [GMV]) across subjects.
Associations of regional GMV with measures of body composition were first investigated by individually analyzing height indexed FFM, FM (FMI and FFMI; kg*m-2) (VanItallie et al., 1990) and percentage body fat (PFAT%) within seperate models. To further assess independent associations of bodycompostion variables we used two different combined models, entering either FFMI and PFAT or FFM, FM and height as seperate regressors in the same model.
2. Subject and Methods
2.1. Subjects
All subjects in this study had previously participated in brain imaging studies of hunger, satiation, and the predisposition to obesity. We included 76 adult, non-diabetic, healthy adults (80.2% European Americans; 11.8% African Americans; 5.3% Latino Americans; 2.6% Asian Americans) with a wide range of adiposity (24F/52M; handedness 70/5/1 [right/left/ambidextrous]; age 32.1±8.8y; percentage of body fat [PFAT] 25.5±10.9%; BMI 29.8±8.9) who had both available MRI and dual energy x-ray absorptiomery (DXA) scans. Major medical disorders were ruled out based on medical history, physical examination and screening laboratory tests (including urine drug screen and oral glucose tolerance test, OGTT). Smokers and subjects with ongoing medication, history of substance, nicotine or alcohol abuse or addiction, endocrine disorders (including type 2 diabetes), hypertension, pulmonary, cardiovascular, gastrointestinal, hepatic, renal, central nervous system or psychiatric disorders were not eligible. All volunteers provided a written informed consent and spent one week in the metabolic unit of the Phoenix Epidemiology and Clinical Reasearch Branch (PECRB) of the National Institute of Diabetes and Digestive and Kidney Diseases (NIDDK) in Phoenix, AZ. During the admission, subjects were restricted to sedentary activity only and were placed on a weight maintaining diet (50% of calories from carbohydrate, 30% fat and 20% protein). Subjects fasted for 36h (n=70) or 12h (n=6) prior to imaging sessions. The protocol was approved by the Institutional Review Boards of the NIDDK and the Banner Good Samaritan Regional Medical Center and all applicable institutional and governmental regulations concerning the ethical use of human volunteers were followed during this research.
2.2 Experimental procedures
Body composition (percentage body fat, PFAT; fat-free mass, FM; fat mass, FFM) was assessed by dual energy x-ray absorptiomery (DXA; DPX-1; Lunar Corp, Madison, WI); fat-free mass index (FFMI) and fat mass index (FMI) were calculated as FM kg * height m-2 and FFM kg * height m-2. Resting metabolic rate (RMR) was measured for 45 minutes using a ventilated-hood system (DeltaTrac, SensorMedics, Yorba Linda, CA).
2.4 Imaging procedures
All subjects underwent Magnetic Resonance Imaging (MRI) at the Banner Good Samaritan Regional Medical Center (Phoenix, AZ) on a 1.5 Tesla Signa system (General Electric, Milwaukee, WI, USA) and MRIs were examined for any anatomical abnormalities by an experienced neuroradiologist. A set of high-resolution T1-weighted images was acquired with a fast spoiled gradient echo (FSPGR) 3d sequence (repetition time [TR]/ echo time [TE] = 12ms/5.2ms; inversion time (TI) = 300ms, number of excitations (NEX) = 1; field-of-view [FOV] = 24 × 24 cm; 256 × 256 matrix); the whole-brain data were acquired in an axial plane yielding 120 contiguous slices with slice thickness of 1 mm.
2.5 Image data analysis
Voxel-based morphometry (Ashburner and Friston, 2000) was performed using the VBM8 toolbox (http://dbm.neuro.uni-jena.de/vbm.html) implemented in the Statistical Parametric Mapping package (SPM8, Wellcome Department of Imaging Neuroscience, London, UK; www.fil.ion.ucl.ac.uk/spm). Default settings (including high-dimensional DARTEL normalization algorithms and modulation for non-linear components) were used for the segmentation into gray matter (GM), white matter (WM), and cerebrospinal fluid (CSF) and the subsequent normalization to the DARTEL template in MNI space (voxelsize: 1.5mm × 1.5mm × 1.5mm) as provided with the VBM8 Toolbox. For smoothing of GM data we employed a 12mm full-width-half-maximum isotropic Gaussian kernel. Only voxels with a GM value of >0.1 were included by using the absolute threshold option.
Associations of regional GMV with measures of body composition were first investigated by individually analyzing height indexed FFM, FM (FMI and FFMI; kg*m-2) (VanItallie et al., 1990) and percentage body fat (PFAT%) within separate multiple variable regression models of GM images. For these analyses a conservative threshold of p<0.05 (FWE, family-wise error correction for multiple comparisons on the voxel-level) and a cluster-size threshold of 100 continuous voxels was employed. Associations of PFAT were also explored more liberally at p<0.05 corrected for multiple comparisons on the cluster level (FWE) with a voxelwise threshold of p<0.001.
To investigate associations of FFM and adiposity (i.e. FM and PFAT) independently of each other we used two different multiple variable regression analyses adding either FFMI and PFAT or FFM, FM and height as individual regressors to the model.
For the model containing both FFM and FM we chose to add height as seperate regressor, in order to reduce co-lineraity as compared to entering FFMI and FMI.
For these models we initially applied the more liberal cluster-level inference (p<0.05; voxelwise threshold p<0.001).
Age, sex and handedness were included as additional covariates in all models.
While FFMI adjusted for PFAT did show highly significant and extensive negative associations with GMV, these results are primarily reported at a conservative threshold (p<0.05 voxel-level corrected, k=100). Results significant at p<0.05 FWE (voxelwise threshold p<0.0005) were illustrated as figure.
Because of the non-isotropic distribution of gray matter data, significance of the cluster extent was computed with the non-stationary correction (Hayasaka et al., 2004), as implemented in SPM8.
Anatomical regions were identified by using the BioImage Suite MNI to Talaraich Coordinate Converter (www.bioimagesuite.org) and the Talaraich Client v2.4.2 (Lancaster et al., 2000).
Results
Table 1 summarizes the overall subject characteristics and anthropometric measures of our study group. Out of the 76 subjects 36 were classified as normal weight (BMI<25) and 40 individuals as overweight (BMI>25 n=8) or obese (BMI>30 n=36). As expected, measures of body composition did correlate strongly [FFM and FM r2=0.26(0.61); FFMI and FMI r2=0.48 (0.66); FFMI and PFAT r2=0.34 (0.55); brackets indicate partial r2 adjusted for age and sex; all p<0.001 ]. FFM was strongly associated with resting metabolic rate (RMR, R2=0.68, p<0.001, n=70 subjects).
Table 1.
Characteristics of the study population
| n (female/male)* | 76 (24/52) |
| Age | 32.1(±8.8) |
| Weight kg | 88.7(±24.6) |
| Height cm | 173.1(±8.7) |
| PFAT % | 25.5(±10.9) |
| FFM kg | 64.2(±12.1) |
| FM kg | 24.6(±15.6) |
| FFMI kg*m-2 | 21.4(±3.8) |
| FMI kg*m-2 | 8.4(±5.6) |
| BMI kg*m-2 | 29.8(±8.9) |
| RMR kcal (n=70) | 1645(±344) |
All results apart from*are presented as mean ± SD;
PFAT percentage body fat; FFM fat-free mass; FM fat mass; FFMI fat-free mass index;
FMI fat mass index; BMI body mass index; RMR resting metabolic rate
Table 2 summarizes local maxima; listing stereotactic locations, p-values and spatial extent. No significant positive associations (p<0.05 FWE voxel- and/or cluster-level corrected) were found for all analyses.
Table 2.
Negative associations of regional gray matter volume with measures of fat-free mass (FFM), fat mass (FM), and Percent body fat (PFAT%)
| Region, Brodman Area | MNIa coordinates
|
p | cluster size | ||
|---|---|---|---|---|---|
| x | y | z | |||
| FFMI (FWE voxel-level)* | |||||
| L. Middle Temporal Gyrus, BA21 | -68 | -27 | -18 | 0.000 | 929 |
| L. Inferior Temporal Gyrus, BA 20 | -45 | 3 | -45 | 0.000 | 987 |
| L. Fusiform Gyrus, BA20 | -56 | -3 | -30 | 0.004 | |
| R. Inferior Frontal Gyrus, BA47 | 38 | 30 | -9 | 0.001 | 655 |
| R. Inferior Temporal Gyrus, BA20 | 56 | 0 | -38 | 0.001 | 508 |
| R. Inferior Temporal Gyrus, BA20 | 47 | 5 | -47 | 0.015 | |
| L. Inferior Frontal Gyrus, BA45 | -35 | 29 | 6 | 0.001 | 738 |
| L. Inferior Frontal Gyrus, BA47 | -38 | 21 | -8 | 0.007 | |
| L. Inferior Frontal Gyrus, BA47 | -30 | 32 | -8 | 0.010 | |
| L. Medial Frontal Gyrus, BA25 | -9 | 33 | -18 | 0.002 | 1315 |
| R. Rectal Gyrus, BA11 | 3 | 51 | -24 | 0.012 | |
| R. Inferior Frontal Gyrus, BA11 | 11 | 38 | -17 | 0.015 | |
| R. Middle Temporal Gyrus, BA21 | 62 | -1 | -14 | 0.005 | 336 |
| L. Insula BA13 | -38 | -10 | 13 | 0.007 | 298 |
| FMI (FWE voxel-level)* | |||||
| L. Inferior Temporal Gyrus, BA20 | -42 | 0 | -47 | 0.000 | 739 |
| L. Middle Temporal Gyrus, BA21 | -68 | -27 | -18 | 0.001 | 593 |
| R. Inferior Temporal Gyrus, BA20 | 45 | 2 | -48 | 0.001 | 414 |
| L. Inferior Frontal Gyrus, BA47 | -38 | 20 | -8 | 0.008 | 218 |
| L. Cerebellum, Pyramis | -8 | -84 | -38 | 0.013 | 405 |
| PFAT% (FWE voxel-level)* | |||||
| L. Inferior Temporal Gyrus, BA20 | -42 | 0 | -47 | 0.004 | 142 |
| PFAT% (FWE cluster-level)ø | |||||
| L. Cerebellum, Pyramis | -8 | -82 | -35 | 0.015 | 5213 |
| L. Cerebellum, Declive | -8 | 88 | -26 | ||
| R. Fusiform Gyrus, BA19 | 47 | -75 | -21 | ||
| FFMI, adjusted for PFAT% (FWE voxel-level)* | |||||
| R. Middle Temporal Gyrus, BA21 | 57 | 2 | -14 | 0.000 | 951 |
| L. Medial Frontal Gyrus, BA11 | -6 | 29 | -15 | 0.001 | 1247 |
| FFM, adjusted for FM and Height (FWE cluster-level)ø | |||||
| R. Superior Temporal Gyrus, BA38 | 56 | 5 | -17 | 0.038 | 2331 |
| R. Subgyral Gray Matter, BA 20 | 47 | -11 | -26 | ||
| R. Subgyral Gray Matter, BA20 | 44 | -3 | -27 | ||
MNI: Montreal Neurological Institute.
Results significant at a threshold of p<0.05 FWE corrected on the voxel-level and a cluster size of 100 continuous voxels;
Results significant at a threshold of p<0.05 FWE corrected on the cluster-level, adjusted for non-stationarity of smoothed GM data, with a voxelwise threshold of p<0.001;
FFMI fat-free mass index, FMI fat-mass index, PFAT percentage body fat;
Bold data indicate primary peak within a cluster; Non-bold data indicate secondary peaks.
Due of the strong covariance of FFM and FM several models were applied in order to assess how body composition is related to brain morphology.
FFMI showed significant negative associations (p<0.05 voxel-level corrected, k=100) within the bilateral temporal lobes [i.e. bilateral middle (MTG) and inferior temporal gyrus (ITG)], the bilateral ventromedial prefrontal cortex [vmPFC, extending to the subgenual portion of the anterior cingulate (sgACC and Bromann Area 25)] and the bilateral caudolateral orbitofrontal cortex [clOFC, i.e.bilateral inferior frontal gyrus (IFG) extending towards the anterior insula on the left side]. Unilateral significant associations were observed in the left mid-posterior insula (Table 2; Figure 1).
Figure 1.
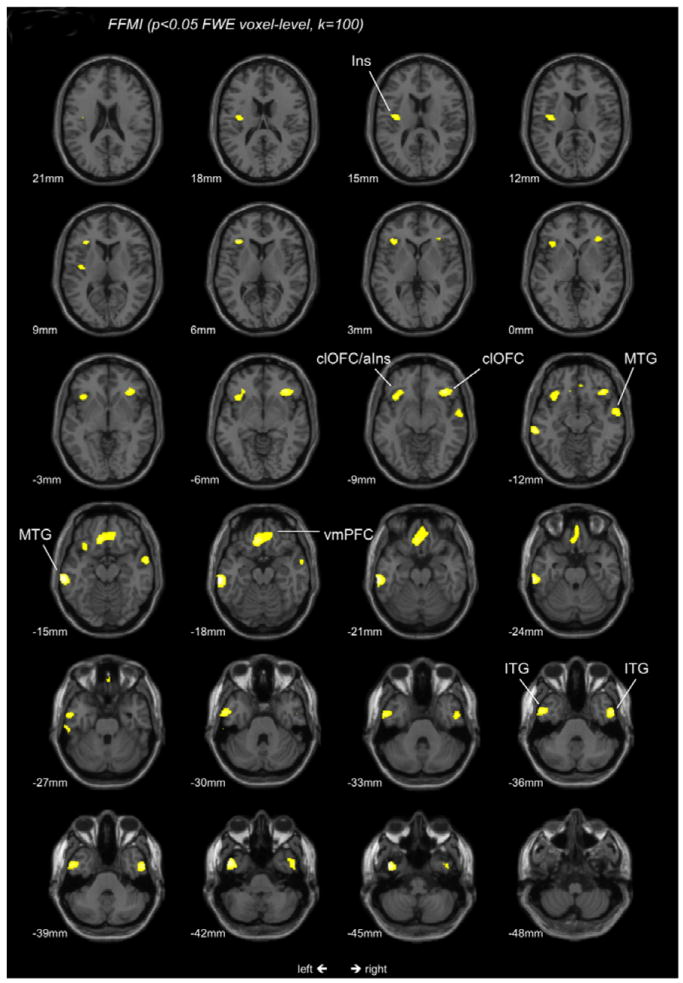
T-score map of regional GMV negatively associated with FFMI. Maps are thresholded at a significance level of P<0.05, FWE corrected for multiple comparisons on the voxel-level and an extent threshold of 100 continuous voxels; Ins Insula; aIns anterior Insula; Corresponding locations on the -z-axis are indicated below each section; clOFC caudolateral orbitofrontal cortex; MTG middle temporal gyrus; vmPFC ventromedial prefrontal cortex; ITG inferior temporal gyrus;
Negative associations with FMI (p<0.05 voxel-level corrected, k=100) partially overlapped with FFMI and included the bilateral ITG, the left MTG, a smaller cluster in the left clOFC and the left cerebellum (i.e. pyramis) (Table 2; Figure 2).
Figure 2.
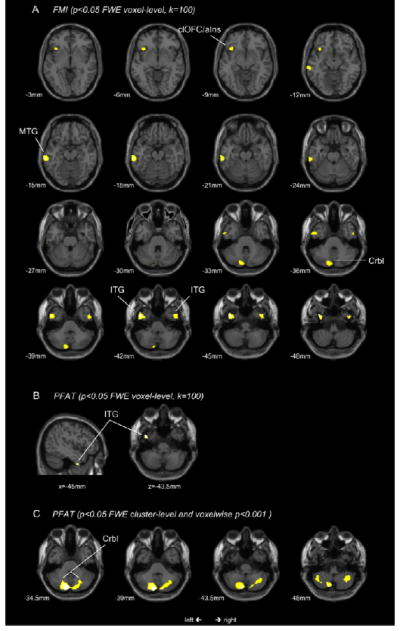
T-score maps of regional GMV negatively associated with FMI (2A) and PFAT (2B, 2C). Maps 2A and 2B are thresholded at a significance level of P<0.05, FWE corrected for multiple comparisons on the voxel-level and an extent threshold of 100 continuous voxels; Map 2C is thresholded at p<0.05, FWE cluster-level corrected with a voxelwise threshold of p<0.001; corresponding locations on the z-axis and x-axis (2B only) are indicated below each section; clOFC caudolateral orbitofrontal cortex; aIns anterior Insula; MTG middle temporal gyrus; Crbl cerebellum; ITG inferior temporal gyrus;
For percentage body fat (PFAT %) on the other hand, significant negative associations were only found within the left temporal lobe (i.e. ITG) when corrected on the voxel-level (p<0.05, k=100). Cluster-level corrected (p<0.05; voxelwise p<0.001), we observed negative associations with cerebellar GMV only (Table 2; Figure 2B and 2C).
FFMI, adjusted for PFAT was negatively associated (p<0.05, voxel-level corrected, k=100) with GMV of right temporal pole (peak location within the MTG) and the bilateral vmPFC (particularly the subgenual ACC) (Fig 3A). More liberally analyzed at p<0.05 cluster-level corrected (voxelwise p<0.0005) extensive negative associations were observed in the right temporal lobe (comprising the right insula), the bilateral vmPFC and ACC (extending to the left clOFC), the left MTG and the right clOFC (results illustrated in Fig 3B).
Figure 3.
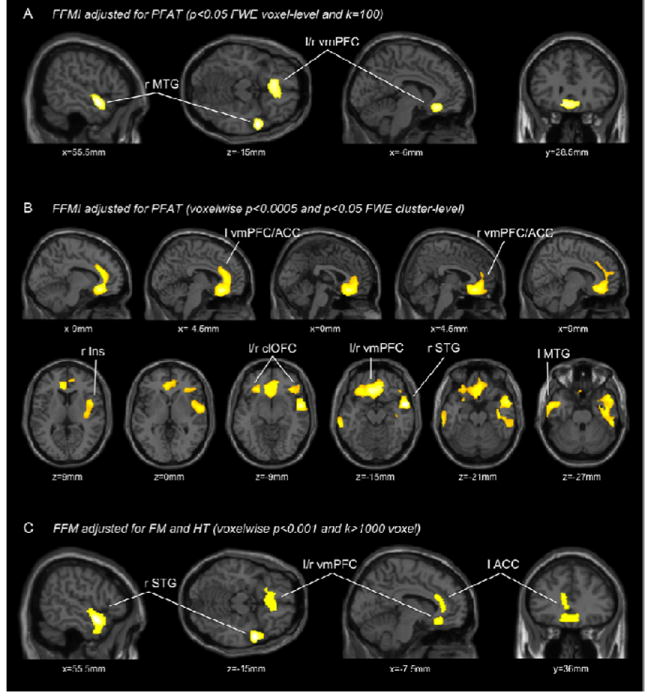
T-score maps of regional GMV negatively associated with FFMI adjusted for PFAT (2A,C) and FFM adjusted for FM and height (2C); 2A is thresholded at a significance level of P<0.05, FWE corrected for multiple comparisons on the voxel-level and an extent threshold of 100 continuous voxels; 2B thresholded at p<0.05, FWE cluster-level corrected with a voxelwise threshold of p<0.005; 2C is thresholded at uncorrected p<0.001 and an extent threshold 1000 continuous voxels; corresponding locations in the stereotactic space are indicated below each section; l left; r right; MTG middle temporal gyrus; vmPFC ventromedial prefrontal cortex; ACC anterior cingulate; Ins Insula; clOFC caudolateral orbitofrontal cortex; STG superior temporal gyrus;
In models with FM, height, and FFM as seperate regressors, FFM was negatively associated (p<0.05 cluster-level corrected) with GMV of the right superior temporal gyrus. Although we also observed a large cluster within the vmPFC and the ACC, this association did not reach significance (p=0.137, see Figure 3C).
In order to test the validity of our SPM analyses, residuals of FFM (adjusting for FM and height) were calculated outside of the SPM framework (SAS statistical software 9.2) and used as covariates of interest in an additional multiple regression analysis, showing a very similar pattern of negative association within the right temporal pole and the bilateral vmPFC. These associations were actually more pronounced using this method (both clusters significant at p<0.05; data not shown).
No negative associations were found for adiposity (i.e. PFAT and FM) when adjusted for FFM.
Discussion
This is the first study investigating the relationship of body composition with brain gray matter volume in healthy humans with a wide range of adiposity. In a population of 76 individuals, we found that fat-free mass index (FFMI) was negatively associated with GMV of the bilateral temporal lobes, vmPFC (mainly subgenual portion of the ACC) and caudolateral OFC (clOFC; left cluster extending to the anterior insular cortex) and with more posterior areas of the left insular cortex. FMI showed overlapping, but less extensive associations with bilateral temporal regions and the left clOFC and was also negatively associated with cerebellar GMV. Percentage body fat (PFAT%), a height and body size independent marker of adiposity was negatively associated with left temporal GMV only, and in a more liberal analysis with GMV of the cerebellum. In two different models, negative associations of FFM with GMV of the right temporal pole and the vmPFC were still seen, even after adjusting for adiposity (i.e. PFAT and FM). Measures of adiposity (i.e. FMI and PFAT) on the other hand were not associated with GMV when adjusting for FFM.
BMI has been repeatedly shown to be associated with reduced GMV of prefrontal, temporal and cerebellar brain regions (Pannacciulli et al., 2006; Taki et al., 2008; Walther et al., 2010; Brooks, Benedict, et al., 2012; Kurth et al., 2012). As BMI does not allow to differentiate between tissue types, no inferences can be drawn on whether adipose tissue itself is responsible for these findings. In this study we did not analyze associations of surrogate markers of adiposity with brain structure, but actual amounts of FM, FFM percentages of total body fat (PFAT). Compared to FMI and especially FFMI, only moderate associations were seen for PFAT. These results seem to indicate that obesity related structural brain changes might not be driven by the relative amount of adipose tissue itself but by overall increases in absolute tissue mass and FFM in particular. These findings might have important implications for the neurobiology of obesity and might be explained by the specific biological characteristics of these compartments.
FFM consists of highly metabolically active tissue, including skeletal muscle and parenchymal organs, all of which underly higher central control mechanisms. FFM is the major determinant of energy expenditure, accounting for >80% of an individual’s RMR (Ravussin et al., 1982, 1986) and maximal oxygen uptake (Goran et al., 2000). The primary function of fat-mass and adipose tissue on the other hand is to store and provide energy, without significantly contributing to an individuals overall energy needs. Hence, in terms of energy requirements FFM is the more important biological variable. In support of FFM as the primary driver of energy needs, FFM but not FM or BMI, was associated with daily energy intake in a sample of 92 obese individuals (Blundell et al., 2011). Obesity is also accompanied by haemodynamic overload and a hyperdynamic circulation due to the increase in total tissue volume and in total energy needs (Alexander, 1993; Alpert, 2001; Vasan, 2003). FFM was strongly and independently associated with left ventricular mass while total but body fat was not (Bella et al., 1998; Whalley et al., 1999; Rider et al., 2009). These findings were attributed to the high metabolic demand of FFM requiring a compensatory increase in cardiac output and stroke volume.
In all models analyzing FFM, we consistently found negative associations with medial prefrontal cortical areas and the subgenual portion of the ACC in particular. BMI and even more waist circumference has been shown to be associated with less GMV of the mPFC (Kurth et al., 2012) and numerous neuroimaging studies have highlighted a role for the medial prefrontal cortex in obesity and food motivated behavior (Martin et al., 2010; Gearhardt et al., 2011). Higher cognitive functions of the mPFC and the ACC include decision making and inhibitory control, i.e. the ability to control the response to specific stimuli (e.g. rewarding foods and drugs) (Batterink et al., 2010; Perry et al., 2011) and evidence indicates that obesity and addictive behavior in general is associated with impairments of these cognitive processes, possibly perpetuating unhealthy behaviors (e.g. chronic overeating) (Volkow et al., 2008; Batterink et al., 2010; Koob and Volkow, 2010). Intriguingly, vmPFC activity has been associated with dietary self-control and has been proposed to orchestrate cue-induced behavioral responses after integrating top-down (i.e. dlPFC, IFG) and bottom-up (i.e. nucleus accumbens, amygdala) information (Hare et al., 2011; Jasinska et al., 2011). In an overarching model, the ACC has also been hypothesized to serve as an integrator of autonomic, emotional and cognitive information in response to internal and environmental demands (Critchley et al., 2003). Anterior cingulate regions (particularly BAs 25, 32) send major projections to brain regions implemented in homeostatic and autonomic control (i.e. hypothalamus periaqueductal gray, nucleus of the solitary tract) (An et al., 1998; Ongür et al., 1998; Rempel-Clower and Barbas, 1998; Freedman et al., 2000) and a substantial number of neuroimaging studies have demonstrated that the ACC responds to a wide range of homeostatic challenges including thirst, hunger, hypoglycemia and respiratory stress (i.e. air hunger) (Weston, 2012). Deactivation of medial prefrontal cortical regions has also been associated with both reduced parasympathetic tone and disinhibition of the sympathetic nervous system (Kimmerly et al., 2005; Wong et al., 2007). More specifically, the subgenual ACC has been suggested to have a preferentially antisympathetic function (Medford and Critchley, 2010). In this context it seems noteworthy that obesity has been associated with autonomic dysfunction and increased sympathetic and reduced parasympathetic output (Karason et al., 1999). Abnormal activity patterns of the subgenual cingulate (i.e. BA25) have also been shown in patients suffering from major depression (Hamani et al., 2011), which is accompanied by autonomic dysregulation and may be prospectively associated with obesity (Faith et al., 2011).
Associations of GMV of the bilateral clOFC (peaks located in IFG) with FFMI and to a lesser degree with FMI (left-sided only) also confirm previous structural findings in obese subjects (Pannacciulli et al., 2006; Walther et al., 2010; Kurth et al., 2012). Interestingly a VBM study of patients suffering from frontotemporal lobar degeneration, a neurodegenerative disorder often accompanied by hyperphagia (i.e. “pathological sweet tooth”), showed less GMV of these regions (i.e. caudolateral OFC, BA47) in affected hyperphagic compared with non-hyperphagic patients (Whitwell et al., 2007). Increased activation of the clOFC has been associated with decreasing reward value in subjects overfed with chocolate (Small et al., 2001) and BMI correlated inverseley with activation of this region in food related tasks involving inhibitory control (Batterink et al., 2010). As mentioned above, higher activity of this region (together with dlPFC and vmPFC) and the IFG has been demonstrated in in subjects who make healthier food-choices. In this context it also seems noteworthy that reduced GMV of the left dlPFC, a region that is believed to provide top-down control for IFG and vmPFC guided behavior, has been linked to future BMI increases in young females (Yokum et al., 2012). Further functional neuroimaging studies also have demonstrated activation of the caudolateral OFC in response to gastrointestinal stimuli, emphasizing its role in processing visceral information (Stephan et al., 2003; Vandenbergh et al., 2005; Wang et al., 2006). Associations of FFMI with less GMV of the left clOFC did involve a large part of the anterior insula. In addition we observed a seperate cluster in more posterior areas of the left insular cortex. The insula has been implicated in taste (Araujo and Rolls, 2004, 2004), appetite (Porubská et al., 2006) and food related craving (Pelchat et al., 2004). Structural (Alkan et al., 2008; Kurth et al., 2012) and functional (DelParigi et al., 2005; Tomasi et al., 2009) alterations of the insula have been demonstrated in obese subjects. The posterior insula specifically has been implicated in processing interoceptive information including hunger, thirst, and visceral sensations (among others) while the anterior insula is believed to be responsible for the final subjective evaluation of this information (Craig, 2011). Obese subjects showed increased activity of the insula in response to gastric distention, suggesting that altered visceral perception might promote ingestion of larger food amounts (Tomasi et al., 2009). Extensive projections to autonomic core structures (i.e. brainstem and hypothalamus) and medial prefrontal regions provide further support for an involvement of the insula in the regulation of basic bodily functions, also in line with its well established role in cardiovascular control (Oppenheimer et al., 1992; Oppenheimer, 2007; Nagai et al., 2010). A substantial functional lateralization of the insula has been described, with an involvement of the left mid-insular cortex in the regulation of parasympathetic activity and the right side being involved in the regulation of sympathetic activity (Craig, 2011). This may also explain why FFMI was associated with left insular GMV only. Bilateral anterior and left posterior insular GMV was reduced in patients with chronic heart failure who have autonomic imbalance characterized by increased sympathetic and decreased parasympathetic outflow (Woo et al., 2009). As above mentioned, similar autonomic disturbances (i.e. increase of sympathetic outflow and decreasesd parasympathetic activity) have been described in obese subjects (Karason et al., 1999). It has to be acknowledged however, that in more liberal analyses FFMI adjusted for PFAT was negatively associated with the right temporopolar region that comprised large parts of the right insula.
Reductions of temporal lobe GMV in obese subjects is well documented (Gustafson et al., 2004; Alkan et al., 2008; Taki et al., 2008; Kurth et al., 2012), and our results support these findings. As a matter of fact, for all analyses, associations were found within the temporal lobes. In neuroimaging studies, activation of the temporal cortex, particularly the STG, MTG and the temporal pole is associated with thirst and hunger, even though these activation patterns have not been as consistently seen as with medial prefrontal regions (Weston, 2012). In obese subjects, PET studies demonstrated greater decreases of temporal cortical activity response to satiety and the sensory experience of a liquid meal (Gautier et al., 2000, 2001; DelParigi et al., 2005). From a functional perspective this seems less obvious as the temporal lobes are primarily implicated in memory and processing of visual and auditory information including speech. Specifically the temporal pole (together with mPFC, clOFC and midbrain regions) appears to form part in networks implicated in salience processing (Seeley et al., 2007) and altered function of this network has been reported in obese subjects (García-García et al., 2012).
Within the OFC two complementary neural circuits (i.e. medial and orbital prefrontal network) have been identified (Carmichael and Price, 1996). The orbital network comprises regions on the orbital surface of the PFC and is believed to integrate sensory information which may affect eating and reward-related behavior. The medial network consists of medial prefrontal regions (BAs 10, 11, 24, 25, 32) and a smaller region within the left and right caudolateral OFC. It is highly interconnected with cortical, limbic and subcortical brain regions and, consistent with the previously discussed functions of the ACC and adjacent structures of the mPFC, it has been proposed to serve as a cortical modulating system for homeostatic, autonomic, and visceral bodily functions (Carmichael and Price, 1996; Price, 1999, 2007; Ongur and Price, 2000; Ongur et al., 2003; Saleem et al., 2008). In this study we observed a substantial overlap between regions associated with FFM and regions that belong to the medial network, including the clOFC. As above mentioned, the caudolateral aspect of the medial network is located within the agranular insular cortex (i.e. area Ia1) and area 12o, which in humans largely corresponds to BA47 (Ongür et al., 2003; Price, 2007) and closely resembles those regions within the clOFC we identified as being associated with FFMI (i.e. left BA 47 and right BAs 45, 47) and in parts with FMI (i.e. left BA 47). According to Price et al., the clOFC is interconnected with both the medial and orbital network (Price, 2007). Thus caudolateral orbitofrontal regions, including BA47, may mediate between the two networks, integrating information on autonomic and homeostatic regulation (i.e. medial network) and reward related behavior (i.e. orbital network).
With respect to our findings in the temporal cortex, retrograde and anterograde labeling studies revealed connections between medial prefrontal regions and the dorsal temporal pole, superior temporal gyrus and the dorsal bank of the superior temporal sulcus (Kondo et al., 2003; Saleem et al., 2008). These findings are also supported by histological studies, demostrating similar cytoarchitectural features of temporopolar, insular and prefrontal regions (Mesulam and Mufson, 1982).
In our results, FFMI and FFM (adjusted for PFAT and FM respectively) was negatively associated with both the right dorsal temporal pole, with clusters being mainly located within the right STG. On the other hand we also observed strong negative associations of FFMI and FMI with GMV of the MTG and ITG and of PFAT with GMV of the ITG only, regions which have been shown to be more connected to the orbital network (Saleem et al., 2008), even though associations of FFMI with GMV of the MTG extended substantially into the STG. However, while all of the referenced anatomical connectivity studies have been done in non-human primates we have to acknowledge, that although the orbital and medial PFC of non-human primates seems to be comparable to the human OFC (Ongür and Price, 2000; Price, 2007), this does not necessarily apply to the temporal cortex (Saleem et al., 2008).
The brain region that was only associated with FMI and at lower thresholds with PFAT was the cerebellum, even though these associations were absent when accounting for FFM. Numerous studies have shown reduced cerebellar GMV in individuals with increased adiposity (Pannacciulli et al., 2006; Taki et al., 2008; Walther et al., 2010; Kurth et al., 2012) and altered cerebellar activity has been shown in obese but also underweight subjects (i.e. subjects suffering from eating disorders) in a variety of functional imaging studies (Wang et al., 2006; Tomasi et al., 2009; Brooks et al., 2011; Brooks, O’Daly, et al., 2012). The cerebellum has direct connections with the hypothalamus and apart from regulating numerous non-somatic functions, it may also regulate visceral activities associated with eating behavior (Zhu and Wang, 2008). Leptin, a hormone secreted by adipose tissue, may provide the explanation for a link between FM and the GMV in the cerebellum. In the human brain, the highest levels of the leptin receptor have been observed within the cerebellum and the hypothalamus (Burguera et al., 2000). Leptin replacement in genetically leptin deficient humans has been shown to increase GMV of the cerebellum (London et al., 2011). In healthy humans, plasma leptin concentrations covaried positively with cerebellar GMV but only after adjusting for adiposity (Pannacciulli et al., 2007). In our case FMI and PFAT were negatively associated with cerebellar GMV. Obesity is characterized by a state of leptin resistance. This leptin resistance is thought to occur on the level of the blood brain barrier (Kurrimbux et al., 2004; Adam et al., 2006; Banks, 2008) and rodent studies indicate this leptin resistance is more pronounced for the cerebellum (Kurrimbux et al., 2004) perhaps accounting for our negative associations.
In light of our findings it seems conceivable that in human obesity, increases in FFM and the associated increase in metabolic demand, leads to changes in neurocircuitries that regulate complex basal bodily functions. However, it has to to be pointed out that obesity is a complex condition that involves a multitude of physiological and pathophysiological changes, including endocrine, metabolic, immunological and behavioral parameters which again all might contribute to the reported findings.
Several limitations need to be addressed. Initial recruitment of study subjects was based primarily on the BMI criterions of lean and obese. As a consequence only a limited number of subjects were categorized as overweight (BMI>25 and <30; n=8). However, all measures of body composition and particularly PFAT, as the more precise measure of adiposity were very evenly distributed throughout the study sample. It also has to be acknowledged that FM and FFM co-vary strongly which likely explains the overlap we observed between FMI and FFMI. This issue becomes particularly important in combined models that included both measures of FFMI, FFM and measures of adiposity (i.e. %PFAT and FM). Still, all adjusted models did yield a very similar pattern of associations in temporal and prefrontal regions. Additional models with residuals of FFM (i.e. variance of FFM that is not explained by FM and height) did confirm these findings. Still, because of these limitations and the correlational and explorative nature of this analysis, a cautious interpretation of our results is required. FFM is also proportionally more elevated in trained athletes and body builders and recent evidence indicates that physical activity is associated with brain structure (Benedict et al., 2012). No information on the physical fitness of our study population was available and it is not clear that our results indicate that exercise that specifically increases FFM will affect these brain regions. Thus, results of our analysis should be viewed in the context of gradations of adiposity. Women were also relatively underrepresented in our population.
Conclusion
Our results indicate that obesity related increases in adipose tissue and FFM exert differential effects on regional brain GMV. Regions we identified as associated with FFM are known to have important roles in the regulation of eating behavior and overlap substantially with described central networks implicated in the regulation of basal bodily functions. These findings might be related to increases in total energy needs as a result of the high metabolic demand of FFM. Overall our results indicate that increased FFM may result in alterations of central pathways that, in turn, produce changes in autonomic and homeostatic regulation, including eating behavior that contribute to adiposity.
Footnotes
Publisher's Disclaimer: This is a PDF file of an unedited manuscript that has been accepted for publication. As a service to our customers we are providing this early version of the manuscript. The manuscript will undergo copyediting, typesetting, and review of the resulting proof before it is published in its final citable form. Please note that during the production process errors may be discovered which could affect the content, and all legal disclaimers that apply to the journal pertain.
References
- Adam CL, Findlay PA, Miller DW. Blood-brain leptin transport and appetite and reproductive neuroendocrine responses to intracerebroventricular leptin injection in sheep: influence of photoperiod. Endocrinology. 2006;147:4589–4598. doi: 10.1210/en.2006-0576. [DOI] [PubMed] [Google Scholar]
- Alexander JK. Obesity and the heart. Heart Dis Stroke. 1993;2:317–321. [PubMed] [Google Scholar]
- Alkan A, Sahin I, Keskin L, Cikim AS, Karakas HM, Sigirci A, Erdem G. Diffusion-weighted imaging features of brain in obesity. Magnetic Resonance Imaging. 2008;26:446–450. doi: 10.1016/j.mri.2007.10.004. [DOI] [PubMed] [Google Scholar]
- Alpert MA. Obesity cardiomyopathy: pathophysiology and evolution of the clinical syndrome. Am J Med Sci. 2001;321:225–236. doi: 10.1097/00000441-200104000-00003. [DOI] [PubMed] [Google Scholar]
- An X, Bandler R, Ongür D, Price JL. Prefrontal cortical projections to longitudinal columns in the midbrain periaqueductal gray in macaque monkeys. J Comp Neurol. 1998;401:455–479. [PubMed] [Google Scholar]
- de Araujo IE, Rolls ET. Representation in the Human Brain of Food Texture and Oral Fat. J Neurosci. 2004;24:3086–3093. doi: 10.1523/JNEUROSCI.0130-04.2004. [DOI] [PMC free article] [PubMed] [Google Scholar]
- Ashburner J, Friston KJ. Voxel-based morphometry--the methods. Neuroimage. 2000;11:805–821. doi: 10.1006/nimg.2000.0582. [DOI] [PubMed] [Google Scholar]
- Banks WA. The blood-brain barrier as a cause of obesity. Curr Pharm Des. 2008;14:1606–1614. doi: 10.2174/138161208784705496. [DOI] [PubMed] [Google Scholar]
- Batterink L, Yokum S, Stice E. Body mass correlates inversely with inhibitory control in response to food among adolescent girls: an fMRI study. Neuroimage. 2010;52:1696–1703. doi: 10.1016/j.neuroimage.2010.05.059. [DOI] [PMC free article] [PubMed] [Google Scholar]
- Bella JN, Devereux RB, Roman MJ, O’Grady MJ, Welty TK, Lee ET, Fabsitz RR, Howard BV. Relations of left ventricular mass to fat-free and adipose body mass: the strong heart study. The Strong Heart Study Investigators Circulation. 1998;98:2538–2544. doi: 10.1161/01.cir.98.23.2538. [DOI] [PubMed] [Google Scholar]
- Benedict C, Brooks SJ, Kullberg J, Nordenskjöld R, Burgos J, Le Grevès M, Kilander L, Larsson E-M, Johansson L, Ahlström H, Lind L, Schiöth HB. Association between physical activity and brain health in older adults. Neurobiology of aging. 2012 doi: 10.1016/j.neurobiolaging.2012.04.013. [DOI] [PubMed] [Google Scholar]
- Berridge KC, Ho C-Y, Richard JM, DiFeliceantonio AG. The tempted brain eats: pleasure and desire circuits in obesity and eating disorders. Brain Res. 2010;1350:43–64. doi: 10.1016/j.brainres.2010.04.003. [DOI] [PMC free article] [PubMed] [Google Scholar]
- Blundell JE, Caudwell P, Gibbons C, Hopkins M, Näslund E, King NA, Finlayson G. Body composition and appetite: fat-free mass (but not fat mass or BMI) is positively associated with self-determined meal size and daily energy intake in humans. The British Journal of Nutrition. 2011:1–5. doi: 10.1017/S0007114511003138. [DOI] [PubMed] [Google Scholar]
- Brooks SJ, Benedict C, Burgos J, Kempton MJ, Kullberg J, Nordenskjöld R, Kilander L, Nylander R, Larsson E-M, Johansson L, Ahlström H, Lind L, Schiöth HB. Late-life obesity is associated with smaller global and regional gray matter volumes: a voxel-based morphometric study. International Journal of Obesity. 2012 doi: 10.1038/ijo.2012.13. [DOI] [PMC free article] [PubMed] [Google Scholar]
- Brooks SJ, O’Daly O, Uher R, Friederich H-C, Giampietro V, Brammer M, Williams SCR, Schiöth HB, Treasure J, Campbell IC. Thinking about eating food activates visual cortex with reduced bilateral cerebellar activation in females with anorexia nervosa: an fMRI study. PLoS ONE. 2012;7:e34000. doi: 10.1371/journal.pone.0034000. [DOI] [PMC free article] [PubMed] [Google Scholar]
- Brooks SJ, O’Daly OG, Uher R, Friederich HC, Giampietro V, Brammer M, Williams SCR, Schiöth HB, Treasure J, Campbell IC. Differential Neural Responses to Food Images in Women with Bulimia versus Anorexia Nervosa. PLoS One. 2011;6 doi: 10.1371/journal.pone.0022259. [DOI] [PMC free article] [PubMed] [Google Scholar]
- Burguera B, Couce ME, Long J, Lamsam J, Laakso K, Jensen MD, Parisi JE, Lloyd RV. The long form of the leptin receptor (OB-Rb) is widely expressed in the human brain. Neuroendocrinology. 2000;71:187–195. doi: 10.1159/000054536. [DOI] [PubMed] [Google Scholar]
- Carmichael ST, Price JL. Connectional networks within the orbital and medial prefrontal cortex of macaque monkeys. J Comp Neurol. 1996;371:179–207. doi: 10.1002/(SICI)1096-9861(19960722)371:2<179::AID-CNE1>3.0.CO;2-#. [DOI] [PubMed] [Google Scholar]
- Chen PS, Yang YK, Yeh TL, Lee I-H, Yao WJ, Chiu NT, Lu RB. Correlation between body mass index and striatal dopamine transporter availability in healthy volunteers--a SPECT study. Neuroimage. 2008;40:275–279. doi: 10.1016/j.neuroimage.2007.11.007. [DOI] [PubMed] [Google Scholar]
- Craig ADB. Significance of the insula for the evolution of human awareness of feelings from the body. Ann N Y Acad Sci. 2011;1225:72–82. doi: 10.1111/j.1749-6632.2011.05990.x. [DOI] [PubMed] [Google Scholar]
- Critchley HD, Mathias CJ, Josephs O, O’Doherty J, Zanini S, Dewar B-K, Cipolotti L, Shallice T, Dolan RJ. Human cingulate cortex and autonomic control: converging neuroimaging and clinical evidence. Brain. 2003;126:2139–2152. doi: 10.1093/brain/awg216. [DOI] [PubMed] [Google Scholar]
- DelParigi A, Chen K, Salbe AD, Reiman EM, Tataranni PA. Sensory experience of food and obesity: a positron emission tomography study of the brain regions affected by tasting a liquid meal after a prolonged fast. NeuroImage. 2005;24:436–443. doi: 10.1016/j.neuroimage.2004.08.035. [DOI] [PubMed] [Google Scholar]
- Faith MS, Butryn M, Wadden TA, Fabricatore A, Nguyen AM, Heymsfield SB. Evidence for prospective associations among depression and obesity in population-based studies. Obes Rev. 2011;12:e438–453. doi: 10.1111/j.1467-789X.2010.00843.x. [DOI] [PubMed] [Google Scholar]
- Flegal KM, Carroll MD, Ogden CL, Curtin LR. Prevalence and Trends in Obesity Among US Adults, 1999-2008. JAMA. 2010;303:235–241. doi: 10.1001/jama.2009.2014. [DOI] [PubMed] [Google Scholar]
- Flegal KM, Carroll MD, Ogden CL, Johnson CL. Prevalence and trends in obesity among US adults, 1999-2000. JAMA. 2002;288:1723–1727. doi: 10.1001/jama.288.14.1723. [DOI] [PubMed] [Google Scholar]
- Freedman LJ, Insel TR, Smith Y. Subcortical projections of area 25 (subgenual cortex) of the macaque monkey. J Comp Neurol. 2000;421:172–188. [PubMed] [Google Scholar]
- García-García I, Jurado MÁ, Garolera M, Segura B, Sala-Llonch R, Marqués-Iturria I, Pueyo R, Sender-Palacios MJ, Vernet-Vernet M, Narberhaus A, Ariza M, Junqué C. Alterations of the salience network in obesity: A resting-state fMRI study. Human Brain Mapping n/a-n/a. 2012 doi: 10.1002/hbm.22104. [DOI] [PMC free article] [PubMed] [Google Scholar]
- Gautier JF, Chen K, Salbe AD, Bandy D, Pratley RE, Heiman M, Ravussin E, Reiman EM, Tataranni PA. Differential brain responses to satiation in obese and lean men. Diabetes. 2000;49:838–846. doi: 10.2337/diabetes.49.5.838. [DOI] [PubMed] [Google Scholar]
- Gautier JF, Del Parigi A, Chen K, Salbe AD, Bandy D, Pratley RE, Ravussin E, Reiman EM, Tataranni PA. Effect of satiation on brain activity in obese and lean women. Obes Res. 2001;9:676–684. doi: 10.1038/oby.2001.92. [DOI] [PubMed] [Google Scholar]
- Gearhardt AN, Yokum S, Orr PT, Stice E, Corbin WR, Brownell KD. Neural Correlates of Food Addiction. Arch Gen Psychiatry. 2011 doi: 10.1001/archgenpsychiatry.2011.32. [DOI] [PMC free article] [PubMed] [Google Scholar]
- Goran M, Fields DA, Hunter GR, Herd SL, Weinsier RL. Total body fat does not influence maximal aerobic capacity. Int J Obes Relat Metab Disord. 2000;24:841–848. doi: 10.1038/sj.ijo.0801241. [DOI] [PubMed] [Google Scholar]
- Gustafson D, Lissner L, Bengtsson C, Björkelund C, Skoog I. A 24-year follow-up of body mass index and cerebral atrophy. Neurology. 2004;63:1876–1881. doi: 10.1212/01.wnl.0000141850.47773.5f. [DOI] [PubMed] [Google Scholar]
- Gustafson D, Rothenberg E, Blennow K, Steen B, Skoog I. An 18-year follow-up of overweight and risk of Alzheimer disease. Arch Intern Med. 2003;163:1524–1528. doi: 10.1001/archinte.163.13.1524. [DOI] [PubMed] [Google Scholar]
- Hamani C, Mayberg H, Stone S, Laxton A, Haber S, Lozano AM. The subcallosal cingulate gyrus in the context of major depression. Biol Psychiatry. 2011;69:301–308. doi: 10.1016/j.biopsych.2010.09.034. [DOI] [PubMed] [Google Scholar]
- Hare TA, Malmaud J, Rangel A. Focusing attention on the health aspects of foods changes value signals in vmPFC and improves dietary choice. J Neurosci. 2011;31:11077–11087. doi: 10.1523/JNEUROSCI.6383-10.2011. [DOI] [PMC free article] [PubMed] [Google Scholar]
- Hayasaka S, Phan KL, Liberzon I, Worsley KJ, Nichols TE. Nonstationary cluster-size inference with random field and permutation methods. Neuroimage. 2004;22:676–687. doi: 10.1016/j.neuroimage.2004.01.041. [DOI] [PubMed] [Google Scholar]
- Hu G, Jousilahti P, Nissinen A, Antikainen R, Kivipelto M, Tuomilehto J. Body mass index and the risk of Parkinson disease. Neurology. 2006;67:1955–1959. doi: 10.1212/01.wnl.0000247052.18422.e5. [DOI] [PubMed] [Google Scholar]
- Jasinska AJ, Ramamoorthy A, Crew CM. Toward a neurobiological model of cue-induced self-control in decision making: relevance to addiction and obesity. J Neurosci. 2011;31:16139–16141. doi: 10.1523/JNEUROSCI.4477-11.2011. [DOI] [PMC free article] [PubMed] [Google Scholar]
- Karason K, Mølgaard H, Wikstrand J, Sjöström L. Heart rate variability in obesity and the effect of weight loss. Am J Cardiol. 1999;83:1242–1247. doi: 10.1016/s0002-9149(99)00066-1. [DOI] [PubMed] [Google Scholar]
- Kimmerly DS, O’Leary DD, Menon RS, Gati JS, Shoemaker JK. Cortical regions associated with autonomic cardiovascular regulation during lower body negative pressure in humans. J Physiol (Lond) 2005;569:331–345. doi: 10.1113/jphysiol.2005.091637. [DOI] [PMC free article] [PubMed] [Google Scholar]
- Kondo H, Saleem KS, Price JL. Differential connections of the temporal pole with the orbital and medial prefrontal networks in macaque monkeys. J Comp Neurol. 2003;465:499–523. doi: 10.1002/cne.10842. [DOI] [PubMed] [Google Scholar]
- Koob GF, Volkow ND. Neurocircuitry of addiction. Neuropsychopharmacology. 2010;35:217–238. doi: 10.1038/npp.2009.110. [DOI] [PMC free article] [PubMed] [Google Scholar]
- Kurrimbux D, Gaffen Z, Farrell CL, Martin D, Thomas SA. The involvement of the blood-brain and the blood-cerebrospinal fluid barriers in the distribution of leptin into and out of the rat brain. Neuroscience. 2004;123:527–536. doi: 10.1016/j.neuroscience.2003.08.061. [DOI] [PubMed] [Google Scholar]
- Kurth F, Levitt JG, Phillips OR, Luders E, Woods RP, Mazziotta JC, Toga AW, Narr KL. Relationships between gray matter, body mass index, and waist circumference in healthy adults. Human brain mapping. 2012 doi: 10.1002/hbm.22021. [DOI] [PMC free article] [PubMed] [Google Scholar]
- Lancaster JL, Woldorff MG, Parsons LM, Liotti M, Freitas CS, Rainey L, Kochunov PV, Nickerson D, Mikiten SA, Fox PT. Automated Talairach atlas labels for functional brain mapping. Hum Brain Mapp. 2000;10:120–131. doi: 10.1002/1097-0193(200007)10:3<120::AID-HBM30>3.0.CO;2-8. [DOI] [PMC free article] [PubMed] [Google Scholar]
- London ED, Berman SM, Chakrapani S, Delibasi T, Monterosso J, Erol HK, Paz-Filho G, Wong M-L, Licinio J. Short-term plasticity of gray matter associated with leptin deficiency and replacement. J Clin Endocrinol Metab. 2011;96:E1212–1220. doi: 10.1210/jc.2011-0314. [DOI] [PMC free article] [PubMed] [Google Scholar]
- Martin LE, Holsen LM, Chambers RJ, Bruce AS, Brooks WM, Zarcone JR, Butler MG, Savage CR. Neural mechanisms associated with food motivation in obese and healthy weight adults. Obesity (Silver Spring) 2010;18:254–260. doi: 10.1038/oby.2009.220. [DOI] [PubMed] [Google Scholar]
- Medford N, Critchley HD. Conjoint activity of anterior insular and anterior cingulate cortex: awareness and response. Brain Struct Funct. 2010;214:535–549. doi: 10.1007/s00429-010-0265-x. [DOI] [PMC free article] [PubMed] [Google Scholar]
- Mesulam MM, Mufson EJ. Insula of the old world monkey. I. Architectonics in the insulo-orbito-temporal component of the paralimbic brain. J Comp Neurol. 1982;212:1–22. doi: 10.1002/cne.902120102. [DOI] [PubMed] [Google Scholar]
- Mufson EJ, Mesulam MM. Insula of the old world monkey. II: Afferent cortical input and comments on the claustrum. J Comp Neurol. 1982;212:23–37. doi: 10.1002/cne.902120103. [DOI] [PubMed] [Google Scholar]
- Nagai M, Hoshide S, Kario K. The insular cortex and cardiovascular system: a new insight into the brain-heart axis. J Am Soc Hypertens. 2010;4:174–182. doi: 10.1016/j.jash.2010.05.001. [DOI] [PubMed] [Google Scholar]
- Ongür D, An X, Price JL. Prefrontal cortical projections to the hypothalamus in macaque monkeys. J Comp Neurol. 1998;401:480–505. [PubMed] [Google Scholar]
- Ongür D, Ferry AT, Price JL. Architectonic subdivision of the human orbital and medial prefrontal cortex. J Comp Neurol. 2003;460:425–449. doi: 10.1002/cne.10609. [DOI] [PubMed] [Google Scholar]
- Ongür D, Price JL. The organization of networks within the orbital and medial prefrontal cortex of rats, monkeys and humans. Cereb Cortex. 2000;10:206–219. doi: 10.1093/cercor/10.3.206. [DOI] [PubMed] [Google Scholar]
- Oppenheimer S. Cortical control of the heart. Cleve Clin J Med. 2007;74(Suppl 1):S27–29. doi: 10.3949/ccjm.74.suppl_1.s27. [DOI] [PubMed] [Google Scholar]
- Oppenheimer SM, Gelb A, Girvin JP, Hachinski VC. Cardiovascular effects of human insular cortex stimulation. Neurology. 1992;42:1727–1732. doi: 10.1212/wnl.42.9.1727. [DOI] [PubMed] [Google Scholar]
- Pannacciulli N, Del Parigi A, Chen K, Le DSNT, Reiman EM, Tataranni PA. Brain abnormalities in human obesity: a voxel-based morphometric study. Neuroimage. 2006;31:1419–1425. doi: 10.1016/j.neuroimage.2006.01.047. [DOI] [PubMed] [Google Scholar]
- Pannacciulli N, Le DSNT, Chen K, Reiman EM, Krakoff J. Relationships between plasma leptin concentrations and human brain structure: a voxel-based morphometric study. Neurosci Lett. 2007;412:248–253. doi: 10.1016/j.neulet.2006.11.019. [DOI] [PMC free article] [PubMed] [Google Scholar]
- Pelchat ML, Johnson A, Chan R, Valdez J, Ragland JD. Images of desire: food-craving activation during fMRI. Neuroimage. 2004;23:1486–1493. doi: 10.1016/j.neuroimage.2004.08.023. [DOI] [PubMed] [Google Scholar]
- Perry JL, Joseph JE, Jiang Y, Zimmerman RS, Kelly TH, Darna M, Huettl P, Dwoskin LP, Bardo MT. Prefrontal cortex and drug abuse vulnerability: translation to prevention and treatment interventions. Brain Res Rev. 2011;65:124–149. doi: 10.1016/j.brainresrev.2010.09.001. [DOI] [PMC free article] [PubMed] [Google Scholar]
- Porubská K, Veit R, Preissl H, Fritsche A, Birbaumer N. Subjective feeling of appetite modulates brain activity: An fMRI study. NeuroImage. 2006;32:1273–1280. doi: 10.1016/j.neuroimage.2006.04.216. [DOI] [PubMed] [Google Scholar]
- Price JL. Prefrontal cortical networks related to visceral function and mood. Ann N Y Acad Sci. 1999;877:383–396. doi: 10.1111/j.1749-6632.1999.tb09278.x. [DOI] [PubMed] [Google Scholar]
- Price JL. Definition of the orbital cortex in relation to specific connections with limbic and visceral structures and other cortical regions. Ann N Y Acad Sci. 2007;1121:54–71. doi: 10.1196/annals.1401.008. [DOI] [PubMed] [Google Scholar]
- Ravussin E, Burnand B, Schutz Y, Jéquier E. Twenty-four-hour energy expenditure and resting metabolic rate in obese, moderately obese, and control subjects. Am J Clin Nutr. 1982;35:566–573. doi: 10.1093/ajcn/35.3.566. [DOI] [PubMed] [Google Scholar]
- Ravussin E, Lillioja S, Anderson TE, Christin L, Bogardus C. Determinants of 24-hour energy expenditure in man. Methods and results using a respiratory chamber. J Clin Invest. 1986;78:1568–1578. doi: 10.1172/JCI112749. [DOI] [PMC free article] [PubMed] [Google Scholar]
- Rempel-Clower NL, Barbas H. Topographic organization of connections between the hypothalamus and prefrontal cortex in the rhesus monkey. J Comp Neurol. 1998;398:393–419. doi: 10.1002/(sici)1096-9861(19980831)398:3<393::aid-cne7>3.0.co;2-v. [DOI] [PubMed] [Google Scholar]
- Rider OJ, Francis JM, Ali MK, Byrne J, Clarke K, Neubauer S, Petersen SE. Determinants of left ventricular mass in obesity; a cardiovascular magnetic resonance study. J Cardiovasc Magn Reson. 2009;11:9. doi: 10.1186/1532-429X-11-9. [DOI] [PMC free article] [PubMed] [Google Scholar]
- Saleem KS, Kondo H, Price JL. Complementary circuits connecting the orbital and medial prefrontal networks with the temporal, insular, and opercular cortex in the macaque monkey. J Comp Neurol. 2008;506:659–693. doi: 10.1002/cne.21577. [DOI] [PubMed] [Google Scholar]
- Seeley WW, Menon V, Schatzberg AF, Keller J, Glover GH, Kenna H, Reiss AL, Greicius MD. Dissociable intrinsic connectivity networks for salience processing and executive control. J Neurosci. 2007;27:2349–2356. doi: 10.1523/JNEUROSCI.5587-06.2007. [DOI] [PMC free article] [PubMed] [Google Scholar]
- Small DM, Zatorre RJ, Dagher A, Evans AC, Jones-Gotman M. Changes in brain activity related to eating chocolate: from pleasure to aversion. Brain. 2001;124:1720–1733. doi: 10.1093/brain/124.9.1720. [DOI] [PubMed] [Google Scholar]
- Stephan E, Pardo JV, Faris PL, Hartman BK, Kim SW, Ivanov EH, Daughters RS, Costello PA, Goodale RL. Functional neuroimaging of gastric distention. J Gastrointest Surg. 2003;7:740–749. doi: 10.1016/s1091-255x(03)00071-4. [DOI] [PubMed] [Google Scholar]
- Taki Y, Kinomura S, Sato K, Inoue K, Goto R, Okada K, Uchida S, Kawashima R, Fukuda H. Relationship Between Body Mass Index and Gray Matter Volume in 1,428 Healthy Individuals. Obesity. 2008;16:119–124. doi: 10.1038/oby.2007.4. [DOI] [PubMed] [Google Scholar]
- Tomasi D, Wang G-J, Wang R, Backus W, Geliebter A, Telang F, Jayne MC, Wong C, Fowler JS, Volkow ND. Association of Body Mass and Brain Activation during Gastric Distention: Implications for Obesity. PLoS ONE. 2009;4:e6847. doi: 10.1371/journal.pone.0006847. [DOI] [PMC free article] [PubMed] [Google Scholar]
- Vandenbergh J, Dupont P, Fischler B, Bormans G, Persoons P, Janssens J, Tack J. Regional brain activation during proximal stomach distention in humans: A positron emission tomography study. Gastroenterology. 2005;128:564–573. doi: 10.1053/j.gastro.2004.11.054. [DOI] [PubMed] [Google Scholar]
- VanItallie TB, Yang MU, Heymsfield SB, Funk RC, Boileau RA. Height-normalized indices of the body’s fat-free mass and fat mass: potentially useful indicators of nutritional status. Am J Clin Nutr. 1990;52:953–959. doi: 10.1093/ajcn/52.6.953. [DOI] [PubMed] [Google Scholar]
- Vasan RS. Cardiac function and obesity. Heart. 2003;89:1127–1129. doi: 10.1136/heart.89.10.1127. [DOI] [PMC free article] [PubMed] [Google Scholar]
- Volkow ND, Wang G-J, Fowler JS, Telang F. Overlapping neuronal circuits in addiction and obesity: evidence of systems pathology. Philos Trans R Soc Lond B Biol Sci. 2008;363:3191–3200. doi: 10.1098/rstb.2008.0107. [DOI] [PMC free article] [PubMed] [Google Scholar]
- Volkow ND, Wang G-J, Telang F, Fowler JS, Goldstein RZ, Alia-Klein N, Logan J, Wong C, Thanos PK, Ma Y, Pradhan K. Inverse association between BMI and prefrontal metabolic activity in healthy adults. Obesity (Silver Spring) 2009;17:60–65. doi: 10.1038/oby.2008.469. [DOI] [PMC free article] [PubMed] [Google Scholar]
- Volkow ND, Wang G-J, Telang F, Fowler JS, Thanos PK, Logan J, Alexoff D, Ding YS, Wong C, Ma Y, Pradhan K. Low dopamine striatal D2 receptors are associated with prefrontal metabolism in obese subjects: possible contributing factors. Neuroimage. 2008;42:1537–1543. doi: 10.1016/j.neuroimage.2008.06.002. [DOI] [PMC free article] [PubMed] [Google Scholar]
- Walther K, Birdsill AC, Glisky EL, Ryan L. Structural brain differences and cognitive functioning related to body mass index in older females. Human brain mapping. 2010;31:1052–1064. doi: 10.1002/hbm.20916. [DOI] [PMC free article] [PubMed] [Google Scholar]
- Wang G-J, Yang J, Volkow ND, Telang F, Ma Y, Zhu W, Wong CT, Tomasi D, Thanos PK, Fowler JS. Gastric stimulation in obese subjects activates the hippocampus and other regions involved in brain reward circuitry. Proc Natl Acad Sci USA. 2006;103:15641–15645. doi: 10.1073/pnas.0601977103. [DOI] [PMC free article] [PubMed] [Google Scholar]
- Wang GJ, Volkow ND, Logan J, Pappas NR, Wong CT, Zhu W, Netusil N, Fowler JS. Brain dopamine and obesity. Lancet. 2001;357:354–357. doi: 10.1016/s0140-6736(00)03643-6. [DOI] [PubMed] [Google Scholar]
- Weston CSE. Another major function of the anterior cingulate cortex: the representation of requirements. Neurosci Biobehav Rev. 2012;36:90–110. doi: 10.1016/j.neubiorev.2011.04.014. [DOI] [PubMed] [Google Scholar]
- Whalley GA, Gamble GD, Doughty RN, Culpan A, Plank L, MacMahon S, Sharpe N. Left ventricular mass correlates with fat-free mass but not fat mass in adults. J Hypertens. 1999;17:569–574. doi: 10.1097/00004872-199917040-00016. [DOI] [PubMed] [Google Scholar]
- Whitwell JL, Sampson EL, Loy CT, Warren JE, Rossor MN, Fox NC, Warren JD. VBM signatures of abnormal eating behaviours in frontotemporal lobar degeneration. Neuroimage. 2007;35:207–213. doi: 10.1016/j.neuroimage.2006.12.006. [DOI] [PubMed] [Google Scholar]
- Wong SW, Massé N, Kimmerly DS, Menon RS, Shoemaker JK. Ventral medial prefrontal cortex and cardiovagal control in conscious humans. Neuroimage. 2007;35:698–708. doi: 10.1016/j.neuroimage.2006.12.027. [DOI] [PubMed] [Google Scholar]
- Woo MA, Kumar R, Macey PM, Fonarow GC, Harper RM. Brain injury in autonomic, emotional, and cognitive regulatory areas in patients with heart failure. J Card Fail. 2009;15:214–223. doi: 10.1016/j.cardfail.2008.10.020. [DOI] [PMC free article] [PubMed] [Google Scholar]
- Yokum S, Ng J, Stice E. Relation of regional gray and white matter volumes to current BMI and future increases in BMI: a prospective MRI study. Int J Obes (Lond) 2012;36:656–664. doi: 10.1038/ijo.2011.175. [DOI] [PMC free article] [PubMed] [Google Scholar]
- Zhu J-N, Wang J-J. The cerebellum in feeding control: possible function and mechanism. Cell Mol Neurobiol. 2008;28:469–478. doi: 10.1007/s10571-007-9236-z. [DOI] [PMC free article] [PubMed] [Google Scholar]