

Abstract
Work on facial expressions of emotions (Calder et al, 2001) and emotionally inflected speech (Banse & Scherer, 1996) has successfully delineated some of the physical properties that underlie emotion recognition. To identify the acoustic cues used in the perception of non-verbal emotional expressions like laugher and screams, an investigation was conducted into vocal expressions of emotion, using non-verbal vocal analogues of the ‘basic’ emotions (anger, fear, disgust, sadness and surprise; Ekman & Friesen, 1971; Scott et al, 1997), and of positive affective states (Ekman, 1992, 2003; Sauter & Scott, 2007). First, the emotional stimuli were categorized and rated to establish that listeners could identify and rate the sounds reliably, and to provide confusion matrices. A principal components analysis of the rating data yielded two underlying dimensions, correlating with the perceived valence and arousal of the sounds. Second, acoustic properties of the amplitude, pitch and spectral profile of the stimuli were measured. A discriminant analysis procedure established that these acoustic measures provided sufficient discrimination between expressions of emotional categories to permit accurate statistical classification. Multiple linear regressions with participants’ subjective ratings of the acoustic stimuli showed that all classes of emotional ratings could be predicted by some combination of acoustic measures, and that most emotion ratings were predicted by different constellations of acoustic features. The results demonstrate that, similarly to affective signals in facial expressions and emotionally inflected speech, the perceived emotional character of affective vocalizations can be predicted on the basis of their physical features.
Keywords: emotion, voice, vocalizations, acoustics, non-verbal behaviour
Introduction
Humans express emotion via a variety of channels, including the visual and auditory modalities. For example, different emotions are communicated through distinct patterns of facial musculature (Ekman & Rosenberg, 2005). Recognition of the ‘basic’ emotions (fear, anger, disgust, sadness, happiness and surprise) from photographs of facial expressions is generally good (Ekman and Friesen, 1971), though some emotions are systematically confused (e.g. fear with surprise, anger with disgust) (Calder, Burton, Miller, Young, & Akamatsu, 2001). There is also evidence that these ‘basic’ facial expressions are recognized across different cultures (Ekman 1994; Ekman, Sorenson, & Friesen, 1969; Elfenbein & Ambady 2002; but see Russell 1994). In terms of perceptual processing, the output of a principal components analysis (PCA) of the pixel intensities of photographs of a set of basic facial expressions of emotion has been shown to successfully support automatic facial emotion recognition (Calder et al, 2001). This finding suggests that different emotional states in the face are expressed with specific visual properties, which may in turn reflect candidate visual properties used in human perceptual processing (Calder et al, 2001).
In addition to the face, emotions are expressed using bodily posture, gestures and vocal cues (Atkinson, Tunstall, & Dittrich, 2007; Atkinson, Dittrich, Gemmell & Young, 2004; Scherer, 2003). The human voice is a particularly interesting channel, since it simultaneously transmits information about the speaker’s body size, sex, age, social class, geographical origin and emotional state, often in parallel with linguistic meaning (Karpf, 2006). Research has established that there are vocal correlates of the established facial emotional expressions of anger, fear, disgust, happiness, sadness, and surprise, and that these are expressed both in emotional speech (Murray & Arnott, 1993; Scherer, Banse, & Wallbott, 2001) and as non-verbal vocal expressions (Scott, Young, Calder, Hellawell, Aggleton, & Johnson, 1997).
The main differences between emotionally inflected speech, and non-verbal vocal expressions of emotion (e.g., laughs, sobs, or screams), are to do with their production. Speech production relies on fast, precise, coordinated actions of the supralaryngeal articulators, which are synchronized with the movements of the larynx and the sub-glottal pressure to ensure that, for example, the onset of voicing is correct at the start of a voiced plosive like /b/. In emotional states, cues associated with voice quality, loudness and pitch give the emotional speech its affective quality (Murray & Arnott, 1993). Unlike speech production, non-verbal expressions of emotion do not involve detailed supra-laryngeal movements - there are no precise articulations. Instead, emotional vocalizations reflect the sound produced at the larynx being shaped by roughly positioned pharyngeal/oral/labial constrictions. A sound like laughter, for example, has been described as more like a way of modified breathing than it is like a way of speaking (Kohler, 2008). An aim of the current paper is to establish the acoustic properties that give non-verbal emotional expressions their affective qualities. Non-verbal emotional vocalizations have been previously characterized as ‘affect bursts’ (Scherer, 1994). This label is not used in the current study since the term ‘burst’ connotes specific acoustic qualities (such as brevity and rapid onsets), whereas the current study sought to empirically investigate acoustic properties in different emotional vocalizations.
Non-verbal vocal expressions have been used in previous experimental, neuropsychological and functional imaging studies of emotional processing (Calder, Keane, Manes, Antoun, & Young, 2000; Calder, Keane, Lawrence, & Manes, 2004; Carroll & Young, 2005; Morris, Scott, & Dolan, 1999; Schröder, 2003; Scott et al., 1997; Warren, Sauter, Eisner, Wiland, Dresner, Wise, Rosen, & Scott, 2006). Non-verbal vocal expressions of emotion tend to be better recognized than emotional speech stimuli reflecting the same emotion, especially for fear (Scott et al., 1997) and disgust (Banse & Scherer, 1996; Scott et al., 1997). This may be because in some emotional states, a non-verbal expression may be more likely to be produced than emotionally inflected speech (Banse & Scherer, 1996).
In terms of the acoustics of vocal expressions of emotion in the voice, most previous work has investigated emotional speech – that is, spoken language that is produced with affective cues (Juslin & Laukka, 2003; Murray & Arnott, 1993). A detailed study of the acoustics of emotion in nonsense-speech found that a battery of acoustic measures could be used to both predict judges’ ratings of the emotional expressions, and to automatically classify to sentences into different emotional categories (Banse & Scherer, 1996). Within this, the study found that different acoustic cues were differentially important for the different emotions. For example, higher ratings for ‘panic fear’ and ‘despair’ were associated with higher mean pitch, while higher ratings for boredom, pride and contempt were associated with lower mean pitch. Spectral properties were also important: high ratings for ‘hot anger’ were associated with larger differences between the spectral energy from 0-2000Hz and from 2000-5000Hz, and higher ratings for ‘elation’ were associated with higher proportions of energy over 1000Hz. Lower intensity (which relates to perceptual loudness) was important for the ratings of ‘shame’ and ‘sadness’. A similar pattern, demonstrating important roles for pitch, spectral profile and loudness as correlates of different affective states in speech has been reported in a more recent study (Juslin & Laukka, 2001), and consequent experimental studies have confirmed that pitch is an important cue in the recognition of emotion in speech (Bänziger & Scherer, 2005).
In contrast, the relationship between the perception of emotion in non-verbal vocal signals and their acoustic profile has not been systematically established. Schröder (2003) investigated the ability of listeners to classify the emotional content of non-verbal vocalizations and to transcribe them. A range of emotional vocalizations were used, including non-verbal vocalizations such as laughter, and verbal utterances such as “yuck”. Although there was some variability across emotions, the overall recognition rate across the 10 categories was 81%, suggesting that emotions could be recognized well from the non-verbal vocalizations (in contrast, the mean recognition rate in Banse and Scherer’s 1996 study of emotional speech was 55%). Schröder (2003) derived a taxonomy for the classification of such non-verbal vocalizations of emotion in terms of phonetic transcriptions of their segmental structure, voice quality, and intonation. However, a statistical analysis of the acoustic properties of the sounds was not performed. Schröder’s findings suggest that listeners can determine systematic phonological differences between different types of non-verbal emotional signals. However, it remains to be established what the acoustic bases of non-verbal expressions of emotions are, how these differences relate to listeners’ ratings of the emotional properties of the sounds, and whether or not these relate to the acoustic bases of emotional inflections in spoken language.
In contrast to the hypothesis that different affective states can be inferred from specific categories of emotional vocalizations, it has been suggested that “speech acoustics provide an external cue to the level of non-specific arousal associated with emotional processes” (Bachorowski, 1999, p. 55). The emphasis on underlying emotional dimensions, rather than specific emotional categories follows the argument that both facial and vocal emotional expressions may be better characterized in terms of a limited number of dimensions (e.g., Russell, 1980) rather than a categorical (or ‘basic’) model of emotion (e.g., Ekman, 2003). Typically, dimensional accounts define emotional states in terms of arousal and valence (Russell, 1980) or approach/avoidance (Davidson, 1992). In a series of studies investigating vocal expressions, Bachorowski and colleagues provided support for Russell’s dimensional account (Bachorowski & Braaten, 1994; Bachorowski & Owren, 1995), and significant acoustic correlates of affective dimensions such as activation, valence, intensity and potency have also been determined in emotionally inflected speech (Laukka, Juslin & Bresin, 2005). Work in the expression of emotion in faces has also shown that the dimensions of perceived valance and arousal have correlates in the statistical patterns of visual information of the facial expressions (Calder et al, 2001). No work so far has determined the extent to which dimensions such as arousal and valence dimensions have acoustic correlates in non-verbal emotional vocalizations.
The aim of the current paper was to establish how the acoustic properties of non-verbal emotional vocalizations relate to psychological categories and participants’ ratings, across a range of positive and negative emotions. Specifically, we sought to identify patterns of physical properties that were associated with participants’ ratings and categorizations of the stimuli, as has been established for emotion in the face (Calder et al., 2001) and for emotion in speech (Banse & Scherer, 1996; Juslin & Laukka, 2001). In the first experiments, categorization and rating paradigms were used to establish that these stimuli were well recognized, and to acquire categorization and ratings judgments of the stimuli. Principal component analysis (PCA) was used to investigate whether the perceived arousal and valence might underlie participants’ ratings of non-verbal vocal expressions. In the second part of the study, a discriminant analysis was used to establish whether the emotional sounds could be assigned to emotional categories on the basis of their individual acoustic profiles, as has been determined for emotional speech (Banse & Scherer, 1996). The acoustic properties of the emotional stimuli were then used to predict the listeners’ ratings of specific emotion categories and of the perceived arousal and valence of the sounds.
Study 1
Method
Stimulus preparation and pilot
Naïve listeners can reliably recognize non-verbal vocal expressions of different negative (e.g., Scott et al., 1997) and positive (Sauter & Scott, 2007) emotional states. In the current study both negative and positive emotions were included. The stimuli thus included exemplars of the commonly studied ‘basic’ emotions (e.g., Ekman, 1992) fear, anger, disgust, and sadness, and surprise (Ekman & Friesen, 1971), and exemplars of the positive emotions achievement/triumph, amusement, contentment, sensual pleasure, and relief (Sauter & Scott, 2007).
Multiple recordings of non-verbal vocal expressions of ten emotions (achievement/triumph, amusement, anger, contentment, disgust, fear, sensual pleasure, relief, sadness, and surprise) were made in an anechoic chamber1. The speakers were two male and two female native British English speakers with no formal performance training. Acted (rather than spontaneous) portrayals are commonly used in studies of vocal signals of emotion. In a review by Juslin and Laukka (2003), 87% of studies on emotional vocalizations used acted portrayals. In the current study, it was of particular importance to obtain recordings of good quality in order to allow the acoustic analyses in Study 2, necessitating the use of acted portrayals.
Speakers were presented with appropriate scenarios for each emotion (see Appendix A) and were asked to produce a variety of sounds, but no explicit guidance or exemplars were given as to the precise sort of sounds they should generate (to avoid artifactual stimulus consistency). However, the speakers were instructed not to produce ‘verbal’ items (i.e., signals with lexical identity and overt articulation, such as ‘phew!’, ‘yippee!’, ‘yuck’ etc.). Each speaker produced approximately 15 sounds per category. The sounds were recorded with a Brüel & Kjaer 4165 microphone and digitized at a 48 kHz sampling rate with 16-bit quantization. This methodology differs from Schröder’s (2003) study of non-verbal vocalizations of emotions, where speakers produced only three tokens per emotional class, with two of the three tokens generated by imitation.
All of the stimuli were then pilot tested on 10 participants, who performed a forced-choice task that was procedurally identical to the main study (see below). This method was used to identify and remove the stimuli that were least well recognized; many such stimuli were due to poor production, as the speakers often found it difficult initially to produce some classes of stimuli on command (e.g., sensual pleasure), and also spent some time trying different sounds (e.g., achievement/triumph). The preselection of stimuli based on the results of pilot tests is commonly performed in emotional expression studies (e.g., Banse & Scherer, 1996) to avoid experimenter bias that would arise from a more subjective stimulus selection procedure. A test set of 10 tokens for each category was chosen, on the basis of the recognition scores from the pilot study. To aim for an even stimulus recognition standard, the stimuli for each emotion category were selected to match recognition rates as closely as possible to the overall average recognition rate of 78%. All speakers were represented in each set of stimuli for each emotion, with the exception of male speaker 1 for anger, and male speaker 2 for sensual pleasure. The stimuli used in the categorization and rating tasks were thus 100 non-verbal emotion sounds with equal numbers expressing each of the emotions achievement/triumph, amusement, anger, contentment, disgust, fear, sensual pleasure, relief, sadness, and surprise. Examples of the stimuli are available at http://www.icn.ucl.ac.uk/speech/emotion/ehome.html.
Participants
Twenty participants (10 males, mean age 21) took part in the categorization experiment and another 20 listeners (11 males, mean age 25) in the rating tasks. All were recruited from the University College London Psychology participant database. None had taken part in any other studies involving emotional sounds, including the pilot study.
Design and procedure
Categorization task
Each stimulus was played once in random order through headphones from a laptop computer running a Psyscope program (Cohen et al., 1993). Participants were asked to categorize each emotional sound by pressing one of ten number keys (0-9) corresponding to the 10 emotion labels achievement/triumph, amusement, anger, contentment, disgust, fear, sensual pleasure, relief, sadness, and surprise. A sheet of paper was provided next to the computer, which gave an example for each emotion label (see Appendix A). Participants were given as much time as they required to make their decision, and no feedback regarding the accuracy of the responses was provided.
Rating tasks
A second group of participants were asked to rate the stimuli. The format and method of presentation in the ratings task was the same as in the categorization task. There were 12 rating scales, one for each of the ten emotions, and two additional scales for arousal and valence. Each stimulus was presented once in each rating task, with presentation order randomized between participants and between scales. Participants were asked to judge the extent to which each stimulus expressed the given dimension on a 7-point scale. For the valence scale, 1 denoted highly negative valence and 7 denoted highly positive valence; for all other scales 1 denoted minimum and 7 maximum. The rating scales were completed in a different random order for each subject. Each stimulus was presented 12 times, once for each rating scale. Participants were allowed to take breaks as they wished.
Results
Categorization
Participants were successful at identifying the sounds, that is, the most commonly selected response was the appropriate one for each category of vocal expression. Chi-squared analyses of the raw categorization data revealed that the participants were significantly better than chance at matching sounds and labels for each stimulus type when tested against all other emotions (chance 10%; see Table 1). The confusion matrix for the categorization data is shown in Table 2. The most common errors included anger sounds categorized as signaling disgust, surprise sounds perceived to communicate disgust or relief, and confusions between contentment and sensual pleasure (see also Table 5). Another relatively common confusion was the classification of fear sounds as amusement. This was largely due a sub-set of the fear sounds being perceived as amused, rather than a generalized tendency across all the fear stimuli.
Table 1.
Chi-square values for the categorization of positive and negative emotional vocalizations, all significant at p < 0.0001, Bonferroni corrected. Df = Degrees of freedom.
| Emotion | Chi (df = 2) |
|---|---|
| Achievement/Triumph | 931.6 |
| Amusement | 988.1 |
| Anger | 736.1 |
| Contentment | 646.4 |
| Disgust | 1396.9 |
| Fear | 707.6 |
| Pleasure | 730.0 |
| Relief | 1158.4 |
| Sadness | 784.4 |
| Surprise | 646.4 |
Table 2.
Categorization of positive and negative emotional vocalizations (%). Horizontal rows add to 100. Correct categorizations are shown in bold. Ach = Achievement/Triumph, Amu = Amusement, Ang = Anger, Cont = Contentment, Dis = Disgust, Ple = Pleasure, Rel = Relief, Sad = Sadness, Surp = Surprise
| Stimulus Type | Response | |||||||||
|---|---|---|---|---|---|---|---|---|---|---|
|
| ||||||||||
| Ach | Amu | Ang | Cont | Dis | Fear | Ple | Rel | Sad | Surp | |
| Ach | 77.0 | 5.0 | 1.5 | 3.5 | 0.5 | 2.5 | 1.5 | 0.0 | 0.0 | 8.5 |
| Amu | 0.0 | 79.5 | 0.5 | 6.0 | 0.0 | 0.0 | 7.0 | 0.5 | 5.5 | 1.0 |
| Ang | 2.5 | 1.0 | 65.5 | 1.5 | 16.5 | 9.5 | 1.0 | 1.0 | 1.0 | 0.5 |
| Cont | 4.0 | 4.0 | 2.5 | 46.0 | 2.0 | 0.0 | 29.0 | 10.5 | 1.0 | 1.0 |
| Dis | 0.0 | 0.5 | 2.5 | 0.5 | 93.5 | 2.0 | 0.0 | 0.0 | 1.0 | 0.0 |
| Fear | 1.5 | 13.5 | 0.5 | 0.5 | 1.5 | 63.0 | 4.0 | 1.5 | 12.0 | 2.0 |
| Ple | 0.0 | 1.0 | 0.5 | 15.0 | 2.0 | 0.5 | 65.0 | 10.5 | 3.5 | 2.0 |
| Rel | 1.0 | 0.0 | 2.0 | 3.5 | 2.5 | 0.0 | 2.5 | 86.0 | 2.0 | 0.5 |
| Sad | 0.0 | 0.5 | 0.5 | 5.5 | 2.0 | 9.5 | 6.5 | 6.5 | 69.0 | 0.0 |
| Surp | 1.5 | 1.0 | 4.5 | 0.0 | 14.0 | 10.0 | 1.0 | 13.0 | 1.0 | 54.0 |
Table 5.
Common confusions for human listeners, standard discriminant and jack-knife analysis in the categorization of emotional sounds, showing all categories that comprise over 5% over responses to a given stimulus category. For cases where no confusions reached 5%, the most common confusion category is shown. All results in %. Stim = stimulus type, Ach = Achievement/Triumph, Amu = Amusement, Ang = Anger, Cont = Contentment, Dis = Disgust, Ple = Pleasure, Rel = Relief, Sad = Sadness, Surp = Surprise.
| Stim | Common confusions | ||
|---|---|---|---|
|
| |||
| Human listeners | Discriminant analysis | Jack-knife analysis | |
| Ach | Surp (9) | Ang (12), Fea (12) | Ang (12), Fea (12) |
| Amu | Ple (7), Con (6), Sad (6) | Con (12), Sad (12) | Sad (18), Con (12), Rel (12) |
| Ang | Dis (17), Fea (10) | Dis (19), Fea (13) | Dis (19), Fea (13) |
| Con | Ple (29), Rel, (11) | Ple (29), Rel (18), Sad (12) | Ple (29), Rel (18), Sad (12) |
| Dis | Ang (3) | Ang (19), Rel (13) | Ang (19), Rel (13) |
| Fea | Amu (14), Sad (12) | Ach (31), Ang (25) | Ach (31), Ang (25) |
| Ple | Con (15), Rel (11) | Con (12), Rel (12), Sur (12) | Con (12), Rel (12), Sur (12) |
| Rel | Con (4) | Con (18) | Con (18) |
| Sad | Fea (10), Ple (7), Rel (7) | Amu (19), Sur (13) | Amu (19), Ple (13), Sur (13) |
| Sur | Dis (14), Rel (13), Fear (10) | Dis (6), Fea (6), Rel (6) | Dis (19), Rel (19), Fea (13) |
Ratings
The results from the rating tasks are displayed in Table 3. These were analyzed first to establish that the different classes of emotional stimuli significantly affected participants’ ratings of the stimuli, and second to test whether sounds expressing the intended emotion (e.g., disgust) were most highly rated on that rating scale. Finally, the rating scales for arousal and valence were analyzed with separate repeated measures ANOVAs, to determine whether the stimuli were perceived to vary along these dimensions.
Table 3.
Ratings of positive and negative non-verbal emotional vocalizations (1 = minimum, 7 = maximum). Ratings on own scale are shown in bold. Ach = Achievement/Triumph, Amu = Amusement, Ang = Anger, Cont = Contentment, Dis = Disgust, Ple = Pleasure, Rel = Relief, Sad = Sadness, Surp = Surprise, Val = Valence, Aro = Arousal.
| Stimulus type | Rating scale | |||||||||||
|---|---|---|---|---|---|---|---|---|---|---|---|---|
|
| ||||||||||||
| Ach | Amu | Ang | Cont | Dis | Fear | Ple | Rel | Sad | Surp | Val | Aro | |
| Ach | 6.34 | 4.7 | 1.4 | 4.47 | 1.19 | 1.24 | 4.15 | 4.46 | 1.32 | 4.32 | 6.17 | 5.96 |
| Amu | 3.81 | 5.61 | 1.37 | 4.02 | 1.36 | 1.48 | 3.77 | 3.21 | 1.87 | 3.17 | 5.15 | 4.82 |
| Anger | 1.76 | 1.51 | 5.5 | 1.63 | 3.88 | 2.83 | 1.59 | 1.75 | 2.06 | 1.96 | 2.13 | 5.2 |
| Cont | 3.24 | 2.52 | 1.51 | 5.28 | 1.45 | 1.31 | 4.68 | 3.65 | 1.75 | 2.05 | 4.64 | 2.88 |
| Dis | 1.34 | 1.37 | 2.96 | 1.52 | 5.87 | 1.79 | 1.37 | 1.38 | 1.71 | 1.87 | 1.88 | 4.08 |
| Fear | 1.91 | 2.22 | 2.04 | 1.87 | 2.99 | 5.11 | 1.96 | 1.75 | 3.21 | 2.84 | 2.62 | 4.93 |
| Plea | 2.77 | 2.32 | 1.33 | 5.22 | 1.35 | 1.49 | 5.69 | 3.77 | 2.27 | 2.29 | 4.81 | 2.72 |
| Relief | 2.97 | 1.81 | 1.88 | 3.45 | 1.87 | 1.65 | 3.39 | 5.32 | 2.35 | 2.23 | 3.84 | 2.64 |
| Sad | 1.47 | 1.34 | 1.52 | 1.75 | 2.16 | 2.71 | 1.88 | 1.77 | 5.05 | 1.77 | 2.05 | 3.05 |
| Surp | 2.74 | 2.16 | 2.77 | 2.35 | 3.17 | 3.18 | 2.45 | 3.03 | 2.08 | 4.61 | 3.31 | 4.58 |
The ANOVAs for each rating scale were significant (F(9,171) = 75.94 for achievement/triumph, 76.40 for amusement, 79.75 for anger, 71.01 for contentment, 89.39 for disgust, 64.56 for fear, 65.93 for sensual pleasure, 47.58 for relief, 68.77 for sadness, and 43.07 for surprise; all p < 0.0001, Bonferroni corrected). This indicates that there was significant variation on the emotional rating scales for the different stimulus types.
To test whether the ‘correct’ stimulus type for each scale was also rated significantly more highly than the mean of the other emotion classes, planned comparisons were performed for each separate ANOVA, contrasting the sounds expressing the intended emotion (e.g. anger) with the other nine vocal emotional expression conditions. These were significant for each emotional rating scale, (t(19) = 17.20 for achievement/triumph, 16.68 for amusement, 14.08 for anger, 11.41 for contentment, 19.43 for disgust, 15.52 for fear, 14.20 for sensual pleasure, 8.76 for relief, 19.51 for sadness, and 9.10 for surprise; all p < 0.0001, Bonferroni corrected).
Separate ANOVAs were performed on the ratings for arousal and valence. The results indicated that there was significant variation across both scales with emotional stimulus condition (F(9,171) = 53.33, for arousal and 77.06 for valence, both p < 0.0001).
Principal component Analysis
To determine whether a smaller number of dimensions could account for a significant proportion of the variance in participants’ ratings, the mean ratings for each stimulus on all of the scales except arousal and valence were subjected to a principal components analysis (PCA). Arousal and valence ratings were not included, to ensure that any association between the resultant factors and these dimensions was not biased. The analysis yielded two factors with eigenvalues over 1, accounting for 53.3% and 15.7% of the variance, respectively. Component 1 correlated highly with the participants’ valence ratings (r = .97) and Component 2 correlated with the participants’ arousal ratings (r = .87). Figure 1 shows a these two components from the PCA plotted against one another, and also a plot of the participants’ original ratings on the arousal and valence scales.
Figure 1.
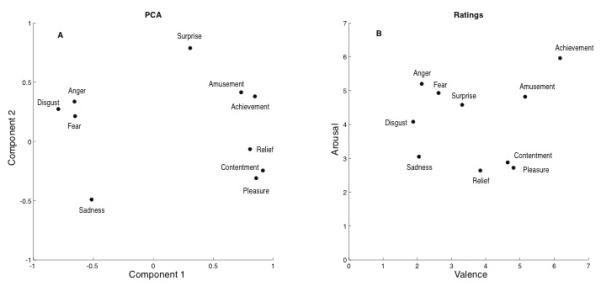
A) Principal component analysis for positive and negative emotional vocalizations. B) Average ratings on the dimensions arousal and valence for each category of emotional sounds (n=20).
Discussion
The results from the categorization and rating tasks indicate that the negative emotions fear, anger, disgust, sadness, the positive emotions achievement/triumph, amusement, relief, and sensual pleasure, and the neutral emotion surprise, have recognizable vocal non-verbal expressions. In contrast, a fifth candidate positive emotion, contentment, was consistently confused with sensual pleasure, and was possibly being perceived as a weaker form of sensual pleasure. Although contentment and sensual pleasure are not strongly linked semantically (i.e., they are not synonyms), it is possible that they are associated with generally similar acoustic profiles and disambiguated on the basis of subtle acoustic cues or by context in real-life situations. Alternatively, it is possible that contentment is simply not a “real” emotional category, or that participants in the current study did not recognize the contentment stimuli reliably because the exemplars used were of less good quality than the other emotion categories.
The PCA indicated that the two dimensions that correlated strongly with valence and arousal accounted for a total of 69% of the variance in the rating data. Notably, the two factors were unequal in their contribution (53% for the factor that correlated with valence ratings and 16% for the factor that correlated with perceived arousal). Previous studies that have applied a dimensional approach to emotional vocalizations have focused mainly on the important role of arousal (see Bachorowski, 1999), while the current study found a dominant role for valence. For example, a study by Bänziger and Scherer (2005) examined the relationship between the pitch contour of emotional nonsense-speech and the perceived level of emotional arousal. While they found a significant relationship between these variables, the study did not report whether there was a relationship with perceived valence. Two earlier studies by Bachorowski and colleagues measured perturbations in pitch and loudness in participants’ speech production during the performance of a difficult task. Their results showed that both the participants’ own arousal and the valence of the feedback on their performance were reflected in these acoustic cues (Bachorowski & Braaten, 1994; Bachorowski & Owren, 1995).
Study 2
Acoustic analyses
In the categorization and ratings experiments, a set of non-verbal vocalizations were identified that could be accurately categorized and rated by naive participants. The second study investigated whether different classes of emotional vocalizations could be distinguished on the basis of their acoustic properties alone, and whether the acoustical properties of the sounds reflected aspects of the listeners’ judgments. This has been done for ratings of emotional speech (Banse & Scherer, 1996), with considerable success – acoustic cues which predicted participants’ use of emotional categories were identified, using multiple regression, for eleven out of fourteen different classes of emotional speech. Similarly, Juslin and Laukka (2001) measured 20 voice cues of speech with weak and strong intensity in five emotions. They found that participants’ emotional ratings of the sounds could be predicted reliably by the acoustic cues. Work on facial expressions of emotion has also had success in identifying relationships between the statistical constellations of facial images and emotional states. Calder et al. (2001) performed a principal component analysis (PCA) of the pixel intensities of images of facial expressions of emotions. They found that a set of principal components (PCs) could both categorize individual emotions effectively and capture their rated values on arousal and valence dimensions (see also Dailey, Cotrell, Padgett, & Adolphs, 2002).
In Study 2, an acoustic analysis of the non-verbal emotional vocalizations was performed, in order to describe the ways in which sounds from different categories vary on a number of acoustic features. As in previous work (Banse & Scherer, 1996; Juslin & Laukka, 2001), three broad domains of auditory features were analyzed: amplitude, pitch, and the spectral properties of the stimuli. Amplitude cues included measurements of intensity, aspects of the amplitude envelope and duration. Pitch cues included mean pitch and pitch variation. Spectral cues included the spectral centre of gravity and the variation of the frequencies in the spectrum.
To determine whether these measurements capture sufficient detail of the sounds to classify them, discriminant analysis procedures were employed. In a second set of analyses, the acoustic measurements were used in a series of multiple linear regressions to determine whether linear combinations of these measurements could predict the emotional ratings of the stimuli from Study 1. The aim was to identify which patterns of acoustic variation were associated with the perceived emotional contents of the sounds. To summarize, two procedures were used to capture psychophysical properties of the emotional vocalizations: discriminant analysis to assess whether acoustic qualities can sort stimuli on the basis of the actor’s intent, and linear regressions to assess whether the listeners’ judgments on emotional rating scales could be predicted from acoustic qualities.
Method
Stimulus Measurements
Measurements were taken of acoustic parameters from an extended set of 165 sound files from the same corpus used in Study 1 (16 – 17 of each emotion) using the PRAAT program (Boersma & Weenink, 2005). A larger set than the one used in Study 1 was selected to increase the power of the discriminant analyses. Only the sounds that were used in Study 1 were entered into the regression analyses. All sounds were downsampled to 44.1 kHz and scaled to have the same peak amplitude (0.291 Pa; the mean peak amplitude of the original recordings) prior to the analysis. This was necessary since the wide dynamic range of the original stimuli meant that the recording levels were different across the different emotional conditions. It still permits the analysis of amplitude variation, which is computed across the whole waveform.
The set of acoustic measurements consisted of metrics that are commonly used for describing human vocalisations, in particular speech, and were expected to be broad enough to be applicable across all categories of emotional vocalisations in the current study. In the amplitude domain, duration, standard deviation and mean intensity (dB SPL scale) were obtained from the waveform. Second, the number of amplitude onsets per sound file was counted, using an algorithm that detects local rises in the smoothed amplitude envelope (Cummins & Port, 1998; Scott, 1993). This gives an estimate of the number of ‘syllables’ (i.e., separate perceptual centres) in a vocalization (Morton, Marcus, & Frankish, 1976). To this end, the signal was first band-pass filtered (Hanning filter centred at 2.2 kHz with a bandwidth of 3.6 kHz), full-wave rectified, and smoothed (Hanning low-pass filter with an 8-Hz cut-off) before obtaining the first derivative of the smoothed envelope. Onsets were then defined as points in time at which (a) a set threshold in the amplitude envelope was exceeded and (b) the derivative curve had a positive value.
Pitch measurements were based on a derived curve representing change in fundamental frequency as a function of time (using a 75 – 1000 Hz analysis window and the autocorrelation method described in Boersma, 1993). From this, pitch minimum, maximum, mean, and standard deviation were obtained. Global pitch movement was defined as the difference between the mean pitch values of the first and last 20% of the sound file. However, pitch movement was discarded as a variable, as this measurement could not be calculated reliably for any of the relief or surprise stimuli (due to their brevity) or for half of the anger stimuli (due to their weak pitch). Finally, the spectral centre of gravity and the standard deviation of the spectrum were computed on the basis of fast Fourier transformations.
Statistical Procedure
Discriminant analysis
Discriminant analyses were performed in order to examine whether the measurements from the acoustic analysis provided sufficient information to statistically distinguish between emotion categories. The independent variables of the models were the acoustic measurements of the 165 non-verbal vocalizations, and the dependent variable was the category of vocal expression. Discriminant analysis identifies a set of functions that minimises within-category variability and maximises between-category variability. These functions were used by the model to predict the category membership of each of the stimuli in the set.
As the standard method of discriminant analysis can overestimate the accuracy of the model, the more conservative ‘Jackknife’ method was also used. With this method, the category membership of each stimulus is estimated from discriminant functions derived from all other stimuli whose categories were known to the model, that is, a separate analysis is carried out for each stimulus. The performance of the model is measured by the percentage of categorizations made by the model that are correct, was assessed both overall and for each category separately. If the accuracy of the model’s classifications is high, this indicates that the independent variables are sufficient to distinguish among the categories. In this case this would indicate that the acoustic measurements of the sounds provided sufficient detail to distinguish among the different emotion classes.
Multiple regressions
In order to determine which acoustic characteristics underlie judgments of each of the emotions, multiple regressions were performed for each of the emotional rating scales from Study 1 (achievement/triumph, amusement, anger, contentment, disgust, fear, sensual pleasure, relief, sadness and surprise. This analysis only included the acoustic measurements of the 100 stimuli (10 per category) that had been rated for every emotion in Study 1. The independent variables were the acoustic measurements. These analyses identify which, if any, constellation of acoustic cues significantly predicts participants’ ratings on each of these emotional rating scales. Multiple regressions were also carried out with the participants’ ratings on the arousal and valence scales from Study 1, in order to determine whether the acoustic measurements of the sounds could accurately predict these perceived qualities.
Results
Acoustic analysis and discriminant analysis
The results of the acoustic analysis are displayed in Appendix B. The standard discriminant analysis (above) and the Jackknife analysis (below) are shown in Table 4. The overall accuracy of the analyses was 56.4% for the standard discriminant analysis and 50.3% for the Jackknife analysis (chance = 10%).
Table 4.
Results of standard (above) and Jackknife (below) discriminant analysis for classification of non-verbal emotional vocalizations from acoustic analysis. All results in %, correct classifications in bold. All horizontal rows add to 100. Ach = Achievement/Triumph, Amu = Amusement, Ang = Anger, Cont = Contentment, Dis = Disgust, Ple = Pleasure, Rel = Relief, Sad = Sadness, Surp = Surprise
| Stimulus type | Classification | |||||||||
|---|---|---|---|---|---|---|---|---|---|---|
| Standard discriminant analysis | ||||||||||
|
| ||||||||||
| Ach | Amu | Ang | Con | Dis | Fear | Ple | Rel | Sad | Sur | |
| Achievement | 70.6 | 0.0 | 11.8 | 0.0 | 5.9 | 11.8 | 0.0 | 0.0 | 0.0 | 0.0 |
| Amusement | 0.0 | 76.5 | 0.0 | 11.8 | 0.0 | 0.0 | 0.0 | 0.0 | 11.8 | 0.0 |
| Anger | 6.3 | 0.0 | 56.3 | 0.0 | 18.8 | 12.5 | 6.3 | 0.0 | 0.0 | 0.0 |
| Contentment | 0.0 | 11.8 | 5.9 | 23.5 | 0.0 | 0.0 | 29.4 | 17.6 | 11.8 | 0.0 |
| Disgust | 6.3 | 6.3 | 18.8 | 0.0 | 43.8 | 0.0 | 6.3 | 12.5 | 6.3 | 0.0 |
| Fear | 31.3 | 0.0 | 25.0 | 0.0 | 6.3 | 31.3 | 0.0 | 0.0 | 0.0 | 6.3 |
| Pleasure | 0.0 | 0.0 | 0.0 | 11.8 | 0.0 | 0.0 | 58.8 | 11.8 | 5.9 | 11.8 |
| Relief | 0.0 | 0.0 | 5.9 | 17.6 | 0.0 | 0.0 | 5.9 | 64.7 | 0.0 | 5.9 |
| Sadness | 0.0 | 18.8 | 0.0 | 6.3 | 0.0 | 0.0 | 6.3 | 0.0 | 56.3 | 12.5 |
| Surprise | 0.0 | 0.0 | 0.0 | 0.0 | 6.3 | 6.3 | 0.0 | 6.3 | 0.0 | 81.3 |
|
| ||||||||||
| Jackknife analysis | ||||||||||
|
| ||||||||||
| Achievement | 70.6 | 0.0 | 11.8 | 0.0 | 5.9 | 11.8 | 0.0 | 0.0 | 0.0 | 0.0 |
| Amusement | 0.0 | 58.8 | 0.0 | 11.8 | 0.0 | 0.0 | 0.0 | 11.8 | 17.6 | 0.0 |
| Anger | 6.3 | 0.0 | 56.3 | 0.0 | 18.8 | 12.5 | 6.3 | 0.0 | 0.0 | 0.0 |
| Contentment | 0.0 | 11.8 | 0.0 | 29.4 | 0.0 | 0.0 | 29.4 | 17.6 | 11.8 | 0.0 |
| Disgust | 6.3 | 6.3 | 18.8 | 0.0 | 43.8 | 0.0 | 6.3 | 12.5 | 6.3 | 0.0 |
| Fear | 31.3 | 0.0 | 25.0 | 0.0 | 12.5 | 25.0 | 0.0 | 0.0 | 0.0 | 6.3 |
| Pleasure | 0.0 | 0.0 | 0.0 | 11.8 | 0.0 | 0.0 | 58.8 | 11.8 | 5.9 | 11.8 |
| Relief | 0.0 | 0.0 | 5.9 | 17.6 | 0.0 | 0.0 | 5.9 | 58.8 | 5.9 | 5.9 |
| Sadness | 0.0 | 18.8 | 0.0 | 6.3 | 0.0 | 0.0 | 12.5 | 0.0 | 50.0 | 12.5 |
| Surprise | 0.0 | 0.0 | 0.0 | 0.0 | 18.8 | 12.5 | 0.0 | 18.8 | 0.0 | 50.0 |
Chi-square analyses were performed to test whether the models’ overall performance was better than would be expected by chance. The results indicated that the acoustic measurements provided sufficient information to discriminate successfully between stimuli from different emotion categories for both types of discriminant analyses (χ(2) = 3929 for the standard analysis, 2953 for the Jackknife analysis, both p < 0.0001). In the case of the standard discriminant analysis, performance was lowest for contentment (23.5%) and fear (31.3%) and highest for amusement (76.5%) and surprise (81.3%). In the Jackknife analysis, performance was lowest for contentment (29.4%) and fear (25.0%) and highest for achievement/triumph (70.6%).
Sets of chi-square analyses were also performed to examine whether the models performed better than chance in classifying stimuli from each of the emotion categories. For the standard discriminant analysis, the model performed significantly above chance for all emotions (χ(2) = 673 for achievement/triumph, 810 for amusement, 392 for anger, 33 for contentment, 209 for disgust, 83 for fear, 436 for sensual pleasure, 548 for relief, 392 for sadness, and 931 for surprise (all p < 0.05, Bonferroni corrected for 10 comparisons). For the Jackknife analysis, the model also performed significantly above chance for all categories (χ(2) = 673 for achievement/triumph, 436 for amusement, 392 for anger, 69 for contentment, 209 for disgust, 41 for fear, 436 for sensual pleasure, 436 for relief, 293 for sadness, and 293 for surprise, (all p < 0.05, Bonferroni corrected for 10 comparisons).
Common confusions in the standard discriminant analysis were anger sounds categorized as disgust, contentment sounds categorized as sensual pleasure and relief, disgust sounds categorized as anger, fear sounds categorized as achievement and anger, relief sounds categorized as contentment, and sadness sounds categorized as amusement. The confusions in the Jackknife analysis were similar, except that amusement sounds were also categorized as sadness, and surprise sounds were categorized as disgust and relief. This pattern is consistent with that of human participants in Study 1, although the human performance was somewhat more accurate (see Table 5 for the most common confusions for human listeners and discriminant analyses). In particular, confusions for anger, contentment, disgust, sensual pleasure, relief, and surprise were similar for the human listeners and the discriminant models. In contrast, the discriminant analysis errors for sounds of achievement, amusement, fear and sad sounds differed from those made by humans. Nevertheless, the discriminant analyses clearly demonstrated that the acoustic measurements provided sufficient information to categorize the emotional sounds accurately for all emotion categories, and also capture many of the typical confusions. However, they do not indicate what information was associated most with human listeners’ perceptual judgments of each category. This relationship was examined using multiple regressions of the acoustic cues and listeners’ judgments.
Multiple regressions
The regression analyses were significant for all of the emotional scales (see Table 6). This indicates that the participants’ ratings on each of the emotional scales in Study 1 could be predicted reliably from the acoustic measurements of the sounds. The variance explained by the acoustic factors ranged from 18% for the sadness and amusement ratings to 36% for the ratings on the fear scale. Clearly, much of the unaccounted variance in the emotion ratings was due to acoustic features that were not captured by the measurements used. Nonetheless, these measurements predicted a significant portion of the participants’ ratings on each of the emotion scales.
Table 6.
Summary of results from multiple regression analyses for each of the rating scales from Study 1, against the acoustic measures, showing the Beta weights and adjusted R2 values for the ratings of each emotion category. Achie = achievement, Amus = amusement, Cont = contentment, Disg = disgust, Pleas = pleasure, Sadne = sadness, Supri = surprise, Dur = duration, Amp rms = amplitude rms, Amp ons = Amplitude onsets, Int = intensity, P min = pitch minimum, P max = pitch maximum, P mean = pitch mean, Pitch std = Pitch standard deviation, Spec cog = Spectral centre of gravity, Spec std = Spectral standard deviation.
| Accue | Achie | Amus | Anger | Cont | Disg | Fear | Pleas | Relief | Sadne | Surpri |
|---|---|---|---|---|---|---|---|---|---|---|
| dur | 0.02 | −0.04 | 0.09 | 0.31** | −0.35** | −0.1 | 0.32** | 0.041 | 0.15 | −0.43** |
| Amp rms | 0.46 | 0.19 | −0.22 | 0.02 | −0.03 | −0.24 | −0.02 | −0.189 | 0.19 | 0.5 |
| Amp Ons | 0.07 | 0.47** | −0.14 | 0.04 | 0.02 | −0.03 | −0.03 | −0.1 | −0.21 | 0.02 |
| Int | −0.11 | 0.07 | 0.22 | 0.37 | −0.14 | 0.15 | 0.38 | 0.43 | −0.71! | −0.51 |
| P min | −0.75** | −0.39 | 0.21 | −0.03 | 0.11 | 0.38 | 0.12 | −0.39 | 0.24 | −0.52* |
| P max | 0.07 | 0.06 | 0.12 | −0.21 | −0.04 | 0.21 | −0.03 | −0.22 | 0.19 | 0.28 |
| P mean | 0.81** | 0.42 | −0.46* | 0.07 | −0.18 | −0.24 | −0.08 | 0.59* | −0.17 | 0.59* |
| P STD | −0.43 | −0.32 | 0.15 | 0.2 | 0.32 | −0.26 | 0.18 | −0.08 | 0.21 | −0.55* |
| Spec COG | −0.22 | −0.1 | 0.68** | −0.52** | 0.45** | 0.57** | −0.51** | −0.58** | 0.06 | 0.12 |
| Spec STD | 0.44** | 0.3* | −0.29* | 0.39** | −0.32** | −0.35** | 0.311* | 0.63* | −0.38** | 0.04 |
| Adj R2 | 0.23** | 0.18** | 0.28** | 0.29** | 0.24** | 0.36** | 0.24** | 0.27** | 0.18** | 0.23** |
= p>0.05,
=p>0.01,
=p=0.07.
Table 6 shows the acoustic variables which were revealed by the multiple regression analyses to predict significant amounts of variation for the ratings on each rating scale. A significant proportion of the variance for all the emotion ratings scales was predicted by some combination of acoustic factors, and for eight of the emotions the variance was predicted by a unique constellation of factors. The ratings for ‘contentment’ and ‘pleasure’ were predicted by very similar acoustic patterns. These regressions indicate, as has been described for emotional speech (Banse & Scherer, 1996; Juslin & Laukka, 2001), that the perception of emotions from non-verbal vocalisations relies on different acoustic profiles, depending on the specific emotion. Specifically, achievement ratings were predicted by a higher mean pitch, more spectral variation and a lower minimum pitch. Amusement ratings were predicted by a higher number of amplitude onsets, and more spectral variation. Anger ratings were predicted by a lower mean pitch, a higher spectral centre of gravity, and less spectral variation. Contentment and pleasure ratings were predicted by longer durations, a lower spectral centre of gravity, and more spectral variation. Disgust ratings were predicted by shorter durations, a higher spectral centre of gravity, and lower spectral variation. A higher spectral centre of gravity and lower spectral variation predicted fear ratings. Relief ratings were predicted by a higher mean pitch, a higher spectral centre of gravity, and more spectral variation. Sadness was predicted by lower spectral variation and lower intensity, although the intensity cue had a p value of 0.07 (beta value = −0.71). Finally, surprise ratings were predicted by shorter durations, with a higher pitch minimum and lower pitch mean, and less pitch variation.
As described previously, the acoustic factors can be grouped into three categories – those associated with properties of the amplitude of the sound (amplitude onsets, amplitude standard deviation, duration, intensity), those associated with pitch information (pitch minimum, maximum and mean, pitch standard deviation), and those associated with the spectrum of the sounds (spectral centre of gravity, spectral standard deviation). Collapsing predictive acoustic features for each emotional ratings scale into one of these three categories, only the ratings for ‘fear’ were predicted on the basis of just one class of acoustic information (spectral properties). All of the other ratings were predicted by a combination of acoustic properties: anger, relief and achievement ratings were predicted by spectral and pitch information, surprise on the basis of pitch and envelope cues, and disgust, amusement, sadness and contentment and pleasure were predicted by a combination of spectral and envelope cues. Figure 2 shows a Venn diagram of the three kinds of acoustic cues, and how the constellation of acoustic cues associated with the different emotional ratings fits into these three acoustic categories.
Figure 2.
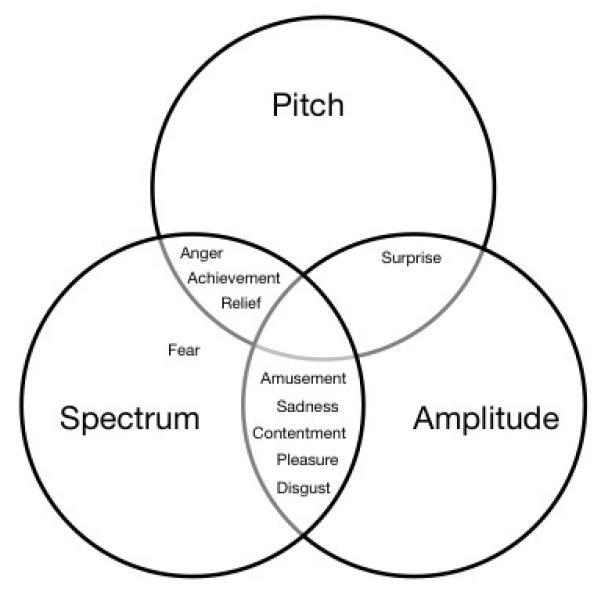
Venn diagram showing which classes of acoustic information are used to predict participants’ ratings for each of the emotional scales.
Multiple regressions were also carried out for the participants’ ratings on the arousal and valence scales in Study 1 (Table 3). The summary of these regressions is shown in Table 7. Both arousal and valence ratings were significantly predicted by sub-sets of the acoustic measures. However, the variance accounted for in the arousal ratings was notably much higher than that of the valence ratings: 0.59 adjusted R2 for arousal, 0.18 adjusted R2 for valence. Arousal ratings were predicted by shorter duration, more amplitude onsets, lower minimum pitch, higher mean pitch, less pitch variation, and a higher spectral centre of gravity. In contrast, higher valence scores (more positive ratings) were predicted by a lower spectral centre of gravity, and higher spectral variation.
Table 7.
Summary of results from multiple regression analyses for the rating scales ‘arousal’ and ‘valence’ from Study 1, against the acoustic measures, showing the Beta weights and adjusted R2 values for the ratings of each category. Dur = duration, Amp rms = amplitude rms, Amp ons = Amplitude onsets, Int = intensity, P min = pitch minimum, P max = pitch maximum, P mean = pitch mean, Pitch std = Pitch standard deviation, Spec cog = Spectral centre of gravity, Spec std = Spectral standard deviation.
| Acoustic cues | Arousal | Valence |
|---|---|---|
| dur | −0.27** | 0.09 |
| Amp std | 0.19 | 0.13 |
| Amp Ons | 0.25* | 0.2 |
| Int | −0.23 | 0.28 |
| P min | −0.73** | −0.33 |
| P max | 0.34 | −0.12 |
| P mean | 0.62** | 0.39 |
| P STD | −0.60** | −0.09 |
| Spec COG | 0.62** | −0.42** |
| Spec STD | −0.14 | 0.45** |
| Adj R2 | 0.58** | 0.17** |
= p>0.05,
=p>0.01.
Discussion
The results of Study 2 demonstrate a mapping between the acoustic properties of the non-verbal vocalizations and their emotional category. In addition, it shows that the ratings for different emotions could be predicted on the basis of different constellations of acoustic cues. Within the acoustic cues, spectral measures, especially spectral change, were particularly important in distinguishing the different emotional vocalisations.
Discriminant analyses
Overall, the standard discriminant analysis and the Jackknife analysis categorized the emotional vocalizations with well-above-chance accuracy (56.4% and 50.3% correct, respectively; chance = 10%). This demonstrates that the measurements of the acoustic analysis provided sufficient information for discriminating among stimuli from different emotional categories. The statistical models performed significantly better than chance not only in terms of overall performance but also in classifying stimuli from each of the emotional categories. Furthermore, the pattern of confusions broadly mirrored those found in Study 1, although the human performance was better overall. The accuracy of these analyses compares well with previous work using emotional speech (Banse & Scherer, 1996), which reported accuracy rates of 53% for the standard discriminant analysis and 40% for the Jackknife analysis (chance =7%), both of which were close to the human performance at 48%. Furthermore, the performance of the models also mirrored the kinds of errors that were typically made by the human judges.
These findings also parallel those on visual signals of emotions. Calder et al. (2001) used discriminant analyses to determine whether different facial expressions could be discriminated from pixel intensities in these images. Analogous to the present study, they found that the facial expressions were categorized with well-above-chance accuracy, using both standard and Jackknife analyses, and that the confusions made by human participants were also captured by the models. Thus, for both facial and vocal expressions of emotions, it is possible to classify emotional expressions in a manner that models human performance on the basis of basic perceptual features.
Multiple regressions
The participants’ ratings could be predicted by a particular constellation of acoustic cues for each emotion scale (Table 6). Exceptions were contentment and sensual pleasure, which were predicted by the same constellation of acoustic cues. Indeed, a close acoustic similarity for these two emotional expressions would explain the tendency of human participants in Study 1 to confuse them, and may be consistent with them not constituting two different emotion categories (see also Sauter & Scott, 2007).
With the exception of fear, all of the emotion scales were judged on the basis of two classes of acoustic information. The variance explained by the acoustic factors ranged from 18% for the amusement and sadness ratings to 36% for the ratings on the fear scale (Table 6). The unaccounted variance in the emotion ratings was likely due to factors other than the acoustic measurements that were included in the present analysis, such as fine spectral detail. A recent study by Cheang and Pell (2008) examined the importance of a range of acoustic cues including harmonics-to-noise ratio (HNR) for the perception of sarcasm in speech. They found that HNR, together with variation in fundamental frequency, was a reliable indicator of sarcastic speech. Voice quality cues may affect the perception of non-verbal vocalisations in a similar fashion.
These results are consistent with previous findings from studies of emotional speech. Banse and Scherer (1996) regressed acoustic parameters onto participants’ use of the emotion categories in a forced-choice task with a range of different emotions expressed in speech (hot and cold anger, panic, anxiety, despair, sadness, elation, happiness, interest, boredom, shame pride disgust and contempt). They found that for most of the emotions, the participants’ categorizations could mostly be significantly predicted from the acoustic cues (R values ranged between .16 for cold anger and .27 for happiness, but were not significant for cold anger and disgust). Banse and Scherer also did a reverse set of regressions, to predict acoustic features from the emotion of the sounds. They found that the emotion of the speech sounds predicted a large proportion of the variance for most of the acoustic variables that they measured. Juslin and Laukka (2001) found that a range of acoustic measures significantly predicted the participants’ ratings of emotional speech stimuli for five different emotions (anger, disgust, fear, happiness and sadness). Both of these studies with emotional speech found that, as in the current study, different emotional ratings were associated with different acoustic profiles.
Specifically comparing the emotions common to the three studies enables the comparison of acoustic cues in spoken language and non-verbal vocalizations. For anger ratings, Juslin and Laukka (2001) reported a lower pitch, a higher intensity, more spectral energy over 500Hz, a higher first formant and faster attack times for the voice onset. In contrast, Banse and Scherer (1996) reported (for ‘hot’ anger) a higher pitch and more pitch variation, and a higher proportion of spectral energy under 2000Hz. In the current study, the anger ratings were predicted by a higher spectral centre of gravity, and a lower mean pitch, as in the Juslin and Laukka (2001) study. The difference with the Banse and Scherer (1996) results may be because of their use of a ‘hot’ anger category. In the current study, lower spectral variation was also a significant predictor of anger ratings.
For disgust, Juslin and Laukka (2001) found that ratings were associated with a lower mean pitch and a downwards pitch inflection, along with more spectral energy over 500Hz, a higher first formant and faster attack times for the voice onset. Banse and Scherer (1996) reported an increase in the proportion of spectral energy over 1000Hz. In the current study, a higher spectral centre of gravity was also associated with ratings for disgust, consistent with the previous studies on speech. Shorter durations and less spectral variation were also significant predictors for disgust in the ratings of the non-verbal emotional sounds.
For fearful emotional speech, Juslin and Laukka (2001) reported that a higher pitch, lower pitch variation, lower levels of spectral energy over 500Hz, a lower first formant, a faster speech rate, and higher proportion of pauses, were associated with fear ratings. Banse and Scherer (1996) reported a higher mean pitch for both ‘panic’ and ‘anxiety’ in speech, with lower pitch variation and lower mean energy for the ‘anxiety’ stimuli. In contrast, the most predictive cues for the non-verbal emotional vocalizations in the current study were a higher spectral centre of gravity, and less spectral variation. This difference may represent the difference between the kinds of non-verbal screaming sounds produced by the speakers in the current study, and the inflections of fear in spoken language, which appear to be more associated with pitch cues.
For sadness ratings, both of the emotional speech studies (Banse & Scherer, 1996; Juslin & Laukka, 2001) reported an association with lower intensity and higher pitch: there was also an association with lower pitch variation, lower first formant frequency and more pauses (Juslin & Laukka, 2001), and longer voicing duration and more energy under 2000Hz (Banse & Scherer, 1996). Ratings for sadness in the current study were also predicted by less spectral variation, and by lower levels of intensity (albeit at a border-line significant p value, 0.07).
These studies vary in a number of ways, other than the use of emotional speech or non-verbal vocalisations to express the emotions: the range of emotions, the number of speakers and their experience (i.e., professional or not), the instructions and scenarios, and the acoustic measurements used. This means that inferences from direct comparisons across the three studies are necessarily somewhat limited. However, there is evidence for both similarities and differences in the ways that listeners rate the acoustic cues used in emotional speech and in non-verbal emotional vocalisations.
Overall, for the emotional categories that could be compared, pitch cues were somewhat less important than spectral cues for the non-verbal emotional expressions, which is a different pattern than that seen for emotional speech. Indeed, all five emotions studied in the Juslin and Laukka (2001) paper were significantly predicted by pitch cues, and seven of the fourteen emotion category responses in the Banse and Scherer (1996) paper were predicted by pitch cues. In contrast, in the current study, the ratings of four emotion categories (achievement, anger, relief and surprise) were predicted by pitch cues, while nine (all but surprise) were predicted by spectral cues. Spectral cues were also important for emotional speech (five out of fourteen emotional conditions in Banse and Scherer’s study and for four of five emotions in Juslin and Laukka’s study). Notably, for the non-verbal vocalisations, it was the measure of variance in the spectral information that was the most important across conditions, with ratings for all of the negative emotions being predicted by lower spectral variance measures, and ratings for all of the positive emotions being associated with a higher measure of spectral variance.
Arousal and valence
Nearly 60% of the variance in the participants’ ratings of perceived arousal could be predicted from the acoustic features of the sounds. This provides support for an acoustic “arousal” dimension, consistent with previous claims that vocal cues primarily convey arousal, over and above other dimensions or states (Bachorowski, 1999; Bänziger & Scherer, 2005). These cues are similar to the information indicating high ‘activation’ in a study of the acoustic cues associated with emotional dimensions in emotionally inflected speech (Laukka, Juslin & Bresin, 2005). Laukka et al. found that higher pitch, higher first formant and more spectral energy over 500Hz, as well as higher intensity, were associated with higher activation.
In contrast, there was a somewhat weaker relationship between the acoustic cues and participants’ valence ratings for the current study: 17% of the variance was accounted for by the acoustic features of lower spectral centre of gravity and greater spectral variation. This is also consistent with the Laukka et al.’s (2005) study, in which the acoustic cues predicted less variance for the participants’ valence ratings compared to all of the other rating scales. In their study of emotional speech the cues were higher pitch, lower minimum pitch and more spectral energy under 500Hz. Thus, across both speech and non-verbal emotional sounds, a lower frequency emphasis for the spectral profile was associated with more positive valence ratings, but otherwise the cues that predicted valence ratings were different. Across individual emotional ratings, the positive emotions were all associated with high levels of spectral variance, while the negative emotions were all associated with lower levels of spectral variance. This relationship may underlie the role of spectral variation in the prediction of overt valence ratings.
General Discussion
Recognizing emotions from the voice
Previous neuropsychological research (e.g. Scott et al., 1997; Calder et al., 2004; Calder et al., 2000) has used vocal signals of sadness, anger, fear, disgust, happiness and surprise that were similar to those used in the current study (i.e., non-verbal, vocal expressions) to investigate emotional impairments following brain injury. However, previous behavioural studies using acoustic analyses to investigate the perception of emotions in vocalizations have exclusively examined emotional speech (Banse & Scherer, 1996; Juslin & Laukka, 2001; Laukka et al., 2005). This study provides the first systematic investigation of positive and negative non-verbal vocal expressions, in terms of recognition rates, confusions, ratings, and their acoustic profiles. Study 1 demonstrates that both positive and negative emotions can be identified reliably from non-verbal vocalizations. A previous study reported that a subset of the emotions used in the current study (the positive emotions) could be identified from non-verbal signals (Sauter & Scott, 2007). The current study demonstrates that non-verbal expressions of different positive emotions can be identified in the context of negative emotional vocalizations. Further studies will be needed to determine whether these positive emotions are exclusively expressed by the voice (Ekman, 1992), or whether they are also associated with distinct facial expressions. Recent work has suggested that certain positive emotions, such as pride, may be conveyed by distinct facial and postural cues, which indicates that the differentiation of positive affect signals may indeed not be specific to the vocal domain (Tracy & Robins, 2004). Further work will also be able to establish the extent to which these expressions are recognized in non-Western cultures, as has been investigated for facial cues (Ekman 1994; Ekman, Sorenson, & Friesen, 1969; Elfenbein & Ambady 2002; Russell 1994).
The current study has also demonstrated that, with the exceptions of sensual pleasure and contentment, each type of non-verbal emotional vocalization could be automatically categorized by a discriminant analysis of acoustic measures. In addition, each emotion category had a distinctive acoustic profile. This suggests that, as in the face and emotional speech, different non-verbal emotional vocalizations are associated with distinct physical characteristics. Unlike the studies of emotional speech, where pitch was a dominant cue to emotional ratings, spectral cues – especially spectral variance – was a dominant cue for all but surprise vocalizations.
The previous study of non-verbal vocalizations of positive emotions (Sauter & Scott, 2007) found substantial overlap between sensual pleasure and contentment, a finding replicated in the current study. The rating data from the current study corroborate this pattern, as contentment sounds were rated highly on the pleasure dimension and vice versa. These two emotion categories may have been considered by participants to express variants of the ‘same’ emotion. This interpretation was further supported by the similarities found in the discriminant analyses of the acoustic characteristics of these two stimulus classes. Furthermore, the ratings for contentment and sensual pleasure related in the same way to the same set of acoustic features in the regression analyses. This pattern suggests that the confusion between these two emotions was reflected in similarities of their acoustic profiles. However, this association could be also be due to contentment and sensual pleasure being emotions of relatively low intensity. Previous studies have found that vocal emotions with strong emotion intensity are easier to decode than those with weak emotional intensity (Juslin & Laukka, 2001).
Acoustic cues
The results of the multiple regression analysis indicate that participants’ ratings of achievement, amusement, anger, disgust, fear, relief sadness and surprise were associated with different constellations of acoustic features. This relationship between physical stimulus attributes and stimulus ratings has been previously described for the expression of emotions in speech (Banse & Scherer, 1996, Juslin & Laukka, 2001), and in facial expressions (Calder et al., 2001). The present results also suggest that there is some similarity between the acoustic cues used in the detection and recognition of emotion expressed in speech and non-verbal vocalizations – the ratings for anger, sadness and disgust shared some acoustic features in the current study and previous work on emotionally inflected speech (Banse & Scherer, 1996; Juslin & Laukka, 2001). However, there were also some differences: for example, fear ratings were associated with different cues for the emotional speech and the emotional sounds. This suggests that the acoustic cues used in the assessment of emotions in speech and non-verbal sounds are not identical.
Within the acoustic profiles for the emotional sounds, spectral variation was an important cue for ratings of all but one of the emotional categories, the exception being surprise. Spectral cues have also been reported to be important in the ratings of emotional speech, along with pitch and pitch variation (Banse & Scherer, 1996; Bänziger & Scherer, 2005; Juslin & Laukka, 2001). Our data suggest that pitch cues also play a role in the perception of emotion from non-verbal vocal cues, but that spectral cues, especially measures of spectral variation (or the absence of such variation), are equally if not more important. As change in the spectral properties of any vocalization can result from movements of the supralaragneal articulators, as well as by the changes in the sounds produced at the larynx (e.g. from a breathy sound to a normally voiced sound), spectral variation can be considered a rough index of the overall amount of movement associated with the vocalizations (though not what those movements are) and of change in the source sounds produced at the larynx (though not what these changes are). Measures of spectral change have not been reported in emotional speech (Banse & Scherer, 1996; Juslin & Laukka, 2001), possibly because the spectral variation associated with speech production masks any specific changes associated with emotion, or may prevent those changes from occurring.
The non-verbal emotional vocalizations associated with lower amounts of spectral change were anger, disgust, sadness and fear. This lack of spectral variance may reflect reduced movements of the articulators during the production of these sounds, and a consistency (i.e., a lack of change) in the manner of voicing at the larynx. It is possible that the lack of spectral change is associated with a more static facial expression during vocalizations for these negative emotions, which all have correlates in the facial expressions of the four negative ‘basic’ emotions (Ekman & Friesen, 1971). In contrast, ratings of all of the positive emotions, hypothesized to be facially associated with a smile (Ekman, 1992), were predicted by higher amounts of spectral variation. These dynamic spectral profiles may reflect greater change in the movements of the articulators and larynx associated with these emotions – they may all be associated with a smile, but the smile may be less ‘fixed’ in place. Further work investigating both auditory and visual channels together, to identify the kinds of orofacial and articulatory and larangeal movements associated emotional vocalizations, will be able to further delineate how these spectral changes relate to the different expressions.
Arousal and Valence
The principal components analysis in Study 1 yielded two factors that together accounted for 69% of the variance. The first factor was highly correlated with the participants’ valence ratings, and the second factor was highly correlated with their arousal ratings. Notably, although some emotions that were close in terms of arousal and valence were commonly confused (e.g., contentment and sensual pleasure), this was not consistently the case (e.g., anger and fear were not confused with one another).
Bachorowski (1999) has argued that vocal communication in speech sounds primarily signals the sender’s arousal state, and only to a small degree their valence state. In line with this suggestion (see also Banse & Scherer, 1996) the acoustic cues in the model in Study 2 explained 58% of the variance of the arousal ratings, but only 18% of the valence ratings. This pattern indicates that the perceived arousal of emotional vocalizations could be better mapped out in terms of their acoustic features than the valence (see also Banse & Scherer, 1996, Laukka et al., 2005). Nevertheless, the acoustic factors still predicted a significant proportion of the valence ratings, as has been previously described for emotional speech (Laukka et al., 2005). However, the results from the PCA analysis of the ratings data in Study 1 contradict the claim that valence is not reliably expressed in the voice. These results suggest that, of these two dimensions, valence is the dominant feature conveyed by these non-verbal emotional vocalizations. The principal component correlating with perceived valence accounted for most of the variance (58.3%) in the model, whereas the component correlated with perceived arousal accounted for only 16% of the variance in the participants’ ratings.
One explanation for the discrepancy between the importance of valence in the PCA analysis and the dominant role for arousal in the acoustic analysis, could be that the amount of arousal is directly reflected in the acoustics of the voice (Banse & Scherer, 1996), while this may not be that case for valence. Rather, positive or negative valence may represent a conceptual (but not perceptual) distinction between emotion categories, that corresponds less well than arousal to any consistent acoustic mapping. In other words, combinations of perceptual cues distinguish among the individual emotions, and valence ratings may be derived from the knowledge that certain emotions are positive whereas others are negative.
Conceptual properties of the individual emotions may have also had an effect on the relationship between the ratings and the acoustic parameters. The greatest amount of variance accounted for by acoustic factors was 36% (for the fear scale) and the least was 18% (for the amusement and sadness ratings). This difference could be due in part to limitations on the acoustic measures we made. However, there is also the possibility that listeners were making ratings based on their perceptions of the symbolic properties of the stimuli, which might lead to large acoustic differences between items still judged to be similar symbols of the same emotional state (Buck & Vanlear, 2002). Further work with more speakers, and possibly contrasting spontaneous and posed exemplars of emotional states will be able to investigate this further.
Considerations and further studies
An important limitation of the current studies is the reliance on acted emotional vocalizations. Although non-spontaneous expressions are used by most studies in this area of research (see Juslin & Laukka, 2003), this methodology has been criticized for yielding stereotypical portrayals (Bachorowski & Owren, 1995). This is an important point that deserves empirical investigation. However, along with Juslin and Laukka (2001), we consider that acted portrayals, which are not imitated, copied or directed, are acceptably similar to spontaneous expressions. Furthermore, use of such stimuli avoids the ethical and practical problems associated with attempting to elicit good recordings of spontaneous vocal expressions of emotion. A second limitation is that the current study used only four speakers, although each speaker generated several exemplars. Further work with a greater numbers of speakers (and possibly trained professional actors) would be able to establish the degree to which the acoustic factors in this study can be generalized (Juslin & Scherer, 2005).
Age related effects on the perception of facial expressions of emotion have been shown (Calder et al, 2003), and a recent study has suggested that the relationship between acoustic cues and perceived emotions may be also affected by the listener’s age (Paulmann, Pell, & Kotz, 2008). This issue needs to be examined in the context of non-verbal vocalizations. Finally, verbal and non-verbal emotional expressions (i.e., emotionally inflected speech and emotional non-verbal vocalizations) need to be directly compared: Which is more efficient as a communicative cue, is this constant across emotional classes, and to what extent do they rely on the same acoustic cues?
Conclusions
These studies show that the perceptual investigations of emotional expression in the face and in speech can be applied to non-verbal expressions of emotion. There are accurate recognition and ratings of positive and negative non-verbal expressions of emotion, and evidence for valence and arousal dimensions underlying the ratings of emotional sounds. In addition, the perceived emotional character of the sounds can be predicted on the basis of the acoustic features of the sounds, with a different constellation of acoustic cues for each emotion. These acoustic cues show some similarities with the cues that are important in the perception of emotional speech (e.g., aspects of pitch), as well as some significant differences (e.g., aspects of spectral variation). Investigating the ways in which emotions can be expressed vocally, both in speech and non-verbal expressions, contributes to a multimodal approach to emotional communication.
Supplementary Material
Acknowledgements
SKS and FE were funded by the Wellcome Trust (WT074414MA) and A.J.C is funded by the Medical Research Council. The authors are grateful to Paul Ekman for several highly useful discussions of this work.
Footnotes
The positive stimuli (achievement, amusement, relief, sensual pleasure and contentment) have been used in a previous study (Sauter & Scott, 2007). However, none of the data in the current paper have previously been published.
References
- Atkinson AP, Tunstall ML, Dittrich WH. Evidence for distinct contributions of form and motion information to the recognition of emotions from body gestures. Cognition. 2007;104:59–72. doi: 10.1016/j.cognition.2006.05.005. [DOI] [PubMed] [Google Scholar]
- Atkinson AP, Dittrich WH, Gemmell AJ, Young AW. Emotion perception from dynamic and static body expressions in point-light and full-light displays. Perception. 2004;33:717–46. doi: 10.1068/p5096. [DOI] [PubMed] [Google Scholar]
- Bachorowski JA. Vocal expression and perception of emotion. Current Directions in Psychological Science. 1999;8:53–57. [Google Scholar]
- Bachorowski JA, Braaten EB. Emotional intensity: Measurement and theoretical implications. Personality and Individual Differences. 1994;17:191–199. [Google Scholar]
- Bachorowski JA, Owren MJ. Vocal expression of emotion: Acoustic properties of speech are associated with emotional intensity and context. Psychological Science. 1995;6:219–224. [Google Scholar]
- Banse R, Scherer KR. Acoustic profiles in vocal emotion expression. Journal of Personality and Social Psychology. 1996;70:614–636. doi: 10.1037//0022-3514.70.3.614. [DOI] [PubMed] [Google Scholar]
- Bänziger T, Scherer KR. The role of intonation in emotional expressions. Speech Communication. 2005;46:252–267. [Google Scholar]
- Boersma P. Accurate short-term analysis of the fundamental frequency and the harmonics-to-noise ratio of a sampled sound. Proceedings of the Institute of Phonetic Sciences. 1993;17:97–110. [Google Scholar]
- Boersma P, Weenink D. Praat: doing phonetics by computer. [Computer program] 2005 http://www.praat.org/
- Buck R, VanLear CA. Verbal and nonverbal communication: distinguishing symbolic, spontaneous, and pseudo-spontaneous nonverbal behavior. The Journal of Communication. 2002;52:522–541. [Google Scholar]
- Calder AJ, Keane J, Manly T, Sprengelmeyer R, Scott S, Nimmo-Smith I, Young AW. Facial expression recognition across the adult life span. Neuropsychologia. 2003;41:195–202. doi: 10.1016/s0028-3932(02)00149-5. [DOI] [PubMed] [Google Scholar]
- Calder AJ, Burton AM, Miller P, Young AW, Akamatsu S. A principal components analysis of facial expressions. Vision Research. 2001;41:1179–1208. doi: 10.1016/s0042-6989(01)00002-5. [DOI] [PubMed] [Google Scholar]
- Calder AJ, Keane J, Lawrence AD, Manes F. Impaired recognition of anger following damage to the ventral striatum. Brain. 2004;127:1958–1969. doi: 10.1093/brain/awh214. [DOI] [PubMed] [Google Scholar]
- Calder AJ, Keane J, Manes F, Antoun N, Young AW. Impaired recognition and experience of disgust following brain injury. Nature Neuroscience. 2000;3(11):1077–1078. doi: 10.1038/80586. [DOI] [PubMed] [Google Scholar]
- Carroll NC, Young AW. Priming of emotion recognition. Quarterly Journal of Experimental Psychology A. 2005;58:1173–97. doi: 10.1080/02724980443000539. [DOI] [PubMed] [Google Scholar]
- Cheang HS, Pell MD. The sound of sarcasm. Speech Communication. 2008;50:366–381. [Google Scholar]
- Cohen JD, McWhinney B, Flatt M, Provost J. A new graphic interactive environment for designing psychology experiments. Behavioral Research Methods, Instruments, and Computers. 1993;25:257–271. [Google Scholar]
- Cummins F, Port R. Rhythmic constraints on stress timing in English. Journal of Phonetics. 1998;26:145–171. [Google Scholar]
- Dailey MN, Cotrell GW, Padgett C, Adolphs R. EMPATH: A neural network that categorizes facial expressions. Journal of Cognitive Neuroscience. 2002;14(8):1158–1173. doi: 10.1162/089892902760807177. [DOI] [PubMed] [Google Scholar]
- Davidson RJ. Anterior cerebral asymmetry and the nature of emotion. Brain and Cognition. 1992;20:125–151. doi: 10.1016/0278-2626(92)90065-t. [DOI] [PubMed] [Google Scholar]
- Ekman P. An Argument for Basic Emotions. Cognition and Emotion. 1992;6:169–200. [Google Scholar]
- Ekman P. Strong evidence for universals in facial expressions: A reply to Russell’s mistaken critique. Psychological Bulletin. 1994;115:268–287. doi: 10.1037/0033-2909.115.2.268. [DOI] [PubMed] [Google Scholar]
- Ekman P. Emotions revealed: Recognizing faces and feelings to improve communication and emotional life. Weidenfeld and Nicolson; London: 2003. [Google Scholar]
- Ekman P, Friesen WV. Constants across cultures in the face and emotion. Journal of Personality and Social Psychology. 1971;17:124–129. doi: 10.1037/h0030377. [DOI] [PubMed] [Google Scholar]
- Ekman P, Friesen WV. Pictures of facial affect. Consulting Psychologists Press; Palo Alto, CA: 1976. [Google Scholar]
- Ekman P, Rosenberg EL. What the face reveals: Basic and applied studies of spontaneous expression using the Facial Action Coding System (FACS) Oxford University Press; New York: 2005. [Google Scholar]
- Ekman P, Sorenson ER, Friesen WV. Pan-cultural elements in facial displays of emotion. Science. 1969;164:86–88. doi: 10.1126/science.164.3875.86. [DOI] [PubMed] [Google Scholar]
- Elfenbein HA, Ambady N. On the universality and cultural specificity of emotion recognition: A meta-analysis. Psychological Bulletin. 2002;128:203–235. doi: 10.1037/0033-2909.128.2.203. [DOI] [PubMed] [Google Scholar]
- Juslin PN, Laukka P. Impact of intended emotion intensity on cue utilization and decoding accuracy in vocal expression of emotion. Emotion. 2001;1:381–412. doi: 10.1037/1528-3542.1.4.381. [DOI] [PubMed] [Google Scholar]
- Juslin PN, Laukka P. Communication of emotions in vocal expression and music performance: Different channels, same code? Psychological Bulletin. 2003;129:770–814. doi: 10.1037/0033-2909.129.5.770. [DOI] [PubMed] [Google Scholar]
- Juslin PN, Scherer KR. Vocal expression of affect. In: Harrigan JA, Rosenthal R, Scherer KR, editors. The New Handbook of Methods in Nonverbal Behavior Research. Oxford University Press; Oxford: 2005. pp. 65–136. [Google Scholar]
- Karpf A. The human voice. Bloomsbury; London: 2006. [Google Scholar]
- Kohler KJ. ‘Speech-Smile’, ‘Speech-Laugh’, ‘Laughter’ and their Sequencing in Dialogic Interaction. Phonetica. 2008;65:1–18. doi: 10.1159/000130013. [DOI] [PubMed] [Google Scholar]
- Laukka P, Juslin P, Bresin R. A dimensional approach to vocal expression of emotion. Cognition & Emotion. 2005;19:633–653. [Google Scholar]
- Morris JS, Scott SK, Dolan RJ. Saying it with feeling: Neural responses to emotional vocalizations. Neuropsychologia. 1999;37:1155–1163. doi: 10.1016/s0028-3932(99)00015-9. [DOI] [PubMed] [Google Scholar]
- Morton J, Marcus SM, Frankish C. Perceptual centres (P-centres) Pychological Review. 1976;8:405–408. [Google Scholar]
- Murray IR, Arnott JL. Toward the simulation of emotion in synthetic speech: A review of the literature on human vocal emotion. Journal of the Acoustical Society of America. 1993;93:1097–1108. doi: 10.1121/1.405558. [DOI] [PubMed] [Google Scholar]
- Paulmann S, Pell MD, Kotz SA. How ageing affects the recognition of emotional speech. Brain and Language. 2008;104:262–269. doi: 10.1016/j.bandl.2007.03.002. [DOI] [PubMed] [Google Scholar]
- Russell JA. A circumplex model of affect. Journal of Personality and Social Psychology. 1980;39:1161–1178. [Google Scholar]
- Russell JA. Is there universal recognition of emotion from facial expression? A review of the cross-cultural studies. Psychological Bulletin. 1994;115:102–141. doi: 10.1037/0033-2909.115.1.102. [DOI] [PubMed] [Google Scholar]
- Sauter D, Scott SK. More than one kind of happiness: Can we recognize vocal expressions of different positive states? Motivation and Emotion. 2007;31:192–99. [Google Scholar]
- Scherer KR. Affect bursts. In: van Goozen S, van de Poll NE, Sergeant JA, editors. Emotions: Essays on emotion theory. Erlbaum; Hillsdale, NJ: 1994. pp. 161–196. [Google Scholar]
- Scherer KR. Vocal communication of emotion: A review of research paradigms. Speech Communication. 2003;40:227–256. [Google Scholar]
- Scherer KR, Banse R, Wallbott HG. Emotion inferences from vocal expression correlate across languages and cultures. Journal of Cross Cultural Psychology. 2001;32:76–92. [Google Scholar]
- Scherer KR, Johnstone T, Klasmeyer G. Vocal expression of emotion. In: Davidson RJ, Goldsmith HH, Scherer KR, editors. Handbook of affective sciences. Oxford University Press; New York: 2003. pp. 433–456. [Google Scholar]
- Schröder M. Experimental study of affect bursts. Speech Communication. 2003;40:99–116. [Google Scholar]
- Scott SK. Unpublished doctoral dissertation. University College London; UK: 1993. P-centers in speech: An acoustic analysis. [Google Scholar]
- Scott SK, Young AW, Calder AJ, Hellawell DJ, Aggleton JP, Johnson M. Impaired auditory recognition of fear and anger following bilateral amygdala lesions. Nature. 1997;385:254–257. doi: 10.1038/385254a0. [DOI] [PubMed] [Google Scholar]
- Tracy JL, Robins RW. Show your pride: Evidence for a discrete emotion expression. Psychological Science. 2004;15:194–197. doi: 10.1111/j.0956-7976.2004.01503008.x. [DOI] [PubMed] [Google Scholar]
- Warren JE, Sauter DA, Eisner F, Wiland J, Dresner MA, Wise RJS, Rosen S, Scott SK. Positive Emotions Preferentially Engage an Auditory–Motor “Mirror” System. Journal of Neuroscience. 2006;26:13067–13075. doi: 10.1523/JNEUROSCI.3907-06.2006. [DOI] [PMC free article] [PubMed] [Google Scholar]
Associated Data
This section collects any data citations, data availability statements, or supplementary materials included in this article.