Abstract
Stanniocalcin-1 is an intracrine protein; it binds to the cell surface, is internalized to the mitochondria, and diminishes superoxide generation through induction of uncoupling proteins. In vitro, stanniocalcin-1 inhibits macrophages and preserves endothelial barrier function, and transgenic overexpression of stanniocalcin-1 in mice protects against ischemia-reperfusion kidney injury. We sought to determine the kidney phenotype after kidney endothelium-specific expression of stanniocalcin-1 small hairpin RNA (shRNA). We generated transgenic mice that express stanniocalcin-1 shRNA or scrambled shRNA upon removal of a floxed reporter (phosphoglycerate kinase-driven enhanced green fluorescent protein) and used ultrasound microbubbles to deliver tyrosine kinase receptor-2 promoter-driven Cre to the kidney to permit kidney endothelium-specific shRNA expression. Stanniocalcin-1 mRNA and protein were expressed throughout the kidney in wild-type mice. Delivery of tyrosine kinase receptor-2 promoter-driven Cre to stanniocalcin-1 shRNA transgenic kidneys diminished the expression of stanniocalcin-1 mRNA and protein throughout the kidneys. Stanniocalcin-1 mRNA and protein expression did not change in similarly treated scrambled shRNA transgenic kidneys, and we observed no Cre protein expression in cultured and tyrosine kinase receptor-2 promoter-driven Cre–transfected proximal tubule cells, suggesting that knockdown of stanniocalcin-1 in epithelial cells in vivo may result from stanniocalcin-1 shRNA transfer from endothelial cells to epithelial cells. Kidney-specific knockdown of stanniocalcin-1 led to severe proximal tubule injury characterized by vacuolization, decreased uncoupling of protein-2 expression, greater generation of superoxide, activation of the unfolded protein response, initiation of autophagy, cell apoptosis, and kidney failure. Our observations suggest that stanniocalcin-1 is critical for tubular epithelial survival under physiologic conditions.
Mammalian stanniocalcin-1 (STC1) is expressed in many tissues and organs, including the kidneys.1 STC1 is an intracellular-acting, extracellular signaling protein (paracrine/intracrine2); it is released to the extracellular milieu3 and binds to a cell-surface protein,4 followed by internalization and targeting to the inner mitochondrial membrane.5–8 STC1 inhibits macrophage function through several mechanisms, including suppression of superoxide generation via uncoupling protein-2 (UCP2)–dependent pathway7 and inhibition of chemotaxis, chemokinesis, and migration across an endothelial monolayer.9,10 In cultured endothelial cells, STC1 diminishes superoxide generation, inhibits cytokine-induced activation of Jun-N-terminal kinase and nuclear factor-κB, and preserves endothelial barrier function.11 These observations suggested that STC1 may have potent anti-inflammatory and cytoprotective effects. Indeed, STC1 transgenic (Tg) mice, which display preferential expression of STC1 in kidney endothelium, are protected from anti–glomerular basement membrane GN12 and ischemia-reperfusion kidney injury.13 In this work, we sought to determine kidney phenotype after kidney endothelium-specific expression of STC1 small hairpin RNA (shRNA), using two novel approaches: (1) shRNA Tg mice, which express STC1 shRNA or scrambled shRNA, upon removal of floxed reporter (phosphoglycerate kinase [PGK]-driven enhanced green fluorescent protein [EGFP]) from the transgene, permitting H1 promoter-driven shRNA expression,14 and (2) an ultrasound microbubble–mediated gene delivery system15 to transfect kidney cells in vivo with a plasmid that expresses Cre recombinase under the control of tyrosine kinase receptor-2 (Tie2) promoter.16 In principle, a given gene is “packaged” within albumin/lipid/Lipofectamine microbubbles,17,18 injected intravenously, and transfected into cells of the desired organ by disruption of the bubbles as they pass through its circulation, using high-energy ultrasound beam. These powerful tools allow conditional and kidney endothelium-specific expression of STC1 shRNA, but in principle, they may be applied to knock down the expression of any gene in any cell or organ.
Delivery of Cre to the kidney of STC1 shRNA Tg mice produced 3- and 4-fold knockdown of STC1 mRNA and protein, respectively, in the entire kidney within 4–5 days. STC1 mRNA and protein did not change in similarly treated scrambled shRNA Tg kidneys (expressing equal number of transgene copies), and transfection of cultured proximal tubule (PT) cells with Tie2-Cre did not yield Cre recombinase expression, suggesting that knockdown of STC1 expression in epithelial cells of the kidney in vivo is probably related to STC1 shRNA transfer from endothelial cells to neighboring epithelial cells in a manner known as noncell autonomous RNA interference (RNAi) (see Cohen and Xiong19 and Supplemental Figure 1). STC1 knockdown in STC1 shRNA Tg kidneys led to severe tubular epithelial cell injury in the cortex; this injury is characterized by vacuolization and involves predominantly S1 and S2 segments of the proximal nephron. Moreover, STC1 knockdown is associated with lower UCP2 expression and greater generation of superoxide in kidney tubules; concomitantly, the kidneys display activation of the unfolded protein response (UPR), autophagy, and apoptosis. Delivery of a plasmid that expresses Cre under the control of the kidney epithelium-specific (KSP)–cadherin promoter diminished the expression of STC1 in epithelial cells of the kidney and produced similar phenotype (vacuolization in epithelial cells), thus validating our methods and observations. These observations suggest that (1) STC1 plays an important role in the normal physiology of the kidney and is essential for epithelial cell survival and (2) our approach allows efficient and near-complete knockdown of STC1 expression in the kidney and provides a powerful tool to examine the effect of kidney-specific disruption of other genes.
Results
Generation of shRNA Transgene Constructs and Tg Mice
Transgenic shRNA vector (pTshRNA) plasmid was described elsewhere.14 Using pTshRNA as a template, we amplified a 1015-bp PCR fragment encoding the human polymerase III H1 promoter and multiple cloning sites, preserving the KpnI, SalI, and NotI restriction enzymes sites on the 3′ end of the H1 promoter (antisense primer: 5′-CCggtaccGGGCCCCCCCTCGAGGTCGATtcgagcggccgc-3′), while introducing SacI and NotI sites on the 5′ end of H1 (sense primer: 5′-GGgagctcgcggccgcCAGAACGCTGACGTCATCA-3′). Following restriction enzyme digest with KpnI and SacI, the PCR fragment was subcloned into the KpnI and SacI sites of pBluscript II SK(+) to generate pBlueH1. In the next step, also using pTshRNA as a template, a 2.1-kb PCR fragment encoding the PGK promoter, EGFP, and simian virus-40 polyadenylation site was amplified using primers incorporating BglII and Lox-P site (underlined) on the 5′-end (sense primer: 5′-CCagatctATAACTTCGTATAATGTATGCTATACGAAGTTATAATTCTACCGGGTAGGGGA-3′) and HindIII followed by the reverse complement sequence of Lox P site (underlined) on the 3′-end (anti-sense primer: 5′-CCaagcttATAACTTCGTATAGCATACATTATACGAAGTTATTAGTggatcGATCCAGAC-3′). After restriction enzyme digest with BglII and HindIII, this fragment was ligated into the BglII and HindIII sites of pBlueH1– to generate pBlueH1EGFPFlox.
STC1 RNAi targeting sequence 5′-GGTATTCCTTGCCATTCGG-3′, corresponding to nucleotides 419–437 of mSTC1 cDNA (accession #NM_009285), was designed according to Brummelkamp et al.20 STC1 RNAi-based oligonucleotides were synthesized and annealed to generate linkers encoding shRNAs with the 19-nt sequence forming head-to-head repeats (separated by 8-nt spacer; ACTCGAGA), incorporating HindIII compatible overhang on the 5′-end and termination signal on the 3′-end of one oligonucleotide, and SalI overhang on the 5′-end of the complementary nucleotide (Supplemental Figure 2). The annealed nucleotides were cloned into HindIII and SalI sites of pBlueH1EGFPFlox to generate pBlueH1EGFPFloxSTC1shRNA (Supplemental Figure 2). The sense strand sequence of the scrambled shRNA linker used is AGCTGGCTTACCGTTCCTTATGGACTCGAGACCATAAGGAACGGTAAGCCTTTTTG (scrambled RNAi targeting sequence and corresponding head-to-head repeat are underlined). Sequence-verified transgene constructs (3200 bp) were digested with KpnI/AatII/AflIII, gel-purified, and used for pronuclear injections to generate STC1-shRNA and scrambled-shRNA Tg mice (Genetically Engineered Mouse Core, Baylor College of Medicine, Houston, TX).
Validation of shRNA Transgene Constructs and Genotype of shRNA Tg Mice
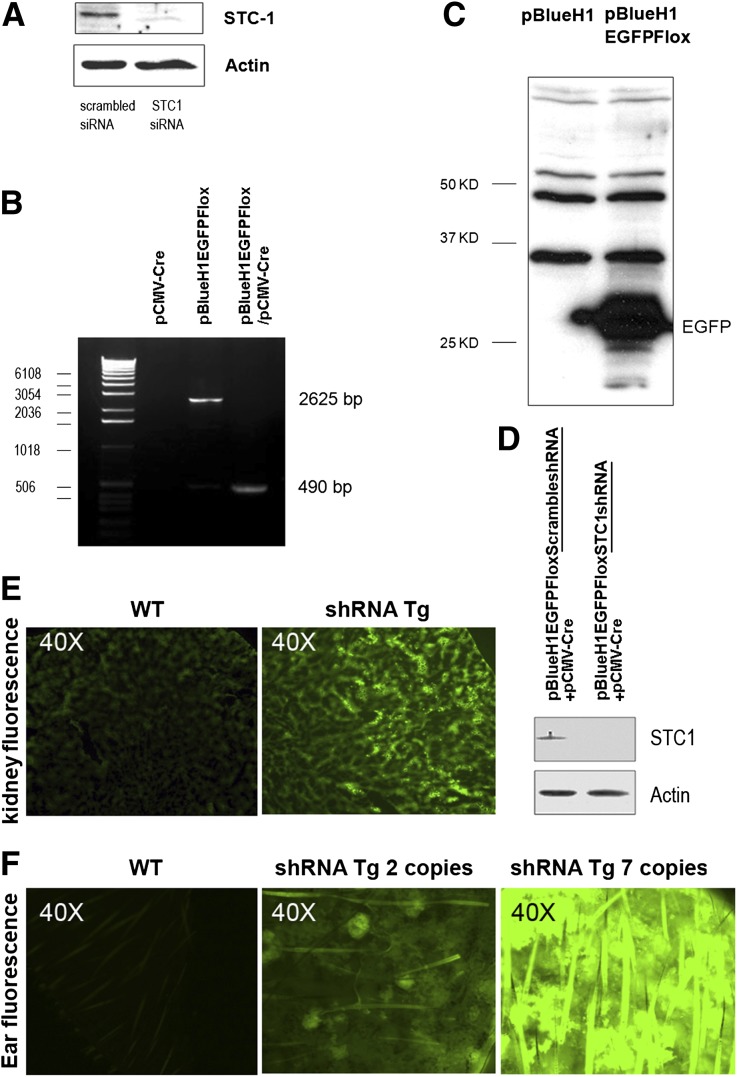
To determine the efficiency of STC1 knockdown by STC1 siRNA, we transfected mouse C2C12 cells (ATCC), which normally express STC1 protein, with 19-nt STC1 small interfering RNA (siRNA) or 19-nt scrambled siRNA described above (Ambion, Grand Island, NY). Forty-eight hours after transfection, we observed near-complete knockdown of STC1 protein expression in STC1 siRNA-transfected but not in scrambled siRNA-transfected cells (Figure 1A). In the next step, we sought to confirm functional excision of Flox P sites in pBlueH1EGFPFlox. To that end, we transfected human embryonic kidney 293 (HEK293) cells (ATCC) with a plasmid expressing Cre under the control of cytomegalovirus promoter (pCMV-Cre; Adgene, Cambridge, MA), pBlueH1EGFPFlox, or pBlueH1EGFPFlox plus pCMV-Cre. Forty-eight hours after transfection, cellular DNA was isolated and subjected to PCR amplification using primers (5′-AGTGGGAGGGGGTTCATATC-3′; and 5′-AGTGTCACTAGGCGGGAACA-3′) that flank PGK-EGFP in pBlueH1EGFPFlox, generating expected size products (Figure 1B) and thus confirming functional Flox P sites. Next, we confirmed EGFP protein expression in pBlueH1EGFPFlox-transfected HEK293 cells (Figure 1C); finally, knockdown of native STC1 expression in Att20/D16v-F2 cells transfected with pCMV-Cre and pBlueH1FloxEGFPSTC1shRNA, but not in cells transfected with pCMV-Cre and pBlueH1FloxEGFPscrambledshRNA (Figure 1D), thus confirming functional STC1 shRNA transgene construct. shRNA Tg genotype and Tg copy number were determined by quantitative RT-PCR using transgene-specific primers (EGFP-sense 5′-ATTCTCGCACGCTTCAAAAG-3′; EGFP-antisense 5′-CTTCACAAAGATCCCCCGTA-3′; actin for control: sense 5′-CCCTACAGTGCTGTGGGTTT-3; antisense 5′-GACATGCAAGGAGTGCAAGA-3′). An estimate of Tg copy number was also discerned by green fluorescence intensity of fresh ear skin sections under fluorescence microscope (excitation at 488 nm) (Figure 1F).
Figure 1.
Validation of shRNA transgenic construct and genotyping of shRNA Tg mice. (A) siRNA knockdown of STC1 protein in C2C12 cells: Mouse C2C12 cells were transfected with 19-bp STC1 siRNA or 19-bp scrambled siRNA; 48 hours after transfection, cells were lysed and equal amounts of protein were run on SDS-PAGE; Western blot was probed with rabbit anti-STC1 antibody. (B) Cre recombinase excision of floxed PGK-EGFP reporter in pBlueH1EGFPFlox-transfected HEK293 cells: HEK293 cells were transfected with pCMV-Cre, pBlueH1EGFPFlox, or pCMV-Cre plus pBlueH1EGFPFlox; 48 hours after transfection, cells were scraped and collected by centrifugation; DNA was isolated and subjected to PCR amplification using primers that flank the PGK-EGFP sequences in pBlueH1EGFPFlox. DNA isolated from cells transfected with pCMV-Cre alone, yielded no product; DNA isolated from cells transfected with pBlueH1EGFPFlox alone yielded an expected 2625-bp product; DNA isolated from cells cotransfected with pCMV-Cre and pBlueH1EGFPFlox yielded a truncated PCR product of expected size (490 bp), confirming functional Flox P sites in pBlueH1EGFPFlox. (C) Expression of EGFP in pBlueH1EGFPFlox-transfected HEK293 cells: HEK293 cells were transfected with empty vector (pBlueH1), or pBlueH1EGFPFlox (PGK-driven EGFP); 48 hours after transfection, cells were lysed and equal amounts of protein were resolved on SDS-PAGE; Western blot was probed with anti-GFP; EGFP expression is observed in cells transfected with pBlueH1EGFPFlox but not in cells transfected with pBlueH1, confirming active EGFP reporter. (D) Knockdown of native STC1 expression in Att20/D16v-F2 cells transfected with pCMV-Cre and pBlueH1FloxEGFPSTC1shRNA. Att20/D16v-F2 cells were co-transfected with pCMV-Cre and pBlueH1FloxEGFPSTC1shRNA, or pCMV-Cre and pBlueH1FloxEGFPScrambledshRNA; 48 hours later, cells were lysed and equal amounts of protein were resolved on SDS-PAGE; Western blots were reacted with anti-STC1 and anti-actin; knockdown of STC1 protein is observed in cells cotransfected with pCMV-Cre and pBlueH1FloxEGFPSTC1shRNA but not in cells co-transfected with pCMV-Cre and pBlueH1FloxEGFPScrambledshRNA; these findings confirm H1-driven shRNA expression upon excision of floxed reporter and efficient knockdown of native STC1 expression in cells transfected with pBlueH1FloxEGFPSTC1shRNA, but not in cells transfected with pBlueH1FloxEGFPScrambledshRNA. Mouse genotyping: In addition to genotyping of shRNA Tg mice by PCR using EGFP-specific primers, transgenic mouse genotype and an estimate of copy number of the transgene may be discerned by green fluorescence intensity of kidney or ear skin fresh sections under fluorescence microscope: (E) kidney; (F) skin.
Expression of STC1 shRNA in Kidney Endothelial Cells Provides Efficient Knockdown of STC1 mRNA and Protein in the Entire Kidney
A previous report suggested restricted expression of STC1 mRNA to the collecting ducts (CDs) of adult murine kidney, while the protein was detected in PT, distal convoluted tubules, thick ascending limbs, and CDs.21 The disparity between the location of the mRNA, and the wide distribution of the protein within the kidney, as reported, presented a challenge: How does the protein reach distant targets far from the CDs, where the mRNA and protein are presumably expressed?
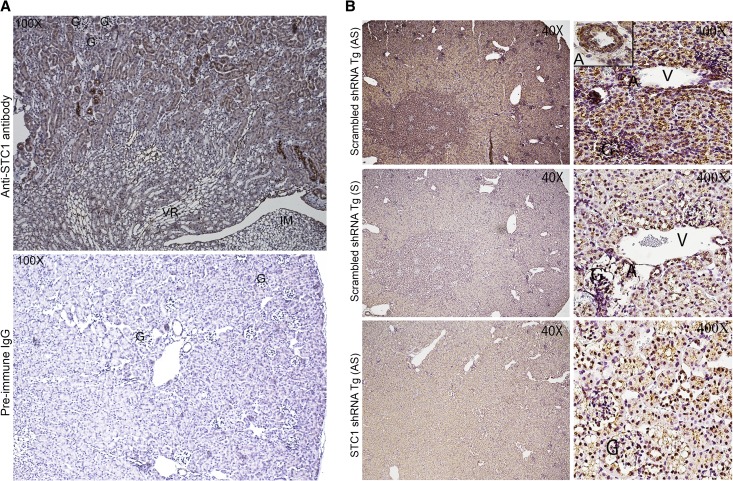
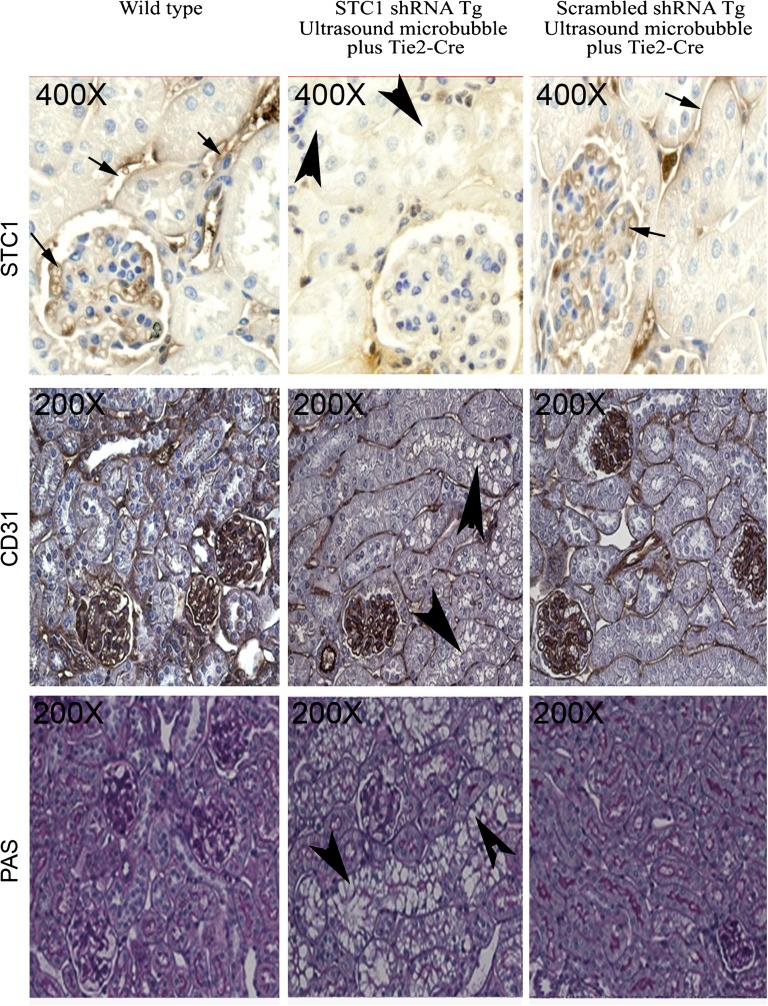
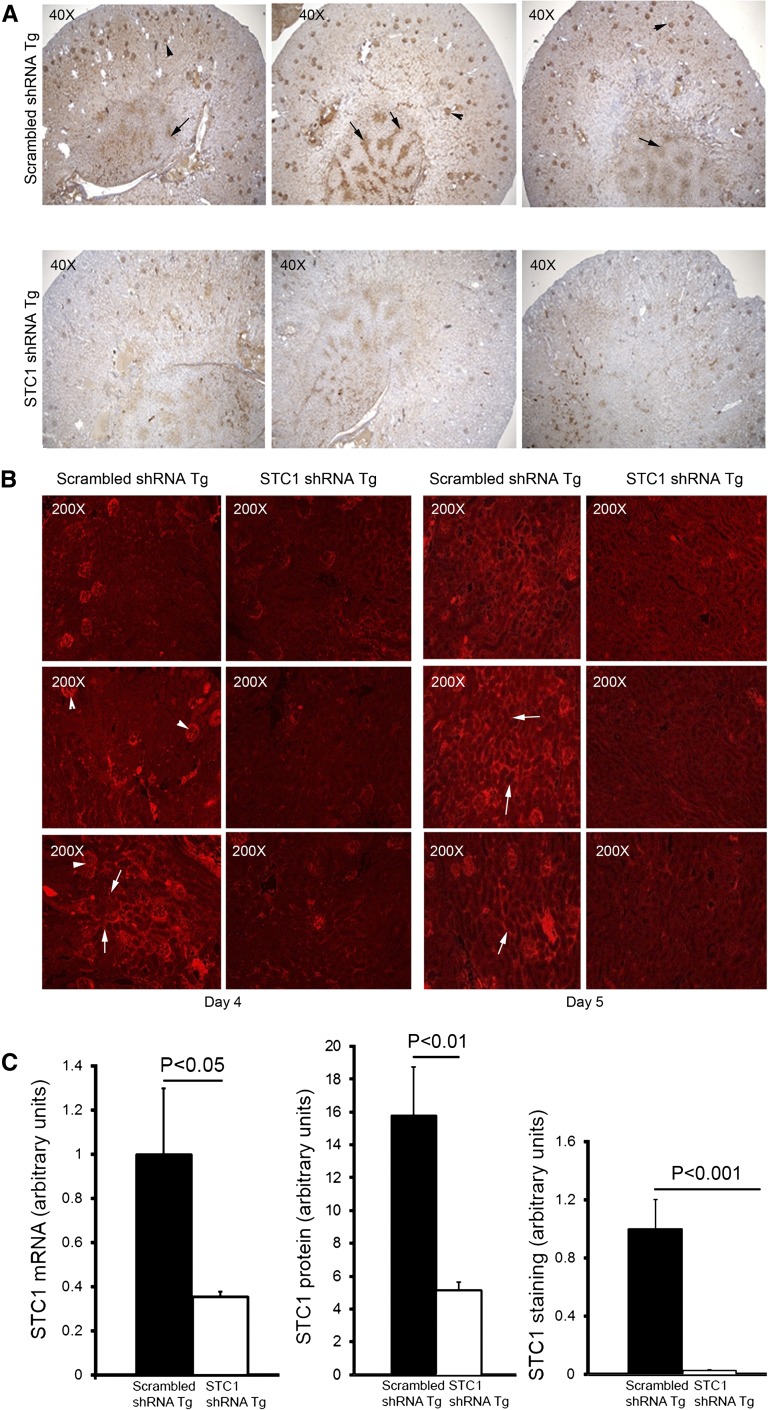
Our data reveal immunoreactivity for STC1 throughout the wild-type (WT) kidney, albeit at varying intensity. Of note, strong labeling for the protein is observed in some cortical tubules, possibly representing CDs (based on morphology; Figure 2A). Importantly, STC1 immunoreactivity is also detected in blood vessels in the cortex (including glomerular capillaries; Figure 3), and medullary rays (Figure 2A). An identical pattern of staining is observed in STC1 and scrambled shRNA Tg kidneys before delivery of pTie2-Cre (data not shown). In situ hybridization revealed expression of STC1 mRNA throughout the kidney, including all tubule segments, blood vessels (including arterial walls; Figure 2B) and cells within the glomeruli (tuft and parietal cells). Delivery of pTie2-Cre to STC1 shRNA Tg kidneys reduced the expression of STC1 mRNA and protein in the entire kidney 3- and 4-fold, respectively (Figures 2B, 3, and 4, A–C); similarly treated scrambled shRNA Tg kidneys displayed no change in the expression of the mRNA or protein (Figures 2B, 3, and 4, A–C ). Maximal knockdown of STC1 is achieved 4–5 days after delivery of pTie2-Cre to STC1 shRNA Tg kidneys (Figures 3 and 4) and is associated with tubular vacuolization in cortical tubules (Figures 3 and 5A). On the other hand, similarly treated scrambled shRNA Tg kidneys display no change in morphology (Figures 3 and 5A). High magnification images shown in Figure 3 illustrate identical kidney morphology and staining pattern for STC1 protein in WT and scrambled shRNA Tg kidney after delivery of pTie2-Cre.
Figure 2.
(A) Wide distribution of STC1 protein in the kidney and strong staining in blood vessels and some cortical tubules. Formalin-fixed and EDTA-treated WT kidney sections were stained with goat anti-STC1. Upper panel shows wide distribution of STC1 immunoreactivity (albeit with variable staining intensity); note strong staining in some cortical tubules, possibly representing CD and blood vessels including medullary rays. No staining is observed in preimmune serum-treated sections (lower panel). G, glomerulus; IM, inner medulla; VR, vasa recta. (B) Wide distribution of STC1 mRNA in the kidney. Upper panels: scrambled shRNA Tg kidneys harvested 4 days after the delivery of pTie2-Cre and probed with antisense STC1 probe reveal expression of STC1 mRNA (brown color) in the entire kidney; left upper corner inset in the cortical panel shows expression of STC1 mRNA in the endothelium and adventitia of a midsize artery. Middle panels: consecutive sections from scrambled shRNA Tg kidneys, shown in the upper panels, were probed with sense STC1 probe and show minimal background signal. Lower panel: sections from STC1 shRNA Tg kidneys harvested 4 days after the delivery of pTie2-Cre and probed with anti-sense STC1 probe; note diminished expression of STC1 mRNA in the entire kidney. A, artery; G, glomerulus; V, vein.
Figure 3.
Expression of STC1 protein in proximal tubules and glomerular and peritubular capillaries: Loss of STC1 immunoreactivity in shRNA Tg kidneys after delivery of pTie2-Cre is accompanied by tubular vacuolization. pTie2-Cre was delivered to the right kidney of STC1 shRNA and scrambled shRNA Tg mice; kidneys were harvested 4 days later. Methacarn-fixed kidney sections were stained with rabbit anti-STC1 antibody (top panels); anti-CD31 (middle panels); periodic acid–Schiff (bottom panels). Sections from WT kidneys were included for comparison. Strong immunoreactivity for STC1 in peritubular and glomerular capillaries (arrows) and positive staining in epithelial cells (brown hue). Similar distribution of STC1 immunoreactivity is observed in WT kidneys and scrambled shRNA Tg kidneys that were treated with pTie2-Cre. Delivery of pTie2-Cre to STC1 shRNA Tg kidneys leads to knockdown of STC1 expression in peritubular and glomerular capillaries, as well as epithelial cells; the appearance of tubular vacuolization (arrowheads). Expression of the endothelial cell marker, CD31, is not affected by delivery of pTie2-Cre to STC1 shRNA or scrambled shRNA Tg kidneys.
Figure 4.
Efficient whole kidney knockdown of STC1 mRNA and protein. pTie2-Cre was delivered to the right kidneys of STC1 and scrambled shRNA Tg mice; kidneys were harvested 2–5 days later (to establish time course), fixed with methacarn, and stained with rabbit anti-STC1. This antibody highlights the expression of STC1 in blood vessels. (A) STC1 immunolabeling in the kidneys of STC1 shRNA Tg and scrambled shRNA Tg mice 4 days after the delivery of pTie2-Cre. Representative images from three different mice per group are shown. Arrows point to medullary rays; arrowheads point to glomeruli. (B) STC1 immunofluorescence in the kidneys of STC1 shRNA Tg and scrambled shRNA Tg mice, 4 and 5 days after the delivery of pTie2-Cre. Kidney sections were stained with rabbit anti-STC1, followed by treatment with Texas red–tagged anti-rabbit. Representative cortical images from three different mice per group are shown. Arrowheads point to glomeruli; arrows point to circular structures, representing tubules and peritubular capillaries. (C) Bar graphs show quantitation of STC1 mRNA/actin mRNA using real-time PCR carried out on RNA representing whole kidney; quantitation of STC1 protein/actin protein on Western blots, using protein lysates representing whole kidney; quantitation of staining for STC1 using image tool software. Data represent the mean±SEM of six independent determinations.
Figure 5.
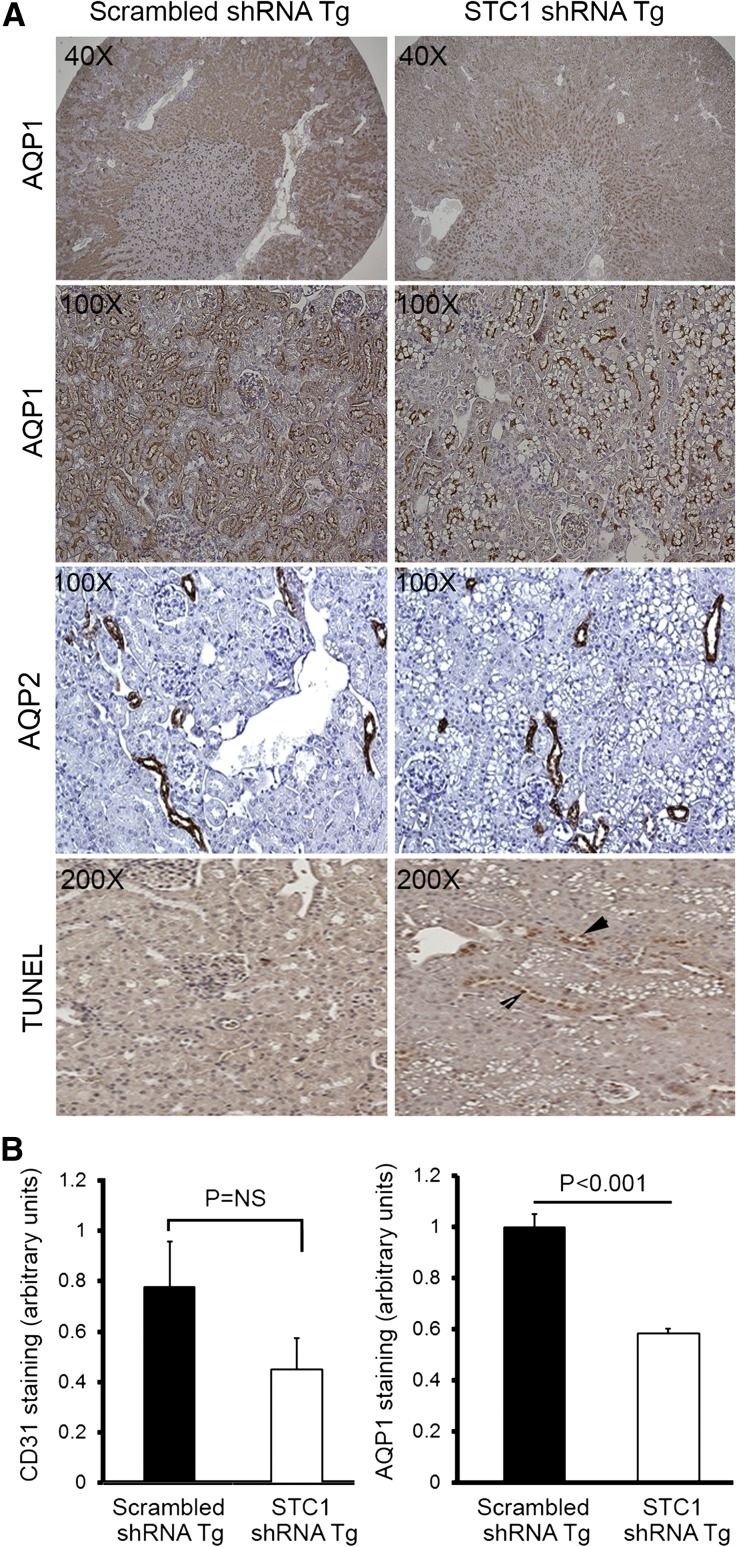
(A) STC1 knockdown induces vacuolization in S1 and S2 segments of the PT and promotes apoptosis. pTie2-Cre was delivered to the right kidneys of STC1 shRNA and scrambled shRNA Tg mice. Kidneys were harvested 4 days later and fixed in methacarn. Sections were stained with rabbit anti-AQP1, rabbit anti-AQP2, or TUNEL for apoptosis. Note that STC1 shRNA Tg kidneys display selective injury (vacuolization) in AQP1-positive tubules, in the outer two thirds of the cortex, with relative preservation of AQP1 staining in the inner third, consistent with tubular injury in the S1 and S2 segments of the PT. No vacuolization is observed in AQP2-expressing cells. Apoptotic cells (arrowheads) are more prevalent in STC1 shRNA Tg kidneys. (B) Apparent decrease in AQP1 and CD31 staining after STC1 knockdown does not correlate with decrease in protein expression (refer to C). Bar graphs show quantitation of staining for CD31 and AQP1 (using Image Tool software) 4 days after the delivery of Tie2-Cre to scrambled shRNA and STC1 shRNA Tg kidneys. (C) STC1 knockdown diminishes the expression of UCP2, but not AQP1 and CD31 proteins. Four days after the delivery of Tie2-Cre to scrambled shRNA and STC1 shRNA Tg kidneys, equal amounts of cortical homogenate in RIPA buffer were run on SDS-PAGE and blots were reacted with antibodies for CD31, UCP2, AQP1, and actin. Representative blots are shown. Bar graphs show the mean±SEM of band intensities for the above proteins normalized to actin; data represent six independent determinations.
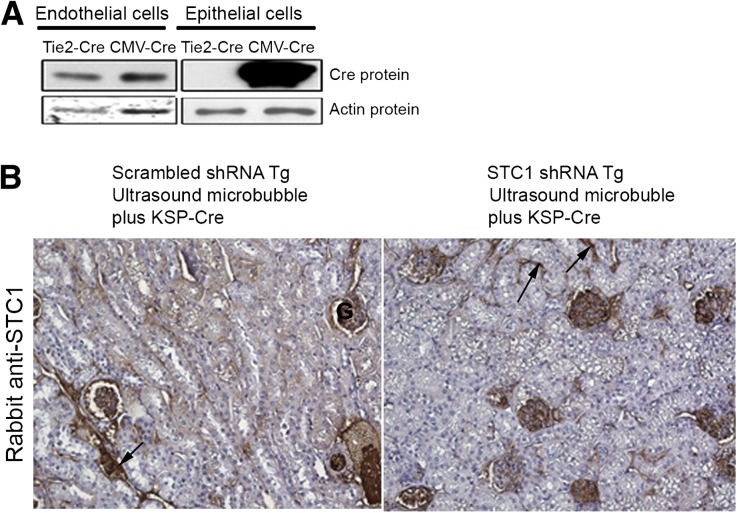
Acting on the assumption that pTie2-Cre might be expressed also in epithelial cells, we transfected cultured immortalized mouse proximal tubular epithelial cells (TKPTS22) and immortalized mouse kidney endothelial cells23 with pTie2-Cre or pCMV-Cre and found ample expression of Cre protein in endothelial cells transfected with either pTie2-Cre or pCMV-Cre; however, expression of Cre protein in epithelial cells was observed only upon transfection with pCMV-Cre, but not with pTie2-Cre (Figure 6A). The data suggest “overflow” of STC1 shRNA from endothelial cells and transfection of neighboring epithelial cells, providing efficient knockdown of STC1 mRNA and protein in the entire kidney, an approach that may be applied to knockdown any gene in a kidney-specific manner. Of note, we observed no change in the expression of STC1 protein in distant organs (liver, spleen, heart) after delivery of pTie2-Cre to STC1 shRNA Tg kidneys (data not shown). To validate the findings in epithelial cells, we delivered a plasmid that expresses Cre under the control of KSP-cadherin promoter, using ultrasound microbubbles; STC1 protein expression was diminished in epithelial cells and most peritubular capillaries but was well preserved in glomerular capillaries (Figure 6B). As observed following the delivery of pTie2-Cre, we found widespread vacuolization in epithelial cells, thus validating our observations upon delivery of pTie2-Cre.
Figure 6.
(A) Endothelium-specific expression of pTie2-Cre. Cultured TKPTS and endothelial cells were transfected with pTie2-Cre or pCMV-Cre; 48 hours after transfection, cells were lysed in RIPA buffer and equal amounts of proteins were resolved on SDS-PAGE; Western blots were reacted with anti-Cre and anti-actin. Cre protein is expressed in endothelial cells transfected with pTie2-Cre or pCMV-Cre; however, TKPTS express Cre protein upon transfection with pCMV-Cre, but not pTie2-Cre. (B) Epithelium-specific expression of STC1 shRNA also leads to epithelial vacuolization. KSP-Cre was delivered to the right kidneys of scrambled shRNA and STC1 shRNA Tg kidneys using ultrasound microbubbles. Kidneys were harvested 4 days later, and methacarn-fixed sections were subjected to immunolabeling using rabbit-anti STC1. Note diminished staining for STC1 in epithelial cells and most peritubular capillaries, whereas staining is preserved in glomerular capillaries. Concomitant with STC1 knockdown in epithelial cells, we observe widespread vacuolization in epithelial cells as observed following the delivery of pTie2-Cre.
Kidney-Specific Knockdown of STC1 Results in Kidney Injury Characterized by Increased Superoxide Generation, Activation of the UPR, Autophagy, Apoptosis, and AKI
Following the delivery of pTie2-Cre to STC1 shRNA Tg kidneys, we observed severe and widespread tubular epithelial cell injury in the cortex, characterized by vacuolization (Figures 3 and 5A). Staining for CD31, an endothelial cell marker, showed preservation of capillary morphology (Figure 3); CD31 staining density (Figure 5B) and protein expression (Figure 5C) were also unchanged. To further characterize the site and mechanism of vacuolization/injury, we examined the kidneys for expression of aquaporin-1 (AQP1), AQP2, lipid content (Oil Red O), and apoptosis terminal deoxynucleotidyl transferase-mediated digoxigenin-deoxyuridine nick-end labeling (TUNEL). As can be seen in Figure 5A, vacuolization is observed predominantly in tubules/cells that express AQP1 (a marker of proximal tubules in the cortex), but not AQP2 (a marker of principal cells in CD). AQP1 staining appears lower in the outer two thirds of the cortex but is preserved in the inner third of the cortex, suggesting that the vacuolization/injury involved S1 and S2 segments of the PT, sparing the S3 segment. Of note, while the injured segments show apparent decrease in staining for AQP1 (Figure 5, A and B), quantitative analysis of protein expression on Western blots representing cortical lysates revealed normal expression of AQP1 (Figure 5C). We attribute the discrepancy between the staining and Western blots to underestimation of staining for AQP1 protein by the imaging program due to vacuoles. We also observed an increase in the number of apoptotic cells; however, most apoptotic cells were in nephron segments not manifesting vacuolization, suggesting a differential response to stress by different tubule segments. Staining for Oil Red O was negative (data not shown).
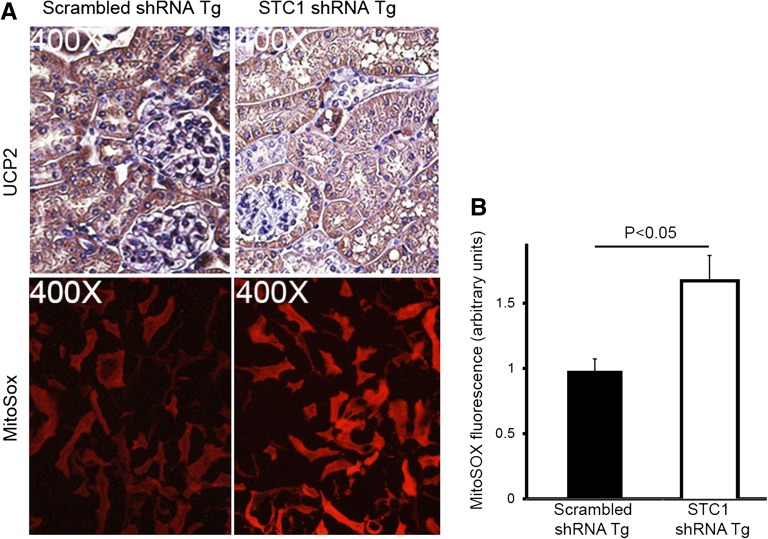
A potential explanation for the vacuolization/injury in PT cells is that reduced (absent) expression of STC1 in PT cells is insufficient for cytoprotection (induction of UCP2 for example). Suppression of superoxide generation by STC1 is dependent on the expression of UCPs in many cells/organs.7,24 Through autocrine/paracrine action, STC1 is expected to induce UCP2 expression (the prevailing UCP in the kidney) in epithelial cells and reduce superoxide. Indeed, as shown in Figures 5C and 7, delivery of pTie2-Cre to STC1 shRNA Tg kidneys is associated with lower UCP2 protein expression and higher MitoSOX fluorescence in kidney tubules compared with tubules of similarly treated scrambled shRNA Tg kidneys. The data suggest that epithelial cytoprotection by STC1 may be mediated through induction of UCP2 and suppression of superoxide generation.
Figure 7.
STC1 knockdown in the kidney is associated with diminished UCP2 expression and increased superoxide generation in kidney tubules. (A) pTie2-Cre was delivered to the right kidneys of STC1 and scrambled shRNA Tg mice. Kidneys were harvested 4 days later: methacarn-fixed sections were stained with rabbit anti-UCP2, and freshly isolated 1-mm-thick kidney slices were incubated with MitoSOX, followed by fixation in 4% paraformaldehyde. Kidney tissue was then imbedded in optical cutting temperature medium and 5-µM sections were viewed under a fluorescence microscope. Diminished staining for UCP2 in STC1 shRNA Tg kidneys correlates with higher superoxide generation (MitoSOX fluorescence). (B) Bar graph shows quantitation of MitoSOX fluorescence using Image Tool software in scrambled shRNA and STC1 shRNA Tg kidneys 4 days after the delivery of Tie2-Cre to the kidney. Data represent the mean±SEM of three independent determinations.
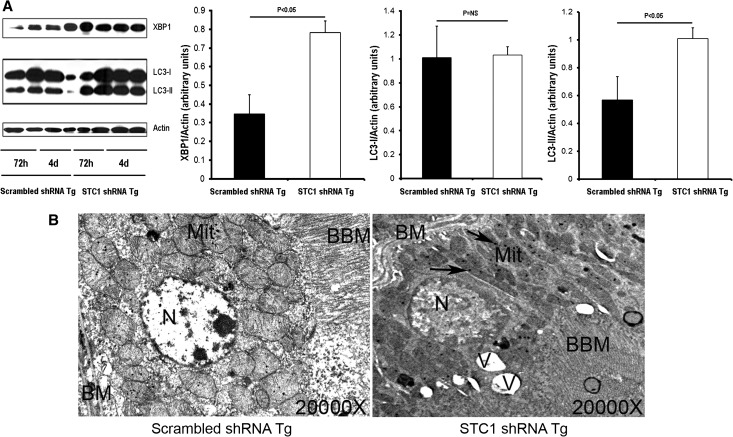
To further characterize the mechanism of kidney vacuolization/injury in STC1 shRNA Tg kidneys, we examined kidney lysates for activation of the UPR and initiation of autophagy. The UPR protects cells against the stress of misfolded proteins in the endoplasmic reticulum; X-box–binding protein 1 (XBP1) transcription factor is a key signal transducer for the UPR,25 and increased expression of XBP1 is critical for its activation. On the other hand, programmed cell death may be associated with the appearance of autophagosomes and depends on autophagy proteins. An important step in the generation of autophagosomes is the processing of microtubule-associated protein light chain 3 (LC3)-I to LC3-II, and the amount of LC3-II correlates with the extent of autophagosome formation.26 As shown in Figure 8, lysates from STC1 shRNA Tg kidneys display significantly higher levels of XBP1 and LC3-II compared with lysates from scrambled shRNA Tg kidneys, suggesting that STC1 knockdown causes kidney injury, associated with apoptosis (Figure 5A), activation of the UPR, and autophagy (Figure 8A), an indication of severe cell stress; hence, PT vacuolization is likely a manifestation of UPR activation and formation of autophagosomes. Consistent with the molecular data, electron microscopy reveals numerous vacuoles in PT cells of STC1 shRNA Tg kidney after STC1 knockdown; these vacuoles are accompanied by mitochondrial changes, characterized by fragmentation, loss of cristae, and the appearance of numerous inclusion bodies (Figure 8B).
Figure 8.
STC1 knockdown activates UPR and induces autophagy. (A) pTie2-Cre was delivered to the right kidneys of STC1 shRNA and scrambled shRNA Tg mice. Kidneys were harvested 3 or 4 days later and lysed in RIPA buffer. Equal amounts of proteins were resolved on SDS-PAGE, and Western blots were reacted with rabbit anti-XBP1, rabbit anti-LC3, and rabbit anti-actin. Representative blots are shown (n=2 for each time point; n=4 for cumulative data from days 3 and 4). Bar graphs represent the mean±SEM of four independent determinations (pooled data for 3 and 4 days). (B) Electron micrographs show vacuolization and mitochondrial changes after STC1 knockdown. BBM, brush border membrane; BM, basal membrane; Mit, mitochondria; N, nucleus; V, vacuole. Arrows point to mitochondrial inclusion bodies.
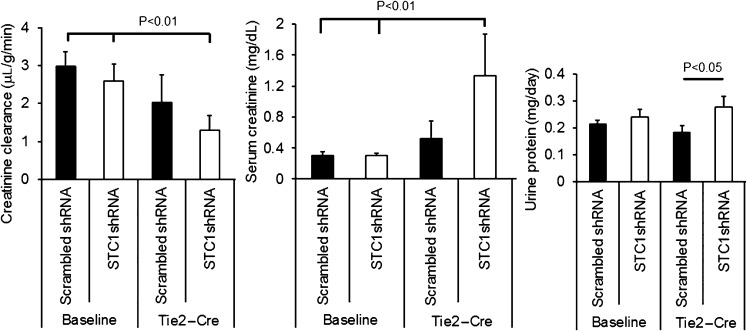
Next, we determined the effect of STC1 knockdown on kidney function and proteinuria. A week after uninephrectomy, we delivered pTie2-Cre to the remaining kidney; 4 days later, we measured serum creatinine, creatinine clearance, and protein concentration in the urine. As shown in Figure 9, STC1 knockdown led to increased serum creatinine, reduced creatinine clearance, and increased proteinuria in STC1 shRNA Tg mice after delivery of Tie2-Cre, consistent with AKI; we observed no changes in scrambled shRNA Tg kidneys.
Figure 9.
AKI after STC1 knockdown. Creatinine clearance, serum creatinine, and urine protein in scrambled shRNA and STC1 shRNA Tg mice 4 days after the delivery of Tie2-Cre.
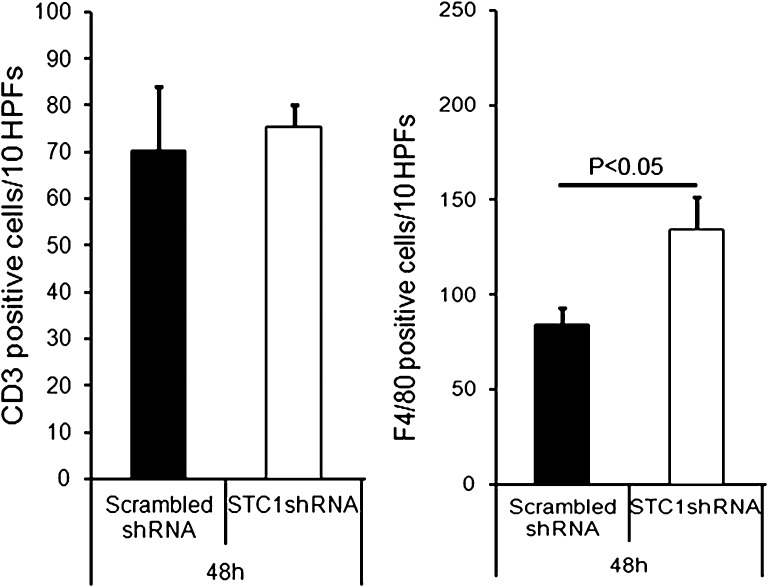
Previous data from our laboratory suggested an important role for STC1 in preserving endothelial barrier function11 and inhibition of macrophage migration.9 We therefore examined the kidneys for macrophages and T cells, using immunohistochemistry staining for F4/80 (a marker of macrophages and dendritic cells) and CD3 (a marker for T cells), respectively. As shown in Figure 10, knockdown of STC1 was associated with greater staining for F4/80, consistent with greater migration of macrophages into the kidney after STC1 knockdown.
Figure 10.
Knockdown of STC1 in the kidney is associated with greater macrophage infiltration. pTie2-Cre was delivered to the right kidneys of STC1 shRNA and scrambled shRNA Tg mice. Kidneys were harvested 4 days later, and methacarn-fixed sections were stained with rat anti-F4/80 (marker of macrophages/dendritic cells) or rabbit anti-CD3 (T-cell marker). Total F4/80+ and CD3+ cells infiltrating the cortex were counted, and the results were expressed as the total number of cells per 10 grids (1cm2 graded ocular grids viewed at ×20 magnification) spanning the entire cortex, using Nikon Eclipse 80i microscope system; bar graphs represents the mean±SEM of cell number from 10 grids. HPF, high-power field.
Discussion
The distribution of STC1 protein and mRNA in the kidney has been the subject of interest for many investigators. A previous report suggested restricted expression of STC1 mRNA to CDs of the adult murine kidney21; however, the protein is detected by immunohistochemistry in the PT, thick ascending limbs, distal convoluted tubules, CDs, and cells within the glomeruli.5,21,27,28 With the assumption that the protein is produced in the CDs, followed by secretion to the extracellular milieu, where it binds to neighboring cells, we could not explain the wide distribution of the protein within the kidney. Our data provide evidence for wide distribution and expression of STC1 mRNA and protein in the entire kidney, and acute knockdown of STC1 in the kidney diminishes epithelial cell survival, particularly in the PT. Absent STC1 expression, the kidney manifests severe tubular epithelial cell injury in the cortex, characterized by vacuolization, apoptosis, activation of the UPR, initiation of autophagy, and AKI.
Recent studies suggest that programmed cell death may be associated with the appearance of autophagosomes and depends on autophagy proteins. This form of cell death most likely corresponds to a process that has been morphologically defined as autophagic programmed cell death.29 Morphologic and histochemical studies cannot provide a causative relationship between the autophagic process and cell death, and it is unclear whether autophagic activity in dying cells is the cause of death or is actually an attempt to prevent it.29 Irrespective of whether autophagy is a pathway to cell death, or an attempt for survival, it appears that knockdown of STC1 leads to activation of a number of cell stress responses, indicating severe injury.
On the basis of the observations that vacuolization mainly affected AQP1-expressing cells/tubules in the outer two thirds of the cortex, we conclude that the injury involves mainly S1 and S2 segments of the PT. The reason for the susceptibility of these segments to injury upon knockdown of STC1 is unclear. In addition to absorbing the bulk of glomerular filtrate, the PT is tasked with detoxification and/or secretion of circulating waste products, which are expected to promote oxidant stress; with the knowledge that STC1 diminishes superoxide generation,7 we speculate that the PT may be overwhelmed by oxidant stress in the absence of STC1. Because the injury in the PT was unprovoked, except for the acute knockdown of STC1, we conclude that STC1 is required for the survival of PT cells under normal physiologic conditions. Thus, aberrations in STC1 expression may increase the susceptibility to oxidant injury and kidney pathology.
This paper also highlights important tools that can be used for kidney-specific gene manipulation. Using an ultrasound microbubble-mediated gene delivery system15 and shRNA Tg mice,14,30 it is possible to achieve conditional and sustained gene manipulation in a cell/organ-specific manner, thus avoiding (1) compensatory changes that might accompany global gene knockout or overexpression and (2) distant organ effects that might compound the interpretation of gene manipulation in multiple organs. Use of this technique also allows the study of genes for which global deletion might be lethal.
Concise Methods
Materials
All materials were purchased from Sigma-Aldrich (St. Louis, MO) unless stated otherwise. pTie2-Cre plasmid was a gift from Dr. Masashi Yanagisawa, University of Texas Southwestern.16 Goat anti-UCP2 was purchased from Lifespan Biosciences (Seattle, WA). Rabbit anti-XBP1 was purchased from Abcam, Inc. (Burlingame, CA). Rabbit anti-STC1 antibodies were a gift from Dr. Gert Flik (University of Nijmegen, The Netherlands31). Goat anti-hSTC1, rabbit anti-AQP1, rabbit anti-AQP2, rabbit anti-GFP, and goat anti-CD31 antibodies were purchased from Santa Cruz Biotechnology (Santa Cruz, CA). MitoSOX and TUNEL assay kits were purchased from Invitrogen (Grand Island, NY). Rabbit anti-CD3 antibody was purchased from EMD Millipore (Billerica, MA). Rat anti-F4/80 and rabbit anti-LC3 were purchased from AbD Serotec (Raleigh, NC). Rabbit anti-actin and rabbit anti-Cre were purchased from Sigma-Aldrich.
Mice
Male and female (20–25 g) STC1 shRNA and scrambled shRNA Tg mice, all on a C57B/6 background, were used. Mice were maintained in air-conditioned rooms under pathogen-free conditions with 12-hour light/dark cycles. They were given free access to food and water during the experiments. The investigation conformed to the Guide for the Care and Use of Laboratory Animals published by the National Institutes of Health, and the university ethics review board approved the animal studies.
Creatinine Clearance and Urine Protein Measurements
For timed urine collection, mice were placed in metabolic cages for 24 hours before euthanasia. Serum and urine creatinine measurements were carried out using a BioAssay Systems creatinine assay kit (Hayward, CA), as per manufacturer’s instructions, and creatinine clearance was calculated. Urinary protein concentrations were determined by the Bradford method, adapted to a microtiter plate assay. Bio-Rad protein assay dye reagent (Bio-Rad, Hercules, CA) was added to the diluted urine samples, and the absorbance at 595-nm wavelength was read on an ELX800 microplate reader (BioTek Instruments, Winooski, VT).
Production of Plasmid-Containing Lipid-Stabilized Microbubbles
Plasmid-containing lipid-stabilized microbubbles were generated as previously described.15,32 Briefly, a stock solution of 270 mg of 1,2-dipalmitoyl-sn-glycero-3-phosphocholine, 30 mg of 1,2-dipalmitoyl-rac-glycero-3-phosphoethanolamine, and 1g d-glucose were suspended in 10 ml PBS. This mixture was boiled in water until fully dissolved, generating liposome solution. Two milligrams of pTie2-Cre– or pKSP-Cre–expressing plasmid DNA were precipitated in 1 ml of ethyl alcohol and collected by centrifugation (10,000 g for 5 minutes). The DNA pellet was dissolved in 50 μl Lipofectamine 2000 (1 mg/ml; Invitrogen), and the DNA/Lipofectamine mixture was then added to 250 μl of liposome stock solution, 5 μl of 10% albumin, and 50 μl of glycerol (10 mg/ml) in a 1.5-ml Eppendorf tube, mixed well, and placed on ice. The headspace of the tube was then filled with perfluoropropane gas (Air Products and Chemicals, Allentown, PA), capped, and shaken for 30 seconds at 4°C, generating DNA-encapsulated microbubbles. The mean diameter and concentration of the microbubbles (±SD) were 1.9±0.2 μm and 5.2±0.3×10⁹ bubbles per ml, respectively (measured by a particle counter: Multisizer III; Beckman Coulter). The amount of plasmid carried by the microbubbles was 5±1 μg/μl; it was then diluted with 3 ml PBS just before injection into the tail vein (final concentration of DNA, 0.2 mg/0.3 ml).
Ultrasound Microbubble Destruction
Mice were anesthetized with inhaled 1% isoflurane administered through a nose cone. The posterior flank was shaved, and an S3 probe (Sonos 5500; Philips Ultrasound, Andover, MA) is placed to image the right kidney. A 27-gauge needle attached to a polyethylene tube (PE 50; Becton Dickinson [BD]) was inserted into the tail vein, and plasmid DNA incorporated within the phospholipid shell of perfluoropropane gas–filled microbubbles was infused at a constant rate of 12 ml/hr for 90 seconds. Ultrasound was directed at the kidney for microbubbles destruction within the kidney microcirculation; infusion of microbubbles without ultrasound was used as control. Throughout the infusion, microbubble destruction was achieved using the ultraharmonic mode (transmit 1.3 MHz/receive 3.6 MHz) with a mechanical index of 1.4 and depth of 2 cm. The ultrasound pulses were electrocardiography-triggered (at 85 milliseconds after the peak of the R wave) to deliver an ultrasound burst every fourth cardiac cycle. These settings have previously been shown to provide optimal gene delivery using ultrasound microbubble-targeted destruction.15,32 All mice were monitored after the experiment for normal behavior. Mice were euthanized killed at predetermined intervals, and kidneys were removed for further analysis.
Cell Culture and Transfection
TKPTS22 were grown in equal mix of DMEM+Ham F-12 medium supplemented with 50 μU/ml insulin and 7% FBS, at 37°C, under 5% CO2/95% air. Conditionally immortalized mouse kidney endothelial cells23 were grown at 33°C, under 5% CO2/95% air, in DMEM, supplemented with 10% FBS, 5 ml 100× MEM nonessential amino acid (Invitrogen), 5 ml of 100× MEM vitamin solution (Invitrogen), penicillin/streptomycin. Endothelial cells grow at 33°C but are quiescent at 37°C. C2C12 myoblasts (ATCC), HEK293 (ATCC), and Att20/D16v-F2 (ATCC) were maintained in DMEM supplemented with 10% FBS and penicillin/streptomycin. Plasmids and siRNAs were transfected into the cells using Lipofectamine 2000, following the manufacturer’s instructions. Cells were harvested at 48 hours after transfection for analysis.
Transwell Cocultures of Endothelial Cells and C2C12 Cells for In Vitro Cell-Based siRNA Delivery
Mouse kidney endothelial cells23 (4×10⁵ cells) were seeded on transwell inserts with a pore size of 0.4 μm (BD Biocoat; BD Biosciences, Woburn, MA) at 33°C, under 5% CO2/95% air. Twenty-four hours later, cells were transfected with Tie2-Cre plus pBlueH1FloxEGFPscrambledshRNA (expresses scrambled shRNA upon Cre excision) or Tie2-Cre plus pBlueH1FloxEGFPSTC1shRNA (expresses STC1 shRNA upon Cre excision), using Lipofectamine 2000 as per manufacturer’s instructions (Invitrogen). Twenty-four hours following transfection, inserts were washed twice with warm PBS and placed at the top chamber of a coculture setup, where the bottom chamber housed C2C12 cells (chosen because of the high baseline expression of STC1), seeded 24 hours earlier (4×10⁵ cells) and grown at 37°C, under 5% CO2/95% air. Forty-eight hours after co-culture, C2C12 cells were harvested and whole cell lysate was analyzed for STC1 expression using Western blot.
Immunohistochemistry
Formalin- or methanol-Carnoy (methacarn)–fixed kidney sections (4 μm) were subjected to staining (using standard techniques) with periodic acid–Schiff (for morphology), anti-STC1, anti-UCP2, anti-CD31, anti-AQP1, anti-AQP2, and apoptosis (TUNEL). Detection was carried out using a peroxidase enzyme-based detection system (Vector Laboratories). Photomicrographs were taken using a Nikon Eclipse 80i microscope system. For electron microscopy, kidney tissue was fixed in 1% glutaraldehyde in PBS and processed for electron microscopy by the electron microscopy laboratory at the Methodist Hospital (Houston, TX). Ultrathin 60- to 90-nm sections were collected on grids and stained with uranyl acetate for 15 minutes and lead citrate for 5 minutes, followed by electron microscopy imaging.
Real-Time PCR
Total RNAs was prepared from mouse kidney tissues using TRIzol reagent (Invitrogen, Grand Island, NY) according to the manufacturer's instructions. Total RNA was treated with DNase I (Sigma-Aldrich, St. Louis, MO) before cDNA production using cDNA synthesis Kit (Bio-Rad). Reaction conditions for cDNA synthesis were 25°C for 5 minutes, 42°C for 30 minutes, and 85°C for 5 minutes. Real-time PCR was performed using Bio-Rad real-time PCR CFX 96 system. Sequences for real-time PCR primers: STC1 forward primer (5′-CCATCACTGAAGTCATACA-3′) and reverse primer (5′-TCATCACATTCCAGAAGG-3′); β-actin forward primer (5′-ATCTTCCGCCTTAATACT-3′), and reverse primer (5′-GCCTTCATACATCAAGTT-3′). Twenty five nanograms of total RNA was used for each PCR reaction with SYBR Green (Bio-Rad) detection at 10-µl reaction volumes. The reaction conditions for PCR were (stage 1, Rep 1×) 95°C for 3 minutes, (stage 2, Rep 1×) 95°C for 5 seconds, and (stage 3, Rep 39×) 60°C for 30 seconds, followed by 60–95°C for 5 seconds. Relative mRNA expression levels were calculated from cycle threshold (Ct) values using β-actin as the endogenous control (relative expression=2(targetCt−referenceCt)).
In Situ Hybridization
Primers were based on sequences derived from mouse cDNA, accession NM_0092851; 5′-end sequence extends from base 3187–3212 (5′-gtaccaacaatgcacatatctacaca-3′), and 3′-end sequence extends from base 3557–3582 (5′-tacatttttaagctccatgtgcatat-3′). Templates for riboprobes were synthesized by PCR of mouse genomic DNA, incorporating T7 promoter (CTAATACGACTCACTATAGGG) into the primers. In vitro transcription was performed using digoxigenin RNA labeling reagents and T7 RNA polymerase (Roche, Indianapolis, IN), as previously described.33,34 Briefly, 5-μm sections from formalin-fixed and paraffin-embedded tissue were deparaffinized in xylene, followed by hydration in graded ethanol. Next, sections were treated with proteinase K (20 μg/ml) at 37°C for 30 minutes, followed by two washes in Tris-buffered saline (composition: 150 mM NaCl, 2 mM KCl, 25 mM Tris, pH 7.4). Tissue sections were prehybridized for 2 hour at 55°C, in mRNA hybridization buffer (EMD Millipore), followed by hybridization overnight at 55°C in hybridization buffer containing sense or antisense riboprobe at a concentration of 200 ng/ml. Sections were then washed twice in 2×saline-sodium citrate (SSC) buffer (1×SSC=150 mM NaCl, 15 mM trisodium citrate, pH 7.0) at 45°C, followed by incubation with a 1/35 dilution of RNase A cocktail (Ambion, Austin, TX) in 2×SSC for 30 minutes at 37°C. The slides were then washed three times in 2×SSC/50% formamide at 55°C, and once in 0.08×SSC at 55°C. After incubation with horseradish peroxidase–conjugated anti-digoxigenin antibody (Roche), the signal was amplified with biotinyl-tyramide, followed by secondary streptavidin complex, and developed with diaminobenzidine Chromagen (GenPoint kit; DAKO, Carpinteria, CA).
SDS-PAGE
Lysates representing cultured cells or kidney lysates, prepared as previously described,12 were suspended in modified radioimmunoprecipitation assay buffer (composition: 150 mM NaCl; 50 mM Tris-HCl [pH 7.4]; 1% NP-40; 0.25% sodium deoxycholate; 1 mM EDTA; 1×cocktail proteinase inhibitors), and centrifuged at 8000g for 10 minutes as 4°C to remove cell debris. Fifty-microgram proteins were resolved on 12% SDS-PAGE, transferred to nitrocellulose membrane, and incubated with primary antibodies for STC1; EGFP; Cre-recombinase; LC3; XBP1; and CD31, UCP2, AQP1, and actin. After washing with PBS containing 0.1% Tween-20, the membrane was incubated with horseradish peroxidase–conjugated secondary antibody. The bound antibodies were visualized using chemiluminescence.
MitoSOX Fluorescence
Freshly isolated kidneys were sectioned coronally to obtain 1-mm-thick slices that were incubated in PBS containing 5 µM MitoSOX Red reagent (Invitrogen) for 10 minutes. MitoSOX permeates live cells and selectively targets the mitochondria; it is rapidly oxidized by superoxide and emits red fluorescence. Following incubation with MitoSOX, kidney slices are rinsed in PBS, fixed in 4% paraformaldehyde, and embedded in optimal cutting temperature compound (Sakura Finetek/VWR; Batavia, IL); 5-µM sections were viewed under fluorescence microscope.
Statistical Analyses
Data are expressed as mean±SEM and were compared by one-way ANOVA for three or more groups or unpaired t test using GraphPad Prism 4. Statistical significance of difference is defined by P<0.05.
Disclosures
None.
Supplementary Material
Acknowledgments
This work was supported by grants from the National Institute of Diabetes and Digestive and Kidney Diseases at the National Institutes of Health (R01-DK080306; T32-DK062706). This project was also supported by the Pathology and Histology Core at Baylor College of Medicine with funding from the National Institutes of Health (NCI P30-CA125123), a generous gift from Dr. and Mrs. Harold Selzman, and the expert assistance of Michael Ittmann, MD, PhD.
Footnotes
Published online ahead of print. Publication date available at www.jasn.org.
This article contains supplemental material online at http://jasn.asnjournals.org/lookup/suppl/doi:10.1681/ASN.2013070690/-/DCSupplemental.
References
- 1.De Niu P, Radman DP, Jaworski EM, Deol H, Gentz R, Su J, Olsen HS, Wagner GF: Development of a human stanniocalcin radioimmunoassay: Serum and tissue hormone levels and pharmacokinetics in the rat. Mol Cell Endocrinol 162: 131–144, 2000 [DOI] [PubMed] [Google Scholar]
- 2.Re RN, Cook JL: The mitochondrial component of intracrine action. Am J Physiol Heart Circ Physiol 299: H577–H583, 2010 [DOI] [PMC free article] [PubMed] [Google Scholar]
- 3.Jellinek DA, Chang AC, Larsen MR, Wang X, Robinson PJ, Reddel RR: Stanniocalcin 1 and 2 are secreted as phosphoproteins from human fibrosarcoma cells. Biochem J 350: 453–461, 2000 [PMC free article] [PubMed] [Google Scholar]
- 4.Luo CW, Kawamura K, Klein C, Hsueh AJ: Paracrine regulation of ovarian granulosa cell differentiation by stanniocalcin (STC) 1: Mediation through specific STC1 receptors. Mol Endocrinol 18: 2085–2096, 2004 [DOI] [PubMed] [Google Scholar]
- 5.McCudden CR, James KA, Hasilo C, Wagner GF: Characterization of mammalian stanniocalcin receptors. Mitochondrial targeting of ligand and receptor for regulation of cellular metabolism. J Biol Chem 277: 45249–45258, 2002 [DOI] [PubMed] [Google Scholar]
- 6.Sazonova O, James KA, McCudden CR, Segal D, Talebian A, Wagner GF: Stanniocalcin-1 secretion and receptor regulation in kidney cells. Am J Physiol Renal Physiol 294: F788–F794, 2008 [DOI] [PubMed] [Google Scholar]
- 7.Wang Y, Huang L, Abdelrahim M, Cai Q, Truong A, Bick R, Poindexter B, Sheikh-Hamad D: Stanniocalcin-1 suppresses superoxide generation in macrophages through induction of mitochondrial UCP2. J Leukoc Biol 86: 981–988, 2009 [DOI] [PMC free article] [PubMed] [Google Scholar]
- 8.Sheikh-Hamad D: Mammalian stanniocalcin-1 activates mitochondrial antioxidant pathways: New paradigms for regulation of macrophages and endothelium. Am J Physiol Renal Physiol 298: F248–F254, 2010 [DOI] [PMC free article] [PubMed] [Google Scholar]
- 9.Kanellis J, Bick R, Garcia G, Truong L, Tsao CC, Etemadmoghadam D, Poindexter B, Feng L, Johnson RJ, Sheikh-Hamad D: Stanniocalcin-1, an inhibitor of macrophage chemotaxis and chemokinesis. Am J Physiol Renal Physiol 286: F356–F362, 2004 [DOI] [PubMed] [Google Scholar]
- 10.Chakraborty A, Brooks H, Zhang P, Smith W, McReynolds MR, Hoying JB, Bick R, Truong L, Poindexter B, Lan H, Elbjeirami W, Sheikh-Hamad D: Stanniocalcin-1 regulates endothelial gene expression and modulates transendothelial migration of leukocytes. Am J Physiol Renal Physiol 292: F895–F904, 2007 [DOI] [PubMed] [Google Scholar]
- 11.Chen C, Jamaluddin MS, Yan S, Sheikh-Hamad D, Yao Q: Human stanniocalcin-1 blocks TNF-alpha-induced monolayer permeability in human coronary artery endothelial cells. Arterioscler Thromb Vasc Biol 28: 906–912, 2008 [DOI] [PMC free article] [PubMed] [Google Scholar]
- 12.Huang L, Garcia G, Lou Y, Zhou Q, Truong LD, DiMattia G, Lan XR, Lan HY, Wang Y, Sheikh-Hamad D: Anti-inflammatory and renal protective actions of stanniocalcin-1 in a model of anti-glomerular basement membrane glomerulonephritis. Am J Pathol 174: 1368–1378, 2009 [DOI] [PMC free article] [PubMed] [Google Scholar]
- 13.Huang L, Belousova T, Chen M, DiMattia G, Liu D, Sheikh-Hamad D: Overexpression of stanniocalcin-1 inhibits reactive oxygen species and renal ischemia/reperfusion injury in mice. Kidney Int 82: 867–877, 2012 [DOI] [PMC free article] [PubMed] [Google Scholar]
- 14.Peng S, York JP, Zhang P: A transgenic approach for RNA interference-based genetic screening in mice. Proc Natl Acad Sci U S A 103: 2252–2256, 2006 [DOI] [PMC free article] [PubMed] [Google Scholar]
- 15.Shimoda M, Chen S, Noguchi H, Matsumoto S, Grayburn PA: In vivo non-viral gene delivery of human vascular endothelial growth factor improves revascularisation and restoration of euglycaemia after human islet transplantation into mouse liver. Diabetologia 53: 1669–1679, 2010 [DOI] [PMC free article] [PubMed] [Google Scholar]
- 16.Kisanuki YY, Hammer RE, Miyazaki J, Williams SC, Richardson JA, Yanagisawa M: Tie2-Cre transgenic mice: A new model for endothelial cell-lineage analysis in vivo. Dev Biol 230: 230–242, 2001 [DOI] [PubMed] [Google Scholar]
- 17.Bekeredjian R, Chen S, Frenkel PA, Grayburn PA, Shohet RV: Ultrasound-targeted microbubble destruction can repeatedly direct highly specific plasmid expression to the heart. Circulation 108: 1022–1026, 2003 [DOI] [PubMed] [Google Scholar]
- 18.Chen S, Ding J, Yu C, Yang B, Wood DR, Grayburn PA: Reversal of streptozotocin-induced diabetes in rats by gene therapy with betacellulin and pancreatic duodenal homeobox-1. Gene Ther 14: 1102–1110, 2007 [DOI] [PubMed] [Google Scholar]
- 19.Cohen HC, Xiong MP: Non-cell-autonomous RNA interference in mammalian cells: Implications for in vivo cell-based RNAi delivery. J RNAi Gene Silencing 7: 456–463, 2011 [PMC free article] [PubMed] [Google Scholar]
- 20.Brummelkamp TR, Bernards R, Agami R: A system for stable expression of short interfering RNAs in mammalian cells. Science 296: 550–553, 2002 [DOI] [PubMed] [Google Scholar]
- 21.Wong CK, Ho MA, Wagner GF: The co-localization of stanniocalcin protein, mRNA and kidney cell markers in the rat kidney. J Endocrinol 158: 183–189, 1998 [DOI] [PubMed] [Google Scholar]
- 22.Ernest S, Bello-Reuss E: Expression and function of P-glycoprotein in a mouse kidney cell line. Am J Physiol 269: C323–C333, 1995 [DOI] [PubMed] [Google Scholar]
- 23.Langley RR, Ramirez KM, Tsan RZ, Van Arsdall M, Nilsson MB, Fidler IJ: Tissue-specific microvascular endothelial cell lines from H-2K(b)-tsA58 mice for studies of angiogenesis and metastasis. Cancer Res 63: 2971–2976, 2003 [PubMed] [Google Scholar]
- 24.Liu D, Huang L, Wang Y, Wang W, Wehrens XH, Belousova T, Abdelrahim M, DiMattia G, Sheikh-Hamad D: Human stanniocalcin-1 suppresses angiotensin II-induced superoxide generation in cardiomyocytes through UCP3-mediated anti-oxidant pathway. PLoS ONE 7: e36994, 2012 [DOI] [PMC free article] [PubMed] [Google Scholar]
- 25.Lee AH, Iwakoshi NN, Glimcher LH: XBP-1 regulates a subset of endoplasmic reticulum resident chaperone genes in the unfolded protein response. Mol Cell Biol 23: 7448–7459, 2003 [DOI] [PMC free article] [PubMed] [Google Scholar]
- 26.Kabeya Y, Mizushima N, Ueno T, Yamamoto A, Kirisako T, Noda T, Kominami E, Ohsumi Y, Yoshimori T: LC3, a mammalian homologue of yeast Apg8p, is localized in autophagosome membranes after processing. EMBO J 19: 5720–5728, 2000 [DOI] [PMC free article] [PubMed] [Google Scholar]
- 27.Deol H, Stasko SE, De Niu P, James KA, Wagner GF: Post-natal ontogeny of stanniocalcin gene expression in rodent kidney and regulation by dietary calcium and phosphate. Kidney Int 60: 2142–2152, 2001 [DOI] [PubMed] [Google Scholar]
- 28.Kobayashi R, Nakagomi Y, Shimura Y, Mochizuki M, Kobayashi K, Sugita K, Ohyama K: Expression of stanniocalcin-1 in gastrointestinal tracts of neonatal and mature rats. Biochem Biophys Res Commun 389: 478–483, 2009 [DOI] [PubMed] [Google Scholar]
- 29.Tsujimoto Y, Shimizu S: Another way to die: autophagic programmed cell death. Cell Death Differ 12[Suppl 2]: 1528–1534, 2005 [DOI] [PubMed] [Google Scholar]
- 30.Gao X, Zhang P: Transgenic RNA interference in mice. Physiology (Bethesda) 22: 161–166, 2007 [DOI] [PubMed] [Google Scholar]
- 31.Wendelaar Bonga SE, Smits PW, Flik G, Kaneko T, Pang PK: Immunocytochemical localization of hypocalcin in the endocrine cells of the corpuscles of Stannius in three teleost species (trout, flounder and goldfish). Cell Tissue Res 255: 651–656, 1989 [DOI] [PubMed] [Google Scholar]
- 32.Chen S, Shohet RV, Bekeredjian R, Frenkel P, Grayburn PA: Optimization of ultrasound parameters for cardiac gene delivery of adenoviral or plasmid deoxyribonucleic acid by ultrasound-targeted microbubble destruction. J Am Coll Cardiol 42: 301–308, 2003 [DOI] [PubMed] [Google Scholar]
- 33.Iacobuzio-Donahue CA, Ryu B, Hruban RH, Kern SE: Exploring the host desmoplastic response to pancreatic carcinoma: gene expression of stromal and neoplastic cells at the site of primary invasion. Am J Pathol 160: 91–99, 2002 [DOI] [PMC free article] [PubMed] [Google Scholar]
- 34.St Croix B, Rago C, Velculescu V, Traverso G, Romans KE, Montgomery E, Lal A, Riggins GJ, Lengauer C, Vogelstein B, Kinzler KW: Genes expressed in human tumor endothelium. Science 289: 1197–1202, 2000 [DOI] [PubMed] [Google Scholar]
Associated Data
This section collects any data citations, data availability statements, or supplementary materials included in this article.


