

Abstract
Metabolic acidosis, a common complication of CKD, causes mitochondrial stress by undefined mechanisms. Selective autophagy of impaired mitochondria, called mitophagy, contributes toward maintaining cellular homeostasis in various settings. We hypothesized that mitophagy is involved in proximal tubular cell adaptations to chronic metabolic acidosis. In transgenic mice expressing green fluorescent protein–tagged microtubule-associated protein 1 light chain 3 (GFP-LC3), NH4Cl loading increased the number of GFP puncta exclusively in the proximal tubule. In vitro, culture in acidic medium produced similar results in proximal tubular cell lines stably expressing GFP-LC3 and facilitated the degradation of SQSTM1/p62 in wild-type cells, indicating enhanced autophagic flux. Upon acid loading, proximal tubule–specific autophagy-deficient (Atg5-deficient) mice displayed significantly reduced ammonium production and severe metabolic acidosis compared with wild-type mice. In vitro and in vivo, acid loading caused Atg5-deficient proximal tubular cells to exhibit reduced mitochondrial respiratory chain activity, reduced mitochondrial membrane potential, and fragmented morphology with marked swelling in mitochondria. GFP-LC3–tagged autophagosomes colocalized with ubiquitinated mitochondria in proximal tubular cells cultured in acidic medium, suggesting that metabolic acidosis induces mitophagy. Furthermore, restoration of Atg5-intact nuclei in Atg5-deficient proximal tubular cells increased mitochondrial membrane potential and ammoniagenesis. In conclusion, metabolic acidosis induces autophagy in proximal tubular cells, which is indispensable for maintaining proper mitochondrial functions including ammoniagenesis, and thus for adapted urinary acid excretion. Our results provide a rationale for the beneficial effect of alkali supplementation in CKD, a condition in which autophagy may be reduced, and suggest a new therapeutic option for acidosis by modulating autophagy.
Metabolic acidosis (MA) is one of the clinically common complications in patients with CKD.1 Gradual deterioration of kidney function causes mild retention of acids, leading to substantial adverse effects including the development of mineral and bone disorders, increased muscle protein degradation, impairment of glucose tolerance, progression of kidney diseases, and, most importantly, increased mortality. In healthy individuals, the kidney (as well as lung) has an important role in the maintenance of systemic acid base balance by excreting acid in amounts that are equal to the extrarenal acid production. The kidney has the ability to filter and reabsorb bicarbonate, synthesize ammonium, and excrete hydrogen ions. Ammoniagenesis in the mitochondria of the proximal tubular cells (PTCs) is the catabolic process in which glutaminase catalyzes glutamine into α-keto glutarate and NH4+, and plays a central role among adaptive responses to MA.
Several recent clinical trials have demonstrated that alkali supplementation can retard the progression of CKD.2–4 This finding shows that MA in itself can cause cellular dysfunction; however, there is a surprising lack of experimental knowledge on the precise mechanism of cellular dysfunction associated with chronic MA. A few prior studies have reported the changes in kidney gene or protein expression in the PTCs of chronically acid-loaded animals.5,6 These studies have provided insight into the alterations of mitochondrial metabolism that either accompany or support the increased catabolism of glutamine, suggesting that MA imposes substantial stress on mitochondria. Supporting evidence has come from the observation that mitochondria isolated from the kidneys of acid-loaded rats showed slightly lower membrane potential and efficiency in oxidative phosphorylation with mild uncoupling compared with control mitochondria, whereas no significant differences were detected in liver mitochondria.7 Moreover, in response to acid load, mitochondria accumulates Ca2+ to cope with high cytosolic Ca2+ influx, which in turn promotes stimulation of reactive oxygen species (ROS) generation at the level of the respiratory chain. These data lead us to speculate that constitutive renovation of mitochondria is a prerequisite for kidney tubules to cope with MA.
Macroautophagy, hereafter referred to simply as autophagy, is a highly evolutionally conserved degradation process by which cytosolic materials (including macromolecules such as proteins and lipids) and damaged organelles are nonselectively broken down to their basic components.8–11 The association of autophagy with the pathogenesis of various disorders, such as neurodegenerative diseases, cancer, and infection, has been revealed in recent years.12 Kidney disease is not an exception. Because the proximal tubules are potentially energy wasting and work to degrade proteins, autophagy has been supposed to play an important role in the physiology of proximal tubules. Indeed, by administering autophagy inhibitors or by using kidney-specific autophagy-deficient mice, many studies have revealed that autophagy has a protective role against PTC damage by ischemia-reperfusion13–16 and nephrotoxic reagents, including cisplatin17–20 and cyclosporine.21,22
Recent studies have indicated that autophagosomes can degrade the mitochondria in a selective manner (mitophagy), although autophagy was long assumed to be defined as the nonselective bulk degradation of cytoplasmic long-lived proteins and organelles. When the autophagy system senses signals from damaged mitochondria, an early autophagic membrane is recruited or de novo synthesized to form a double membrane along the engulfed mitochondria, and is then degraded in lysosomes. Because mitochondria are susceptible to damage mediated by ROS, maintaining an intact population of mitochondria through quality control mechanisms appears to be essential for cell survival under conditions of pathologic stress.23,24
On the basis of this background information, we hypothesized that autophagy in the kidney proximal tubules counteracts MA by alleviating mitochondrial stress and thereby maintaining mitochondrial homeostasis. In this study, we first examined whether MA could induce autophagy in proximal tubules in vivo and in vitro, respectively. We then analyzed mitochondrial function and morphology by using acid-loaded autophagy-deficient mice and autophagy-deficient PTC lines cultured in acidic medium, especially focusing on ammonium production, respiratory chain function, mitochondrial morphology, and mitochondrial membrane potential. In addition, we investigated whether MA could induce mitophagy.
Results
MA Induces Autophagy Exclusively in PTCs In Vivo and In Vitro
To investigate the induction of autophagy in kidney proximal tubules in an acidic environment, we induced MA by administering ammonium chloride (NH4Cl) in drinking water for 30 days in green fluorescent protein–tagged microtubule-associated protein 1-light chain 3 (GFP-LC3) transgenic mice, a mouse model in which autophagosomes are labeled with GFP-positive puncta in almost all tissues.25 The number of GFP-LC3 puncta increased significantly in the kidney tubular cells of the acid-loaded mice compared with those of the control mice (Figure 1A, left). Coimmunostaining with megalin, a marker of PTCs, indicated that GFP-LC3 dots localized only in the proximal tubules, but not in other kidney segments or other organs (data not shown). We examined whether an acidic condition could induce autophagy in cultured PTC lines stably expressing GFP-LC3. When cultured under an acidic condition (pH 6.5), a marked increase in GFP-positive puncta was observed (Figure 1A, right). Next we performed the SQSTM1/p62 turnover assay, in which degradation of the SQSTM1/p62 protein serves as a tracer of autophagic activation.26 It was demonstrated that the SQSTM1/p62 protein was degraded in a time-dependent manner when cells were cultured in an acidic medium (pH 6.5), whereas the protein level remained unchanged when cultured in a normal medium (pH 7.4) (Figure 1B). The expression of SQSTM1/p62 mRNA was unchanged when cells were cultured in acidic or normal medium (data not shown).
Figure 1.

MA activates autophagic flux exclusively in kidney PTCs. (A) LC3 dot formation increased in the PTCs of GFP-LC3 transgenic mice under MA, caused by NH4Cl feeding for 30 days (n=3, respectively; left), and in immortalized PTCs stably transfected with GFP-LC3 and cultured in acidic medium (pH 6.5) (n=5, respectively; right). Kidney sections are coimmunostained for megalin, a marker of proximal tubules in red (left) and for DAPI in blue (right). (B) Autophagic flux is estimated by the SQSTM1/p62 degradation assay using PTCs (n=3, respectively). (C and D) Accumulation of SQSTM1/p62-positive (C) and ubiquitin-positive (D) aggregates in proximal tubules of Atg5F/F:KAP and control mice with or without acid loading (n=5, respectively). The number of SQSTM1/p62-positive or ubiquitin-positive dots is counted in at least 10 high-power fields. All values are given as the mean±SEM. *P<0.05. DAPI, 4',6-diamidino-2-phenylindole; F/F, Atg5F/F mice; F/F:KAP, Atg5F/F:KAP mice. Bar, 50 μm in A (left), C, and D; 5 μm in A (right).
Furthermore, we analyzed the histologic changes in the kidneys of proximal tubule–specific autophagy-deficient mice (Atg5F/F:KAP mice) after administering NH4Cl in their drinking water for 30 days. Although periodic acid–Schiff staining revealed no apparent morphologic change between acid-loaded and vehicle-treated Atg5F/F:KAP mice (Supplemental Figure 1), acid-loaded Atg5F/F:KAP mice exhibited an increased number of SQSTM1/p62 and ubiquitin-positive aggregates in the kidney PTCs compared with the vehicle-treated Atg5F/F:KAP mice, whereas they were rarely seen in the acid-loaded or vehicle-treated control mice (Figure 1, C and D). This suggested that these aggregates should be degraded by autophagy under MA. Collectively, these data suggests that MA increases autophagic flux exclusively in the kidney proximal tubules in vivo and in vitro to play possible role(s) under MA.
Autophagy Contributes to the Compensation for MA through Assisting Ammoniagenesis
Using acid-loaded Atg5F/F:KAP mice, we performed physiologic analysis to examine whether autophagy functions to compensate for MA. It is apparent that MA was induced by administering NH4Cl, because both control and Atg5F/F:KAP mice exhibited significantly increased urinary excretion of ammonium (Supplemental Figure 2). Although we could not observe a change in arterial blood pH or bicarbonate in wild-type mice after administering NH4Cl, the acid-loaded Atg5F/F:KAP mice showed significantly more severe acidosis than the acid-loaded controls (Figure 2A). We next examined the effect of autophagy on ammonium production (ammoniagenesis) in three different kidney sections (Figure 2B). Acid loading significantly induced ammoniagenesis both in the cortex and medulla of control mice, but not in the cortex and medulla of Atg5F/F:KAP mice (Figure 2C). The difference was prominent in the outer medulla, where kidney androgen-regulated protein (KAP) is predominantly expressed (Kimura et al.15; Supplemental Figure 3). Moreover, to confirm the compensatory mechanism of autophagy for acid load in vitro, we analyzed ammoniagenesis using immortalized Atg5-deficient (Atg5-negative) kidney PTCs, and autophagy-competent (Atg5-positive) kidney PTCs as a control. Similar to in vivo analysis, acid-loaded Atg5-negative PTCs produced a lower amount of ammonia than Atg5-positive PTCs (Figure 2D). These results suggest that autophagy in the PTCs contributes to compensation for MA through assisting ammoniagenesis.
Figure 2.

Autophagy deficiency blunts the compensation by PTCs against MA. (A) Arterial blood pH (left) and bicarbonate concentration (right) of control and Atg5F/F:KAP mice with or without acid loading (n=5, vehicle-treated Atg5F/F mice; n=6, other groups). (B and C) Ammoniagenesis in kidney sections from control and Atg5F/F:KAP mice with or without acid loading (n=4, respectively). Kidney sections are obtained as indicated with the dotted line in B. (D) Ammoniagenesis in Atg5-positive and Atg5-negative PTCs cultured under normal and acidic media (n=3, respectively). All values are given as the mean±SEM. *P<0.05. Atg5(+), Atg5-positive PTC; Atg5(−), Atg5-negative PTC; F/F, Atg5F/F mice; F/F:KAP, Atg5F/F:KAP mice.
Autophagy Protects Mitochondrial Function and Morphology from Acid Loading
Recent cumulative evidence suggests that autophagy controls the quality of mitochondria by selective elimination of impaired mitochondria, which is called mitophagy.23 Given that ammonia production, which is mainly managed in mitochondria, is reduced in autophagy-deficient PTCs under acidic conditions, we hypothesized that mitochondrial functions might be impaired in acid-loaded autophagy-deficient mice. To examine the mitochondrial functions in vivo, we measured the enzymatic activities of cytochrome oxidase (COX) and succinate dehydrogenase (SDH) on kidney sections in situ, both of which reflect mitochondrial respiratory function (Figure 3, A and B).27 Atg5F/F:KAP mice showed less COX and SDH staining (which was prominent under MA) compared with control mice.
Figure 3.
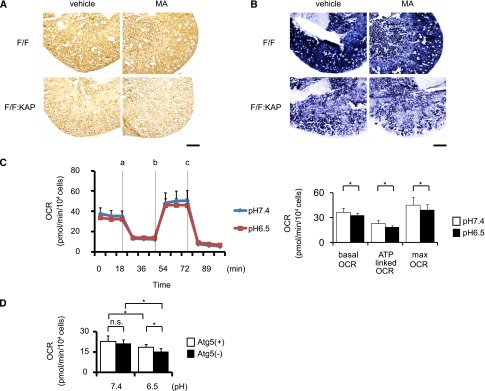
Autophagy deficiency reduces mitochondrial respiration activity under MA. (A and B) COX staining (left) and SDH staining (right) of kidney sections of control and Atg5F/F:KAP and control mice with or without MA. (C) Tracing of the OCR of Atg5-positive PTCs cultured under normal pH and acidic conditions (left). Measurements are performed in triplicate under basal status and after addition of 1 μM of oligomycin (point a), 0.5 μM of FCCP (point b), and 0.1 μM of rotenone and antimycin A (point c) (n=18, pH 7.4; n=20, pH 6.5). The ATP-linked OCR represents the difference of the OCR between the basal level (point a) and after treatment with 1 μM of oligomycin (point b). The maximum OCR represents the value after treatment with 0.5 μM of FCCP (point c) (n=18, Atg5(+) pH 7.4; n=20, other groups; right) (also see Supplemental Figure 4). The former indicates the OCR for generating ATP, and the latter indicates the latent OCR independent of the mitochondrial membrane potential, which is another type of mitochondrial function. (D) The ATP-linked OCR in Atg5-positive and Atg5-negative PTCs with or without acid loading (n=18, Atg5(+) pH 7.4; n=20, other groups). All values are given as the mean±SEM. *P<0.05. F/F, Atg5F/F mice; F/F:KAP, Atg5F/F:KAP mice; Atg5(+), Atg5-positive PTC; Atg5(−), Atg5-negative PTC; FCCP, carbonyl cyanide 4-(trifluoromethoxy) phenylhydrazone. Bar, 500 μm in A and B.
We next measured the mitochondrial oxygen consumption rate (OCR) of kidney PTCs in vitro to quantitatively demonstrate the mitochondrial dysfunction under acidic conditions (Figure 3, C and D). The effect of acid loading on the OCR was assessed by comparing the response of PTCs to mitochondrial inhibitors, including oligomycin (an ATP synthase inhibitor), protonophore carbonyl cyanide 4-(trifluoromethoxy) phenylhydrazone (FCCP, a mitochondrial uncoupler), rotenone, and antimycin (inhibitors of the mitochondrial respiratory chain) (Supplemental Figure 4). The basal OCR, the ATP-linked OCR, and maximum respiratory function were significantly reduced by acid loading (Figure 3C). The reduction in the ATP-linked OCR by acid loading became even more pronounced in Atg5-negative PTCs than in Atg5-positive PTCs (Figure 3D). Together, these results indicate the reduced activity of mitochondrial respiratory activity in Atg5F/F:KAP mice under MA.
We next assessed mitochondrial morphology using electron microscopy. Acid loading resulted in severe mitochondrial fragmentation and swelling with derangement of the cristae of the Atg5F/F:KAP kidney compared with vehicle treatment, whereas there was no remarkable morphologic change in the mitochondria of either the vehicle-treated or the acid-loaded wild-type mice (Figure 4).
Figure 4.

Autophagy deficiency distorts the mitochondrial morphology of the PTCs under MA. Electron microscopic images of kidney sections of control and Atg5F/F:KAP mice with or without MA are presented. F/F, Atg5F/F mice; F/F:KAP, Atg5F/F:KAP mice. Bar, 5 μm in top row; 500 nm in bottom row.
We further examined the mitochondrial membrane potential (Δψm) of Atg5-positive and Atg5-negative PTCs with or without acid loading using tetramethylrhodamine ethyl ester (TMRE) (Figure 5). Δψm was significantly reduced both in Atg5- positive and Atg5-negative PTCs by acid loading but the reduction was more prominent in Atg5-negative PTCs. The uptake of TMRE into mitochondria can be dependent on the intracellular concentration, which in turn is determined by the cell membrane potential. Therefore, we assessed the plasma membrane potential (Δψp) by using DiBAC4(3), a bis-oxonol-type, membrane potential–sensitive dye. It was demonstrated that there was no difference in the Δψp between Atg5-positive and Atg5-negative PTCs with or without acid loading (Supplemental Figure 5).
Figure 5.

Autophagy deficiency reduces the mitochondrial membrane potential in the PTCs under MA. The mitochondrial membrane potential of Atg5-positive and Atg5-negative PTCs cultured under normal and acidic media is assessed by TRME (n=5, respectively). All values are given as the mean±SEM. *P<0.05. Atg5(+), Atg5-positive PTC; Atg5(−), Atg5-negative PTC. Bar, 50 μm.
Collectively, PTCs in acid-loaded Atg5-deficient mice and/or Atg5-deficient cultured cells exhibited reduced mitochondrial function and distorted morphology under acidic condition.
Acid Loading Induces Mitophagy in PTCs
Because autophagy has been known to selectively degrade mitochondria (in the process called mitophagy), we examined whether acid loading induces autophagy to eliminate impaired mitochondria. We estimated the extent of mitophagy by staining mitochondria with MitoTracker Red FM in GFP-LC3–transfected PTCs after treating with bafilomycin A1, a specific inhibitor of the vacuolar type H+-ATPase (Figure 6A). Representative images demonstrated that more autophagosomes were colocalized with mitochondria in cells under the acidic condition than under the normal condition (indicated by yellow dots in pseudocolor images in Figure 6A). To assess the colocalization objectively, we used the Pearson correlation coefficient as the quantification method.28 This also showed the significant difference between acidic and normal conditions (Figure 6B). Furthermore, to investigate whether ubiquitinated mitochondria were recognized as a target of autophagic degradation, we constructed GFP-LC3 and mStrawberry-ubiquitin double-transfected PTCs, and then stained mitochondria with MitoTracker Deep Red FM after arresting autophagosome degradation with bafilomycin A1. Representative images showed that more autophagosomes were localized with mitochondria and ubiquitin under the acidic condition than under the normal condition (Figure 6C). Quantification using the Pearson correlation coefficient presented the significant difference between acidic and normal conditions (Figure 6D). These results show that autophagy actively eliminates acid load–induced impaired mitochondria.
Figure 6.

Acid loading induces mitophagy in the PTCs. (A) PTCs isolated from wild-type mice stably expressing GFP-LC3 are stained with MitoTracker Red FM after treatment with 200 nM of bafilomycin A1 2 hours before harvesting (n=5). Yellow dots in merged images represent colocalization of mitochondria and autophagosomes. (B) Colocalization is assessed by Pearson’s correlation. (C) PTCs isolated from wild-type mice stably expressing GFP-LC3 and mStrawberry-ubiquitin are stained with MitoTracker Deep Red FM after treatment with 200 nM of bafilomycin A1 2 hours before harvesting (n=5). White dots in merged images represent colocalization of ubiquitinated mitochondria and autophagosomes. All values are given as the mean±SEM. *P<0.05. MTR Red FM, MitoTracker Red FM; MTR Deep Red FM, MitoTracker Deep Red FM. Bar, 5 μm.
Restoring Autophagic Activity Regains Ammoniagenesis via Quality Control of Mitochondria in the Acidic Condition In Vitro
To verify that autophagy contributes to mitochondrial homeostasis under MA, we generated a transmitochondrial cybrid, which is a useful method for studying the functional effects of mitochondria in a defined nuclear background.29 At first, we generated a “rescue cybrid” by fusing the mitochondrial donor cells originating from Atg5-negative PTCs and the nuclear donor cells originating from Atg5-positive PTCs, with a “control cybrid” as a control, by fusing the mitochondrial donor cells and the nuclear donor cells, both of which originate from Atg5-negative PTCs (Figure 7A). Although the mitochondrial membrane potential was reduced and ammoniagenesis was blunted in the control cybrid under the acidic condition, both were significantly recovered in the rescue cybrid (Figure 7, B and C). These results indicate that the rescue cybrid could eliminate the damaged mitochondria from Atg5-negative PTCs by restoring the autophagic degradation process.
Figure 7.

Restoring autophagic activity regains ammoniagenesis via quality control of mitochondria in acidic conditions in vitro. (A) Schematic illustration of the generation of a transmitochondrial cybrid. (B and C) Mitochondrial membrane potential as assessed by TMRE staining (B) and ammoniagenesis (C) of the rescue cybrid and control cybrid cultured under normal or acidic media (n=3, respectively). The cybrid generated by fusion of the mitochondrial donor cells derived from Atg5-negative PTCs and the nuclear donor cells derived from Atg5-positive PTCs is defined as a rescue cybrid, whereas the cybrid generated by fusion of the mitochondrial donor and the nuclear donor, both of which are derived from Atg5-negative PTCs, is defined as a control cybrid. All values are given as the mean±SEM. *P<0.05. mtDNA, mutant mitochondrial DNA.
Discussion
In this study, we provide several lines of evidence that autophagic renovation of mitochondria in PTCs copes with MA-caused cellular stresses. MA was seen to induce autophagy exclusively in the PTCs. Otherwise, mitochondrial impairment became apparent and was observed as follows: (1) ammoniagenesis in the mitochondria was blunted, (2) mitochondrial respiratory chain function was impaired, and (3) mitochondrial morphology was biased toward fission status with marked swelling. Autophagy deficiency triggers a vicious cycle in which disturbed ammoniagenesis fails to compensate for MA, which further deteriorates mitochondrial dysfunction. Notably, these findings could be unique to PTCs, because an increase of ammoniagenesis in response to acid loading was defective in other kidney cells, including M-1 collecting duct cells and mouse primary mesangial cells, and knockdown of Atg5 did not affect the level of ammonia production (Supplemental Figure 6 and data not shown). We further demonstrated that mitochondria are the major target of autophagy (Figure 8). In previous studies, MA was found to activate a series of regulatory mechanisms to compensate for disordered acid-base balance, including complement activation,30 endothelin production, and activation of the renin-angiotensin system.31–33 This subsequently induced additional kidney damage. However, in contrast with clinical consequences such as the development of a catabolic state,34 development or exacerbation of bone disease,35 and deterioration of kidney function,36 the decisive mechanism by which MA induces cellular dysfunction was largely unknown. This study unraveled the molecular mechanism of MA-associated kidney dysfunction, thereby providing the rationale for the beneficial effect of alkali supplementation for patients with CKD.
Figure 8.

The proposed mechanism of autophagic renovation of mitochondria in PTCs under acidic conditions. MA-induced damaged mitochondria are eliminated adequately in the autophagy-competent condition (left), whereas damaged mitochondria accumulates in cytoplasm in the autophagy-deficient condition (right), which leads to decompensation for MA and triggers a vicious cycle.
Several prior studies have reported that, in tumor cells, extracellular acidosis resulted from hypoxic condition due to chaotic vasculature, and glycolytic phenotype induces autophagy, which serves as an adaptation mechanism for cell survival by fueling energy.37 In particular, elevated autophagy maintained chronically in low pH–conditioned cells allowed the cells to restore their proliferative capacity for 3 months.38 The contribution of activated autophagy is quite different between PTCs and tumor cells because tumor cells often downregulate mitochondrial respiration in preference to aerobic glycolysis.39
Mitophagy is a selective type of autophagy in which specifically targeted mitochondria are degraded by the autophagic process, and it plays an important role in the quality control of mitochondria.23 Recent studies have shown that canonical (nonselective) autophagy and mitophagy share similar core autophagosome/mitophagosome-formation machinery, but that distinct steps and molecules are involved in each autophagic process.24 In mitophagy, defective mitochondria are recognized via specific receptors and cargos, and are targeted to autophagosomes depending on organs, cells, and developmental stages. For example, mitophagy in yeast is mediated by the mitochondrial proteins Atg32 and Uth1, which serve as the mitochondrial receptors for vacuole targeting.40,41 Mitophagy also plays an essential role in erythrocyte maturation42 via the outer mitochondrial membrane receptor Nix (or Bnip3l) and the autophagosome-associated protein LC3.43 The elimination of damaged mitochondria in mammals is mediated by a pathway composed of phosphatase and tensin homolog–induced putative protein kinase 1 (PINK1) and the E3 ubiquitin ligase Parkin.44 PINK1 and Parkin accumulate on damaged mitochondria and target these organelles for autophagic degradation in a process that requires Parkin-dependent ubiquitination of mitochondrial proteins. Autophagic degradation of mitochondria has been observed in the kidney, particularly in the proximal tubules, in both physiologic15 and pathologic settings, including MA (in this study), ischemia-reperfusion injury,15 and nephropathic cystinosis.45 In a strict sense, we cannot exclude the possibility that mitochondria are “predominantly” degraded by canonical autophagy. However, the observation that ubiquitinated mitochondria colocalize with the autophagosomal protein LC3 (Figure 6), which appears to be important in the mitophagic process, suggests that mitophagy, rather than canonical autophagy, is induced by MA in the proximal tubules. Although we did not examine the expression or localization of receptor/cargo molecules such as Nix, Parkin, and PINK, the observation that GFP-positive puncta in acid-loaded GFP-LC3 transgenic mice were found exclusively in the PTCs strongly suggests that a distinct step in recognizing defective mitochondria and in targeting them to autophagosomes is involved in the PTCs. A more precise molecular mechanism by which damaged mitochondria are recognized in PTCs needs to be elucidated in the future.
It intrigues us to think how autophagy is activated in the PTCs by sensing the changes in pH, bicarbonate, and carbon dioxide (CO2) status. Some molecular pH sensors in the kidney were recently identified, including acid/alkali-sensing receptors (GPR4, InsR-RR),46–48 kinases (Pyk2, ErbB1/2),49–51 and others. It is possible that intracellular signaling downstream of these receptors/kinases can activate autophagy; however, signals from exhausted mitochondria are a more plausible candidate. Mitochondria are dynamic organelles that constantly undergo cycles of fission and fusion.52 Mitochondria fission is a response to diverse insults such as ischemia, ROS, and aging. Mitochondrial membrane potential (Δψm), the driving force for mitochondrial ATP synthesis, has an important role in the interplay between mitochondrial dynamics and mitophagy.53 In the mitochondrion’s life cycle, depolarized mitochondria are temporarily fragmented and segregated from the mitochondrial network. When mitochondria restore the Δψm, mitochondrial fusion may recruit the restored mitochondria into the mitochondrial network. Thus, the fission events and reduction of Δψm have been demonstrated to play a role in isolating dysfunctional mitochondria to prevent the release of cytochrome c and ROS and in separating mitochondria harboring mutant mitochondrial DNA copies. Other factors, including mitochondrial uptake of calcium ion (Ca2+) and ROS production, also interdependently contribute to triggering the mitophagic machinery.54,55 Observations in the present study and from other investigative groups that MA induces mitochondrial fragmentation and swelling (Figure 4), the reduction in Δψm (Figure 5), and mitochondrial accumulation of Ca2+,7 some of which become apparent only when autophagy is inhibited, support the speculation that signaling from impaired mitochondria via MA induces mitophagy.
Although autophagy was inhibited by genetic manipulation in this study, autophagic activity could actually decline in clinical practice. One prominent example is aging. Age-associated reduction in autophagic activity has been considered to contribute to the aging process.56 Indeed, the capacity to excrete acid in the urine becomes diminished with age due to a reduction in ammonium production independent of a decreased GFR.57 Another example is diabetes mellitus. Prior studies have elucidated that rodent models of streptozotocin-induced diabetes demonstrate nephropathy affecting both the proximal and distal tubular segments, and are characterized by the early inhibition of autophagy.58 It should be determined whether reduced autophagic activity might attenuate the compensation for MA (and thereby deteriorate kidney function) in human diabetic nephropathy.
In conclusion, this study clearly proved that MA inflicted mitochondrial stress on renal PTCs. Autophagy plays an essential role in the degradation of mitochondria for quality control leading to the maintenance of mitochondrial function in MA. It is a novel finding that autophagy has an influence on the kidneys, not only with regard to the cytoprotective pathway but also in the maintenance of basic physiologic functions.
Concise Methods
Animals
Atg5F/F:KAP mice15 and GFP-LC3 transgenic mice25 were previously described. Proximal tubule–specific autophagy-deficient mice were generated by crossing KAP-Cre transgenic mice, in which Cre recombinase is expressed under control of the KAP gene promoter, and mice bearing an Atg5 flox allele (Atg5F/F mice). KAP-Cre/CAG-CAT-Z male mice, in which β-galactosidase expression reflects Cre activity, exhibited LacZ-positive tubules in the cortex and the outer medulla, whereas LacZ-positive tubules were absent in female mice (Kimura et al.15; Supplemental Figure 3). Therefore, only male mice were used in this study. All experiments were performed using 8-week-old male mice. All animal experiments were approved by the institutional committee of the Animal Research Committee of Osaka University and were in accordance with the Japanese Animal Protection and Management Law (no. 25).
Induction of MA
For induction of MA, mice were given 0.28 M NH4Cl+0.5% sucrose in drinking water (tap water) for 30 days. Control animals received tap water with 0.5% sucrose ad libitum. All animals had free access to standard rodent chow. To confirm induction of acidosis, the blood gas data (blood pH and bicarbonate concentration) were measured by using the RAPID Lab 348 blood gas system (Siemens, Munich, Germany).
Histologic Analyses
Mice were transcardially perfused with 4% paraformaldehyde in PBS (pH 7.4). The kidneys were removed, sectioned and postfixed in paraformaldehyde, and then embedded in paraffin or frozen in optimum cutting temperature compound (Sakura Finetek, Torrance, CA). Periodic acid–Schiff staining was performed on paraffin sections. Immunohistochemical staining for SQSTM1/p62 and ubiquitin was performed on the paraffin-embedded sections after antigen retrieval via autoclaving in 0.01 mM citrate buffer (pH 6.0) for 10 minutes at 120°C and blocking with 1% BSA (Sigma-Aldrich, St. Louis, MO) in PBS for 60 minutes. Sections were incubated with primary antibodies at 4°C overnight, and were then visualized with a horseradish peroxidase–diaminobenzidine compound (Nichirei, Tokyo, Japan). To assess GFP-positive dots, postfixed frozen tissue was sectioned and immunostained with megalin (a PTC marker) antibody. Immunofluorescence images were collected using an Olympus FV1000-D confocal laser scanning microscope (Olympus, Tokyo, Japan). Five images were collected for each sample and then LC3 dots were counted and expressed as the number per cell. For electron microscopy, the kidneys were fixed with 2% glutaraldehyde and were observed using a Hitachi H-7650 transmission electron microscope (Hitachi, Tokyo, Japan).
Antibodies
Antibodies used included the following: antibodies for SQSTM1/p62 (Progen, Heidelberg, Germany), ubiquitin (Cell Signaling Technology, Danvers, MA), megalin (gift from Toshimi Michigami), β-actin (Sigma-Aldrich), biotinylated secondary antibodies (Vector Laboratories, Burlingame, CA), and peroxidase-conjugated secondary antibodies (DAKO, Glostrup, Denmark).
Measurement of Ammonium Concentration
The kidneys were frozen in liquid nitrogen immediately after harvesting. The frozen kidney was sectioned perpendicular to its long axis at 5- to 10-μm thickness and divided into three adjacent sections, as shown in Figure 2B. Each sample was steeped with the reagent containing sodium phosphotungstic acid to remove extra protein. The ammonium concentration was measured with the Wako NH3 test (Wako Pure Chemicals, Osaka, Japan). After the total ammonium concentration was determined, the samples were homogenized and the pellet was resuspended in 1 N sodium hydroxide, shaken overnight, and analyzed for total protein concentration by the Pierce protein assay reagent (Thermo Fisher Scientific, Rockford, IL) as a standard. Ammonium contents in the original tissue slices were determined as ammonium concentration per milligram of protein. Ammoniagenesis in the PTCs was assessed by the ammonium concentration in culture medium incubated for 24 hours in pH-adjusted medium.
COX and SDH Staining
Fresh cryosections (10-μm thick) from the kidneys were incubated in each solution. For COX staining, the sections were incubated in a solution consisting of 2 μg/ml of catalase (Cell Signaling Technology), 1 mg/ml of cytochrome c (Cell Signaling Technology), and 0.5 mg/ml of 3,3′-diaminobenzidine tetrahydrochloride (Wako Pure Chemicals) in 0.1 M of phosphate buffer (pH 7.4) for 1 hour at 37°C. SDH staining was performed according to the modified method of Martin et al.59 In brief, we prepared a nitroblue tetrazolium (NBT) stock solution composed of 6.5 mg/dl of potassium cyanide, 185 mg/dl of EDTA, and 100 mg/dl of NBT in 0.1 M phosphate buffer (pH 7.6) and 500 mM of sodium succinate solution. The sections were incubated in a solution mixed with 2 ml of NBT stock solution, 0.2 ml of succinate solution, and 0.7 mg of phenazine methosulfate for 15 minutes at 37°C.
Cell Culture
Autophagy-deficient and autophagy-competent PTC lines were previously described.15 In brief, Atg5-deficient kidney PTCs (Atg5-negative PTCs) were isolated from 3-week-old Atg5F/F:KAP mice and immortalized by using pEF321-T, an SV-40 large T antigen expression vector. As a control, we generated Atg5-positive PTCs by stably transfecting pMRX-IRES-Atg5-bsr (Atg5-expressing retroviral vector cassette) to Atg5-negative PTCs. We also isolated PTCs from wild-type mice and immortalized cell lines were established by transformation using pEF321-T, an SV-40 large T antigen expression vector. We transfected the pEGFP-LC3 vector (a gift from T. Yoshimori) to the wild-type PTC lines and then constructed GFP-LC3 transgenic PTC lines. Cells were cultured in DMEM (D5030; Sigma-Aldrich) containing 5% FBS at 37°C under a humidified atmosphere of 5% CO2 and 95% air. The different pH of the medium was obtained by reducing the concentration of sodium bicarbonate to 25 mM and adding an appropriate concentration of hydrochloric acid, and then equilibrating the medium in the cell culture incubator overnight. Twenty-four hours after the seeding, the cells were incubated for 24 hours in pH-adjusted medium before harvest.
Measurement of Mitochondrial Membrane Potential
Cells cultured in 35-mm glass-bottom dishes were subjected to the confocal analysis. The mitochondrial membrane potential was determined by staining with 50 nM of TMRE (T669; Invitrogen, Carlsbad, CA) for 30 minutes at 37°C. Then, the fluorescent images were collected using the Olympus FV1000-D (Olympus). The intensity of TMRE was measured using ImageJ (available at http://rsbweb.nih.gov/ij/index.html; National Institutes of Health, Bethesda, MD) within five sections for a given cell and corrected fluorescence-positive areas in each section.
Measurement of Mitochondrial Respiratory Function
The mitochondrial OCR was measured using the Seahorse XF96 analyzer (Seahorse Bioscience, Billerica, MA). Atg5-positive PTCs and Atg5-negative PTCs were plated at the appropriate cell density on XF96 tissue culture plates and cultured in pH-adjusted medium for 24 hours. Before the respiration assay, the cells were rinsed and cultured in DMEM running medium consisting of 8.3 g/L of DMEM (D5030; Sigma-Aldrich), 2 mM of glutamine, 100 mM of sodium pyruvate, 25 mM of D-glucose, 1.85 g of sodium chloride, and 15 mg of phenol red (P5530; Sigma-Aldrich), which was adjusted to pH 7.4 with sodium hydroxide according to the manufacturer’s protocol. The OCR was measured under the basal condition and in the presence of 0.1 μg/ml oligomycin A (A8674; Sigma-Aldrich) to measure ATP-linked OCR, as well as in the presence of 0.5 μM of carbonyl cyanide 4-(trifluoromethoxy) phenylhydrazone (C2920; Sigma-Aldrich) and under the mitochondria-independent respiratory level (in the presence of 0.1 μM of rotenone [R8875; Sigma-Aldrich] and antimycin A [A8674; Sigma-Aldrich]) to measure the maximum OCR. The OCR was normalized to the cell number counted after the assay.
Assessment of Mitophagy
To prove mitophagy, PTCs stably expressing GFP-LC3 were treated with 200 nM of bafilomycin A1 (Wako Pure Chemicals) for 2 hours at 37°C before staining with 25 nM of MitoTracker Red FM (M22425; Invitrogen) for 15 minutes at 37°C. Colocalization of autophagosomes and mitochondria was calculated using ImageJ and represented as Pearson’s correlation between fluorescence of GFP and MitoTracker Red FM.28 We also constructed GFP-LC3 and mStrawberry-ubiquitin double-transfected PTCs to assess the association between ubiquitin and mitophagy. GFP-LC3 and mStrawberry-ubiquitin double-transfected PTCs were treated with 200 nM of bafilomycin A1 for 2 hours at 37°C before being stained with 25 nM of MitoTracker Deep Red FM (M22426; Invitrogen) for 15 minutes at 37°C. Colocalization of autophagosomes, ubiquitin, and mitochondria was calculated using ImageJ and was represented as Pearson’s correlation among GFP, mStrawberry, and MitoTracker Deep Red FM.
Western Blot Analyses
Western blot analysis was conducted as previously described.60 In brief, whole-cell lysates were extracted in lysis buffer (Cell Signaling Technology), and protein concentration was determined using the Pierce BCA Protein Assay Reagent (Thermo Fisher Scientific). An equal amount of protein lysates were loaded in each lane and separated using 12% SDS PAGE. Then, the gels were transferred onto polyvinylidene difluoride membranes. The membranes were incubated with anti-LC3, SQSTM1/p62, and β-actin antibodies at 4°C overnight. After incubation with horseradish peroxidase–conjugated secondary antibodies, detection was performed using SuperSignal West Pico Chemiluminescent Substrate (Thermo Fisher Scientific).
Generation of Transmitochondrial Cybrids
A transmitochondrial cybrid is a hybrid cell generated by the fusion of a mutant mitochondrial DNA–depleted cell (rho0) with enucleated cytoplast (the mitochondria donor) of interest. Cybrid cells were prepared by a slight modification of the method reported previously.29 In brief, we generated the nuclear donor cell, called the rho0 cell, by treatment with 50 ng/ml of ethidium bromide to deplete the mitochondrial DNA in DMEM containing 4.5 g/L of glucose, 5% of FCS, 1 mM of pyruvate, and 50 μg/ml of uridine for 6–8 weeks. The nuclear donor cell was also introduced to the puromycin-resistant gene for a selection marker. The mitochondria donor cell was generated by incubation in regular medium containing 0.5 μg/ml of actinomycin D (00393-41; Nacalai Tesque, Kyoto, Japan) overnight for enucleation. Then, the nuclear donor cell and the mitochondria donor cell were fused by treatment with 45% polyethylene glycol and incubated in regular medium with puromycin for elimination of unfused cells. After 1–2 weeks of culture in the medium with puromycin, the cybrid clones appeared.
Measurement of Plasma Membrane Potential
The plasma membrane potential was determined by staining cells cultured in 35-mm glass-bottom dishes with 1 μM of bis-(1,3-dibutylbarbituric acid)-trimethine oxonol, sodium salt (DiBAC4(3), Dojindo D545; Dojindo Molecular Technologies, Inc., Kumamoto, Japan) for 10 minutes at 37°C. The fluorescence images were collected using the Olympus FV1000-D at 37°C to avoid the change of intensity. The intensity of DiBAC4(3) was measured using ImageJ within five sections for a given cell and corrected fluorescence-positive areas in each section.
Atg5 Knockdown Using RNA Interference
The plasmid encoding Atg5-specific short hairpin RNA (shRNA) was purchased from Origene (TR500113; Rockville, MD). A corresponding plasmid encoding scrambled shRNA (TR30012; Origene) was used as a control. The shRNA-expressing plasmids were stably transfected into M-1 cells using Lipofectamine 2000 (11668-019; Invitrogen) according to the manufacturer’s instruction. Western blot analysis demonstrated that the transfection of the Atg5 shRNA expression vector inhibited Atg5 expression by 77% compared with the scramble shRNA expression vector (Supplemental Figure 6).
Statistical Analyses
All results are given as the mean±SEM. Statistical analyses were conducted using JMP software (SAS Institute, Cary, NC). The difference between two experimental values was assessed by the t test. Multiple-group comparisons were performed using ANOVA with post-testing using the Turkey–Kramer test. P<0.05 was considered statistically significant.
Disclosures
None.
Supplementary Material
Acknowledgments
We thank Noboru Mizushima (University of Tokyo) for donation of the Atg5F/F and GFP-LC3 transgenic mice and pCI-neo-mApg5, Sumio Sugano (University of Tokyo) for pEF321-T, Shoji Yamaoka (Tokyo Medical and Dental University) for MRX-IRES-bsr, Toshio Kitamura (University of Tokyo) for Plat-E cells, Toshimi Michigami (Osaka Medical Center and Research Institute for Maternal and Child Health) for the antibody to megalin, and Naoko Horimoto and Keiko Shibayama for technical and secretarial assistance.
This work was supported by grants-in-aid for scientific research from the Japanese Ministry of Education, Culture, Sports, Science, and Technology (24591196 to Y.T., 24890108 to T.K., and 24659416 to Y.I.).
Footnotes
Published online ahead of print. Publication date available at www.jasn.org.
This article contains supplemental material online at http://jasn.asnjournals.org/lookup/suppl/doi:10.1681/ASN.2013090986/-/DCSupplemental.
References
- 1.Moranne O, Froissart M, Rossert J, Gauci C, Boffa J-J, Haymann JP, M’rad MB, Jacquot C, Houillier P, Stengel B, Fouqueray B, NephroTest Study Group : Timing of onset of CKD-related metabolic complications. J Am Soc Nephrol 20: 164–171, 2009 [DOI] [PMC free article] [PubMed] [Google Scholar]
- 2.de Brito-Ashurst I, Varagunam M, Raftery MJ, Yaqoob MM: Bicarbonate supplementation slows progression of CKD and improves nutritional status. J Am Soc Nephrol 20: 2075–2084, 2009 [DOI] [PMC free article] [PubMed] [Google Scholar]
- 3.Phisitkul S, Khanna A, Simoni J, Broglio K, Sheather S, Rajab MH, Wesson DE: Amelioration of metabolic acidosis in patients with low GFR reduced kidney endothelin production and kidney injury, and better preserved GFR. Kidney Int 77: 617–623, 2010 [DOI] [PubMed] [Google Scholar]
- 4.Mahajan A, Simoni J, Sheather SJ, Broglio KR, Rajab MH, Wesson DE: Daily oral sodium bicarbonate preserves glomerular filtration rate by slowing its decline in early hypertensive nephropathy. Kidney Int 78: 303–309, 2010 [DOI] [PubMed] [Google Scholar]
- 5.Curthoys NP, Taylor L, Hoffert JD, Knepper MA: Proteomic analysis of the adaptive response of rat renal proximal tubules to metabolic acidosis. Am J Physiol Renal Physiol 292: F140–F147, 2007 [DOI] [PubMed] [Google Scholar]
- 6.Nowik M, Lecca MR, Velic A, Rehrauer H, Brändli AW, Wagner CA: Genome-wide gene expression profiling reveals renal genes regulated during metabolic acidosis. Physiol Genomics 32: 322–334, 2008 [DOI] [PubMed] [Google Scholar]
- 7.Bento LM, Fagian MM, Vercesi AE, Gontijo JA: Effects of NH4Cl-induced systemic metabolic acidosis on kidney mitochondrial coupling and calcium transport in rats. Nephrol Dial Transplant 22: 2817–2823, 2007 [DOI] [PubMed] [Google Scholar]
- 8.Mizushima N: Autophagy: Process and function. Genes Dev 21: 2861–2873, 2007 [DOI] [PubMed] [Google Scholar]
- 9.Levine B, Kroemer G: Autophagy in the pathogenesis of disease. Cell 132: 27–42, 2008 [DOI] [PMC free article] [PubMed] [Google Scholar]
- 10.Mizushima N, Levine B, Cuervo AM, Klionsky DJ: Autophagy fights disease through cellular self-digestion. Nature 451: 1069–1075, 2008 [DOI] [PMC free article] [PubMed] [Google Scholar]
- 11.Mizushima N, Yoshimori T, Levine B: Methods in mammalian autophagy research. Cell 140: 313–326, 2010 [DOI] [PMC free article] [PubMed] [Google Scholar]
- 12.Mizushima N, Komatsu M: Autophagy: Renovation of cells and tissues. Cell 147: 728–741, 2011 [DOI] [PubMed] [Google Scholar]
- 13.Suzuki C, Isaka Y, Takabatake Y, Tanaka H, Koike M, Shibata M, Uchiyama Y, Takahara S, Imai E: Participation of autophagy in renal ischemia/reperfusion injury. Biochem Biophys Res Commun 368: 100–106, 2008 [DOI] [PubMed] [Google Scholar]
- 14.Jiang M, Liu K, Luo J, Dong Z: Autophagy is a renoprotective mechanism during in vitro hypoxia and in vivo ischemia-reperfusion injury. Am J Pathol 176: 1181–1192, 2010 [DOI] [PMC free article] [PubMed] [Google Scholar]
- 15.Kimura T, Takabatake Y, Takahashi A, Kaimori JY, Matsui I, Namba T, Kitamura H, Niimura F, Matsusaka T, Soga T, Rakugi H, Isaka Y: Autophagy protects the proximal tubule from degeneration and acute ischemic injury. J Am Soc Nephrol 22: 902–913, 2011 [DOI] [PMC free article] [PubMed] [Google Scholar]
- 16.Liu S, Hartleben B, Kretz O, Wiech T, Igarashi P, Mizushima N, Walz G, Huber TB: Autophagy plays a critical role in kidney tubule maintenance, aging and ischemia-reperfusion injury. Autophagy 8: 826–837, 2012 [DOI] [PubMed] [Google Scholar]
- 17.Periyasamy-Thandavan S, Jiang M, Wei Q, Smith R, Yin XM, Dong Z: Autophagy is cytoprotective during cisplatin injury of renal proximal tubular cells. Kidney Int 74: 631–640, 2008 [DOI] [PubMed] [Google Scholar]
- 18.Inoue K, Kuwana H, Shimamura Y, Ogata K, Taniguchi Y, Kagawa T, Horino T, Takao T, Morita T, Sasaki S, Mizushima N, Terada Y: Cisplatin-induced macroautophagy occurs prior to apoptosis in proximal tubules in vivo. Clin Exp Nephrol 14: 112–122, 2010 [DOI] [PubMed] [Google Scholar]
- 19.Takahashi A, Kimura T, Takabatake Y, Namba T, Kaimori J, Kitamura H, Matsui I, Niimura F, Matsusaka T, Fujita N, Yoshimori T, Isaka Y, Rakugi H: Autophagy guards against cisplatin-induced acute kidney injury. Am J Pathol 180: 517–525, 2012 [DOI] [PubMed] [Google Scholar]
- 20.Jiang M, Wei Q, Dong G, Komatsu M, Su Y, Dong Z: Autophagy in proximal tubules protects against acute kidney injury. Kidney Int 82: 1271–1283, 2012 [DOI] [PMC free article] [PubMed] [Google Scholar]
- 21.Pallet N, Bouvier N, Legendre C, Gilleron J, Codogno P, Beaune P, Thervet E, Anglicheau D: Autophagy protects renal tubular cells against cyclosporine toxicity. Autophagy 4: 783–791, 2008 [DOI] [PubMed] [Google Scholar]
- 22.Kimura T, Takahashi A, Takabatake Y, Namba T, Yamamoto T, Kaimori JY, Matsui I, Kitamura H, Niimura F, Matsusaka T, Soga T, Rakugi H, Isaka Y: Autophagy protects kidney proximal tubule epithelial cells from mitochondrial metabolic stress. Autophagy 9: 1876–1886, 2013 [DOI] [PubMed] [Google Scholar]
- 23.Lemasters JJ: Selective mitochondrial autophagy, or mitophagy, as a targeted defense against oxidative stress, mitochondrial dysfunction, and aging. Rejuvenation Res 8: 3–5, 2005 [DOI] [PubMed] [Google Scholar]
- 24.Youle RJ, Narendra DP: Mechanisms of mitophagy. Nat Rev Mol Cell Biol 12: 9–14, 2011 [DOI] [PMC free article] [PubMed] [Google Scholar]
- 25.Mizushima N, Yamamoto A, Matsui M, Yoshimori T, Ohsumi Y: In vivo analysis of autophagy in response to nutrient starvation using transgenic mice expressing a fluorescent autophagosome marker. Mol Biol Cell 15: 1101–1111, 2004 [DOI] [PMC free article] [PubMed] [Google Scholar]
- 26.Klionsky DJ, Abdalla FC, Abeliovich H, Abraham RT, Acevedo-Arozena A, Adeli K, Agholme L, Agnello M, Agostinis P, Aguirre-Ghiso JA, et al. : Guidelines for the use and interpretation of assays for monitoring autophagy. Autophagy 8: 445–544, 2012 [DOI] [PMC free article] [PubMed] [Google Scholar]
- 27.Sciacco M, Bonilla E: Cytochemistry and immunocytochemistry of mitochondria in tissue sections. Methods Enzymol 264: 509–521, 1996 [DOI] [PubMed] [Google Scholar]
- 28.Ruggiero C, Ehrenshaft M, Cleland E, Stadler K: High-fat diet induces an initial adaptation of mitochondrial bioenergetics in the kidney despite evident oxidative stress and mitochondrial ROS production. Am J Physiol Endocrinol Metab 300: E1047–E1058, 2011 [DOI] [PMC free article] [PubMed] [Google Scholar]
- 29.Vithayathil SA, Ma Y, Kaipparettu BA: Transmitochondrial cybrids: Tools for functional studies of mutant mitochondria. Methods Mol Biol 837: 219–230, 2012 [DOI] [PubMed] [Google Scholar]
- 30.Nath KA, Hostetter MK, Hostetter TH: Pathophysiology of chronic tubulo-interstitial disease in rats. Interactions of dietary acid load, ammonia, and complement component C3. J Clin Invest 76: 667–675, 1985 [DOI] [PMC free article] [PubMed] [Google Scholar]
- 31.Phisitkul S, Hacker C, Simoni J, Tran RM, Wesson DE: Dietary protein causes a decline in the glomerular filtration rate of the remnant kidney mediated by metabolic acidosis and endothelin receptors. Kidney Int 73: 192–199, 2008 [DOI] [PubMed] [Google Scholar]
- 32.Wesson DE, Jo C-H, Simoni J: Angiotensin II receptors mediate increased distal nephron acidification caused by acid retention. Kidney Int 82: 1184–1194, 2012 [DOI] [PubMed] [Google Scholar]
- 33.Wesson DE, Simoni J: Acid retention during kidney failure induces endothelin and aldosterone production which lead to progressive GFR decline, a situation ameliorated by alkali diet. Kidney Int 78: 1128–1135, 2010 [DOI] [PubMed] [Google Scholar]
- 34.Abramowitz MK, Melamed ML, Bauer C, Raff AC, Hostetter TH: Effects of oral sodium bicarbonate in patients with CKD. Clin J Am Soc Nephrol 8: 714–720, 2013 [DOI] [PMC free article] [PubMed] [Google Scholar]
- 35.Mehrotra R, Kopple JD, Wolfson M: Metabolic acidosis in maintenance dialysis patients: Clinical considerations. Kidney Int Suppl 88: S13–S25, 2003 [DOI] [PubMed] [Google Scholar]
- 36.Shah SN, Abramowitz M, Hostetter TH, Melamed ML: Serum bicarbonate levels and the progression of kidney disease: A cohort study. Am J Kidney Dis 54: 270–277, 2009 [DOI] [PMC free article] [PubMed] [Google Scholar]
- 37.Rabinowitz JD, White E: Autophagy and metabolism. Science 330: 1344–1348, 2010 [DOI] [PMC free article] [PubMed] [Google Scholar]
- 38.Wojtkowiak JW, Rothberg JM, Kumar V, Schramm KJ, Haller E, Proemsey JB, Lloyd MC, Sloane BF, Gillies RJ: Chronic autophagy is a cellular adaptation to tumor acidic pH microenvironments. Cancer Res 72: 3938–3947, 2012 [DOI] [PMC free article] [PubMed] [Google Scholar]
- 39.Vander Heiden MG, Cantley LC, Thompson CB: Understanding the Warburg effect: The metabolic requirements of cell proliferation. Science 324: 1029–1033, 2009 [DOI] [PMC free article] [PubMed] [Google Scholar]
- 40.Kissová I, Deffieu M, Manon S, Camougrand N: Uth1p is involved in the autophagic degradation of mitochondria. J Biol Chem 279: 39068–39074, 2004 [DOI] [PubMed] [Google Scholar]
- 41.Okamoto K, Kondo-Okamoto N, Ohsumi Y: Mitochondria-anchored receptor Atg32 mediates degradation of mitochondria via selective autophagy. Dev Cell 17: 87–97, 2009 [DOI] [PubMed] [Google Scholar]
- 42.Sandoval H, Thiagarajan P, Dasgupta SK, Schumacher A, Prchal JT, Chen M, Wang J: Essential role for Nix in autophagic maturation of erythroid cells. Nature 454: 232–235, 2008 [DOI] [PMC free article] [PubMed] [Google Scholar]
- 43.Novak I, Kirkin V, McEwan DG, Zhang J, Wild P, Rozenknop A, Rogov V, Löhr F, Popovic D, Occhipinti A, Reichert AS, Terzic J, Dötsch V, Ney PA, Dikic I: Nix is a selective autophagy receptor for mitochondrial clearance. EMBO Rep 11: 45–51, 2010 [DOI] [PMC free article] [PubMed] [Google Scholar]
- 44.Narendra D, Tanaka A, Suen DF, Youle RJ: Parkin is recruited selectively to impaired mitochondria and promotes their autophagy. J Cell Biol 183: 795–803, 2008 [DOI] [PMC free article] [PubMed] [Google Scholar]
- 45.Sansanwal P, Sarwal MM: Abnormal mitochondrial autophagy in nephropathic cystinosis. Autophagy 6: 971–973, 2010 [DOI] [PMC free article] [PubMed] [Google Scholar]
- 46.Sun X, Yang LV, Tiegs BC, Arend LJ, McGraw DW, Penn RB, Petrovic S: Deletion of the pH sensor GPR4 decreases renal acid excretion. J Am Soc Nephrol 21: 1745–1755, 2010 [DOI] [PMC free article] [PubMed] [Google Scholar]
- 47.Yang LV, Radu CG, Roy M, Lee S, McLaughlin J, Teitell MA, Iruela-Arispe ML, Witte ON: Vascular abnormalities in mice deficient for the G protein-coupled receptor GPR4 that functions as a pH sensor. Mol Cell Biol 27: 1334–1347, 2007 [DOI] [PMC free article] [PubMed] [Google Scholar]
- 48.Deyev IE, Sohet F, Vassilenko KP, Serova OV, Popova NV, Zozulya SA, Burova EB, Houillier P, Rzhevsky DI, Berchatova AA, Murashev AN, Chugunov AO, Efremov RG, Nikol’sky NN, Bertelli E, Eladari D, Petrenko AG: Insulin receptor-related receptor as an extracellular alkali sensor. Cell Metab 13: 679–689, 2011 [DOI] [PMC free article] [PubMed] [Google Scholar]
- 49.Li S, Sato S, Yang X, Preisig PA, Alpern RJ: Pyk2 activation is integral to acid stimulation of sodium/hydrogen exchanger 3. J Clin Invest 114: 1782–1789, 2004 [DOI] [PMC free article] [PubMed] [Google Scholar]
- 50.Preisig PA: The acid-activated signaling pathway: Starting with Pyk2 and ending with increased NHE3 activity. Kidney Int 72: 1324–1329, 2007 [DOI] [PubMed] [Google Scholar]
- 51.Zhou Y, Bouyer P, Boron WF: Role of a tyrosine kinase in the CO2-induced stimulation of HCO3- reabsorption by rabbit S2 proximal tubules. Am J Physiol Renal Physiol 291: F358–F367, 2006 [DOI] [PubMed] [Google Scholar]
- 52.Detmer SA, Chan DC: Functions and dysfunctions of mitochondrial dynamics. Nat Rev Mol Cell Biol 8: 870–879, 2007 [DOI] [PubMed] [Google Scholar]
- 53.Twig G, Shirihai OS: The interplay between mitochondrial dynamics and mitophagy. Antioxid Redox Signal 14: 1939–1951, 2011 [DOI] [PMC free article] [PubMed] [Google Scholar]
- 54.Cereghetti GM, Stangherlin A, Martins de Brito O, Chang CR, Blackstone C, Bernardi P, Scorrano L: Dephosphorylation by calcineurin regulates translocation of Drp1 to mitochondria. Proc Natl Acad Sci U S A 105: 15803–15808, 2008 [DOI] [PMC free article] [PubMed] [Google Scholar]
- 55.Kim I, Rodriguez-Enriquez S, Lemasters JJ: Selective degradation of mitochondria by mitophagy. Arch Biochem Biophys 462: 245–253, 2007 [DOI] [PMC free article] [PubMed] [Google Scholar]
- 56.Donati A, Cavallini G, Paradiso C, Vittorini S, Pollera M, Gori Z, Bergamini E: Age-related changes in the autophagic proteolysis of rat isolated liver cells: Effects of antiaging dietary restrictions. J Gerontol A Biol Sci Med Sci 56: B375–B383, 2001 [DOI] [PubMed] [Google Scholar]
- 57.Agarwal BN, Cabebe FG: Renal acidification in elderly subjects. Nephron 26: 291–295, 1980 [DOI] [PubMed] [Google Scholar]
- 58.Han K, Lehringer-Polzin M, Zhou H, Pfeifer U: Cellular autophagy in proximal tubules of early diabetic rats following insulin treatment and islet transplantation. Virchows Arch B Cell Pathol Incl Mol Pathol 61: 367–373, 1992 [DOI] [PubMed] [Google Scholar]
- 59.Martin TP, Vailas AC, Durivage JB, Edgerton VR, Castleman KR: Quantitative histochemical determination of muscle enzymes: Biochemical verification. J Histochem Cytochem 33: 1053–1059, 1985 [DOI] [PubMed] [Google Scholar]
- 60.Matsui I, Hamano T, Mikami S, Fujii N, Takabatake Y, Nagasawa Y, Kawada N, Ito T, Rakugi H, Imai E, Isaka Y: Fully phosphorylated fetuin-A forms a mineral complex in the serum of rats with adenine-induced renal failure. Kidney Int 75: 915–928, 2009 [DOI] [PubMed] [Google Scholar]
Associated Data
This section collects any data citations, data availability statements, or supplementary materials included in this article.