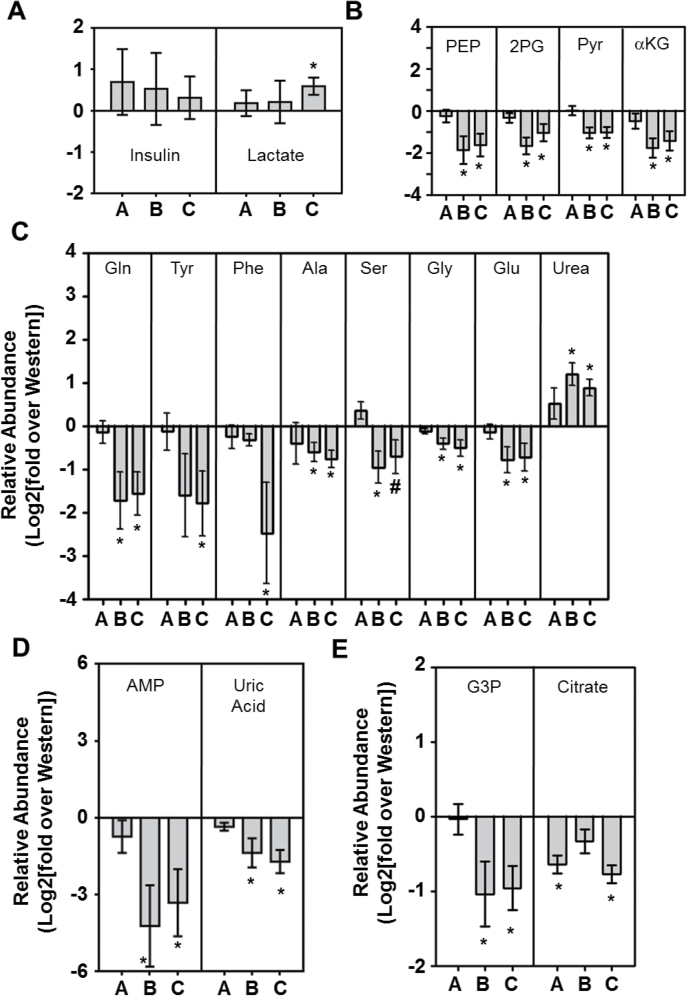
Fig. 5.
Primary 4T1 tumor metabolite analysis. (A) Relative levels of insulin and lactate in the plasma of 4T1-tumor bearing BALB/c mice fed a Western diet + 0.1% (wt/wt) celecoxib (A), a 15% CHO diet (B) or a 15% CHO + 0.1% (wt/wt) celecoxib diet (C), expressed as a ratio over levels detected in the plasma of Western diet-fed 4T1 tumor-bearing mice [Log 2 of (mean of experimental group/mean of Western diet group) ± SD of 6 individual mice/group]. (B) Relative abundance of glycolysis and TCA cycle intermediates within the tumors. (C) Relative abundance of amino acids within the tumors. (D) Nucleic acid synthesis intermediates within the tumors and (E) lipid synthesis intermediates within the tumors, as assessed by GC-MS. Levels are expressed as a ratio over levels detected in tumors in Western diet-fed mice. All GC-MS data are expressed as Log 2 of (mean of experimental group/mean of Western diet group) ± SEM of triplicate determinations from six independent mice.*P ≤ 0.05 in a t-test against the Western diet group; # P ≤ 0.06 in a t-test against the Western diet group. GC-MS, gas chromatography–mass spectrometry.

