

Abstract
We examined the seasonal changes of the cecal microbiota of captive arctic ground squirrels (Urocitellus parryii) by measuring microbial diversity and composition, total bacterial density and viability, and short-chain fatty acid concentrations at four sample periods (summer, torpor, interbout arousal, and posthibernation). Abundance of Firmicutes was lower, whereas abundances of Bacteroidetes, Verrucomicrobia, and Proteobacteria were higher during torpor and interbout arousal than in summer. Bacterial densities and percentages of live bacteria were significantly higher in summer than during torpor and interbout arousal. Likewise, total short-chain fatty acid concentrations were significantly greater during summer than during torpor and interbout arousal. Concentrations of individual short-chain fatty acids varied across sample periods, with butyrate concentrations higher and acetate concentrations lower during summer than at all other sample periods. Characteristics of the gut community posthibernation were more similar to those during torpor and interbout arousal than to those during summer. However, higher abundances of the genera Bacteroides and Akkermansia occurred during posthibernation than during interbout arousal and torpor. Collectively, our results clearly demonstrate that seasonal changes in physiology associated with hibernation and activity affect the gut microbial community in the arctic ground squirrel. Importantly, similarities between the gut microbiota of arctic ground squirrels and thirteen-lined ground squirrels suggest the potential for a core microbiota during hibernation.
INTRODUCTION
Although gut microbes share a mutualistic relationship with their mammalian hosts in which they benefit from access to fermentable substrates and a suitable living environment (1), the gut microbiota may be exposed to periods of little or no available dietary polysaccharides when the host is fasting. Extended periods of host fasting likely select for microbes that are able to degrade and subsist on host-derived substrates such as mucins and other glycoproteins (2–4). Indeed, several studies have revealed a profound effect of fasting on the gut microbiota. For example, fasting Burmese pythons (Python molurus) have higher relative abundances of Bacteroidetes, a phylum with species able to utilize host-derived substrates (1), whereas greater relative abundances of Firmicutes, which rely upon diet-derived substrates (5), were observed after the ingestion of a meal (6). Similarly, fasted Syrian hamsters (Mesocricetus auratus) exhibit decreased bacterial densities, relative abundance of Firmicutes, and microbial metabolic activity compared to those of fed hamsters (7).
Many obligate seasonal hibernators (e.g., ground squirrels) naturally exhibit an endogenous circannual rhythm of hibernation and activity (reviewed in reference 8). During hibernation, animals voluntarily fast, and they conserve endogenous energy reserves by entering a state of torpor characterized by days to weeks of profoundly reduced metabolic rate, body temperature (Tb), and activity (9). Torpor is not continuous; rather, it is interspersed with brief (<24 h) spontaneous interbout arousals (IBAs) where Tb and metabolic rate are restored to levels typical of a euthermic animal (reviewed in reference 10). In response to fasting, hibernators reduce the mass, complexity, and function of the gastrointestinal tract (GIT) as an energy-saving measure (11, 12). The physiological and morphological changes of the GIT during hibernation in combination with prolonged fasting make obligate hibernators an intriguing model to investigate interrelationships between host physiology and the gut microbial community.
Early culture-dependent examinations of the gut microbiota of hibernating mammals showed decreased microbial densities and changes in diversity compared to those of nonhibernating animals (13, 14). In a study that utilized culture-independent techniques, Sonoyama et al. (7) found little effect of torpor on the gut microbiota of Syrian hamsters. However, the Syrian hamster is a facultative hibernator that exhibits relatively short torpor bouts (3 to 4 days) and eats during IBAs, both of which may diminish effects of hibernation on the gut microbiota. Carey et al. (4) were the first to survey the gut microbiota of an obligate seasonal hibernator, the thirteen-lined ground squirrel (TLS; Ictidomys tridecemlineatus), using next-generation DNA sequencing techniques. Their results clearly indicate significant seasonal changes in gut microbial diversity and composition. Similar studies with other obligate seasonal hibernators are needed to confirm if these findings are unique to TLSs or are shared phenomena across hibernating species.
The arctic ground squirrel (AGS; Urocitellus parryii) is an ideal species to study hibernator-gut microbe interactions, as it has evolved the most extreme hibernation phenotype of any mammal. The hibernation season of AGSs can last up to 9 months (15, 16), during which no food or water is consumed. Torpor bout durations average >25 days and are interspersed with ∼12-h IBAs (17, 18). The core Tb of AGS during torpor can attain −2.9°C, the lowest Tb of any mammal (19) (see Fig. S1 in the supplemental material).
Hibernation (heterothermy) is an ancestral and conserved polyphyletic character trait occurring in at least 11 orders of mammals (reviewed in reference 20). Homeothermy, on the other hand, is currently interpreted as a derived trait, i.e., a loss of the ability to enter torpor among species capable of surviving periods of high energy demand and low energy resources in the absence of required heterothermic periods. Given this, one would expect a convergence of microbial communities in mammals that exhibit hibernation. However, deviations from a common hibernation microbiota would suggest the importance of the vagaries of the fairly conserved physiology of hibernation as having a selective force on the microbial community.
Comparison of hibernation microbiotas in the TLS and AGS provides an opportunity to assess whether hibernation selects for a common gut microbiota or if the physiological extremes inherent in the AGS (e.g., Tb of <0°C during torpor) exert additional selective pressures that affect gut microbial community structure or function. Convergence in microbiota structure and function between the TLS and AGS would support the concept of a core microbial community among the Sciuridae and perhaps across all obligate hibernators. Alternatively, the more extreme hibernation phenotype of the AGS may serve as a further selective agent in shaping the microbiota such that there is no evidence of convergence, and by extension, of a core hibernation microbiota. In this contribution, we set out to describe the structure and function of the gut microbial community of the AGS during hibernation and compare it to that of TLS in order uncover the potential for a core hibernation microbiota.
MATERIALS AND METHODS
Animal information.
We trapped free-living arctic ground squirrels (Urocitellus parryii) in the northern foothills of the Brooks Range, AK (68° 8′N, 149° 38′W) and transported them to the University of Alaska Anchorage (UAA). Euthermic squirrels were housed in individual metal cages (46 by 30 by 30 cm) at 25°C with a 10:14 h light-dark cycle and provided with rodent chow (Mazuri number 5663; Brentwood, MO) and water ad libitum. Squirrels fed for ca. 3 months prior to terminal sample collection (summer squirrels; see below) or immergence into hibernation (all other squirrels). We surgically implanted a subset of squirrels with temperature-sensitive transmitters (model TAF40; Data Sciences International, New Brighton, MN) to continuously monitor Tb (for surgical details, see reference 21). Prior to hibernation, we transferred squirrels to an environmental chamber held at 0.0°C ± 1.0°C with no light and a reduced food ration. Upon entering torpor, squirrels were housed in plastic tubs (Nalgene, Rochester, NY; 38 by 56 by 20 cm) and maintained at −5.0°C ± 1.0°C without light, food, or water for the duration of the study. All procedures within this study were approved by the UAA Institutional Animal Care and Use Committee (protocol numbers 156096, 156099, and 156098).
Sample collection.
We sampled squirrels at four time periods across their annual cycle: (i) summer (n = 12; euthermic Tb; 1 to 2 months prior to onset of hibernation; see Fig. S1A in the supplemental material), (ii) torpor (n = 11; mean of 15 days into torpor after 100 days of hibernation; see Fig. S1B), (iii) IBA (n = 11; mean of 9.5 h into IBA after 100 days of hibernation; see Fig. S1C), and (iv) 3 days after ending hibernation (posthibernation; n = 10; 3 days after last torpor bout, no food provided; see Fig. S1D). Durations of IBA and torpor are consistent within individuals in midhibernation (17); thus, we were able to time sample collection for torpor by averaging midseason torpor bout lengths and for IBA by averaging duration of a squirrel's previous IBAs. A squirrel was considered aroused when the Tb was ≥30°C.
Ceca were excised from euthanized squirrels and immediately placed onto ice while processed. Ceca were weighed (nearest 0.01 g) before and after removal of contents. Contents (1 to 2 g) were subsampled for pyrosequencing and short-chain fatty acid (SCFA) analyses and stored at −80°C (≤6 months). Samples for flow cytometry were immediately transferred to an anaerobic chamber (Plas Labs; Lansing, MI; 80% N2, 10% CO2, and 5 to 10% H2) and processed for microbial enumeration and viability.
Flow cytometery.
We determined bacterial density and viability using flow cytometry as described by Ben-Amor et al. (22) and modified by Sonoyama et al. (7). Cecal contents (0.01 g) were suspended in anaerobic phosphate-buffered saline (PBS) containing 1 mM dithiothreitol, 5 mM EDTA, and 0.01%, (wt/vol) Tween 20 for 15 min and vortexed for 3 min. After centrifugation (700 × g for 1 min), we decanted the supernatant and centrifuged it at 6,000 × g for 3 min. The resulting pellet was washed twice with anaerobic PBS, resuspended, and serially diluted. Samples for bacterial viability were incubated with 5 mM SYTO BC and 14.5 μmol/ml of propidium iodide (PI) for 15 min at room temperature in the dark. Controls for bacterial viability included unstained sample, live-stained sample (SYTO BC only) and heat-killed sample with dead stain (PI only). To determine microbial density, we incubated samples (10 μl) with 1,000× SYTO BC for 10 min at room temperature in the dark. Beads (6 μm; 1 × 10⁶ beads/ml) were added to the tubes and bacterial densities determined as the ratio of cells to beads. Controls contained beads and unstained cells.
Samples were vortexed just prior to analysis on a FACScalibur flow cytometer (Becton, Dickinson [BD], San Jose, CA) that was calibrated daily with Calibrite3 beads (BD). Data were analyzed using the CellQuest (BD) software. We measured all parameters using logarithmic amplification, and forward scatter (FSC) was set at E01. Background noise was eliminated using a double threshold (FSC and side scatter [SSC]). Samples were run on a low-flow-rate setting with a goal of 200 to 600 events/s.
16S rRNA gene 454 Roche pyrosequencing.
DNA was extracted from cecal contents (0.25 g) using MoBio PowerSoil (MoBIO, Carlsbad, CA) kits according to manufacturer protocols, with the following modifications: (i) the powerbead tube was incubated at 60°C for 12 min prior to the 15 min vortex and (ii) an additional 100% ethanol wash was performed prior to the 70% ethanol wash. We determined DNA concentrations and purity using a Nanodrop ND-1000 spectrophotometer (Thermo Scientific, Wilmington, DE).
The V4-V5 region of the bacterial 16S rRNA gene was amplified using universal eubacterial primers (530F and 1100R; Molecular Research, Shallowater, TX). A single-step 30-cycle PCR using the HotStarTaq Plus master mix kit (Qiagen, Valencia, CA) was performed under the following conditions: 94°C for 3 min, followed by 28 cycles of 94°C for 30 s, 53°C for 40 s, and 72°C for 1 min and a final elongation step at 72°C for 5 min. Following PCR, all amplicons from individual samples were bar coded (5′ end), mixed in equal concentrations, and purified using Agencourt Ampure beads (Agencourt Bioscience Corporation, MA). Samples were sequenced utilizing Roche 454 FLX titanium instruments and reagents according to the manufacturer's guidelines (Molecular Research).
We processed pyrosequencing data using QIIME 1.6.0 (23). Sequences were demultiplexed, and primers, short sequences (<200 bp), sequences with more than six ambiguous base calls, and sequences with homopolymeric runs exceeding 6 bp were removed. Sequences were preclustered and denoised using Denoiser (24) and assessed for reverse primers (removed if detected). We clustered sequences into operational taxonomic units (OTUs) at 97% similarity and removed chimeras (both de novo and reference-based checks) using USEARCH 5.2.32 (25). Taxonomy was assigned to the representative OTUs using the Ribosomal Database Project Classifier 2.2 retrained on the Greengenes reference sequence data set (October 2012 release) (26, 27). We removed singleton sequences from the OTU table, aligned representative OTUs using PyNAST (28), and filtered them using the Greengenes lanemask. Finally, we used the filtered and aligned OTUs to construct a phylogenetic tree with FastTree 2.1.3 (29).
Short-chain fatty acid analysis.
We centrifuged cecal contents (1.0 g) at 10,000 × g for 10 min and kept the supernatant. We repeated the centrifugation and combined supernatants until no supernatant formed. The combined supernatant was acidified (36 N H2SO4; 0.2× supernatant volume), vortexed, centrifuged at 15,000 × g for 10 min, and assayed via gas chromatography at the U.S. Department of Agriculture Dairy Forage Research Center (Madison, WI). Samples were passed through a glass precolumn (30 mg of glass wool) and analyzed using a Shimadzu GC17A (Kyoto, Japan) equipped with a flame ionization detector (250°C) connected to a Phenomenex (Torrance, CA) Zebron ZB-FFAP column (30 by 0.53 mm [inside diameter] by 1.0 μm; 100°C for 1 min, ramped [10°C/min] to 130°C for 3 min and then 135°C for 1 min) with splitless injection (230°C). We created individual standard curves for each analyte (acetate, propionate, butyrate, valerate, iso-butyrate, and iso-valerate) using a multipoint calibration (0, 15, 25, and 45 mM) with 2-ethylbutyrate as the internal standard.
Statistical analyses.
We calculated alpha diversity by rarefying the OTU table from 1 to 5,000 sequences/sample at increasing steps of 500 sequences/sample for a total of 10 points per curve; rarefied OTU tables underwent 50 repetitions. The quantity 5,000 sequences/sample was chosen to ensure that all curves were continuous. Alpha diversity was calculated using three separate metrics: Observed Species, Phylogenetic Diversity-Whole Tree (PD whole), and the Chao1. For the Chao1 rarefaction curves, we constructed a unique OTU table including singleton sequences. Significant differences were determined among sample periods for all three metrics using nonparametric t tests with Monte Carlo permutations (n = 999) on the rarified OTU tables.
We determined bacterial beta diversity by standardizing OTU tables to the minimum sequences/sample (5,858) to decrease the weight of more abundant OTUs. Two-dimensional principal coordinates analysis (PCoA) plots were generated from individual distance matrices produced from both unweighted and weighted UniFrac (30) and Bray Curtis distance metrics. We determined significant differences among sample periods using a pairwise one-way permutational multivariate analysis of variance using PRIMER 6 software (31). Dispersion was determined using a pairwise permutational analysis of multivariate dispersion (PRIMER 6).
Bacterial taxonomies were summarized at the phylum, class, order, family, and genus levels from the same standardized OTU table used in the beta diversity analysis. Taxonomies at each level were grouped by sample period and compared using a Kruskal-Wallis Rank-Sum test in R (version 2.13.1). Additionally, we determined significant differences in mean squirrel Tb at sampling, cecal content, total days of hibernation, total torpor bouts, torpor bout duration, IBA duration, cecal bacterial density and viability, and cecal SCFA concentration and molar proportion among sample periods using one-way analysis of variance followed by Tukey's honest significant difference (HSD) test. Differences were considered significant at a P of <0.05 for all analyses.
Pairwise comparisons of the number of shared OTUs between sample periods were determined using the shared_phylotypes.py function in QIIME. Shared OTUs were defined as those occurring in 100% of microbiotas being compared. We calculated the percentage of shared OTUs between sample periods using the following equation: [(number of shared OTUs between sample periods “A” and “B”)/number of unshared OTUs in sample period “A”) + (number of unshared OTUs in sample period “B”) + (number of shared OTUs between sample periods “A” and “B”)] × 100.
Significant differences in percent shared OTUs were determined by one-way analysis of variance followed by Tukey's HSD test. To determine core microbiota membership, we used the compute_core_microbiome.py in QIIME at 100% on filtered OTU tables.
Nucleotide sequence accession number.
All 16S rRNA gene sequences have been submitted to the DDBJ/EMBL/GenBank databases under accession number SRP033606.
RESULTS
Hibernation characteristics.
Squirrel Tb during sampling averaged −0.49 ± 0.18°C when torpid and 36.0 ± 0.79°C when in IBA. Body temperature during IBA did not significantly differ from that of posthibernation (Table 1). Torpor bout length prior to sampling did not differ significantly between IBA and torpid squirrels (Table 1). On average, squirrels sampled during IBA were euthermic for 9.5 ± 1.5 h at sampling. The durations that animals were hibernating before being sampled during either IBA or torpor did not significantly differ, whereas squirrels sampled at posthibernation averaged 79 more days of hibernation and ca. four more torpor bouts than both IBA and torpid squirrels (Table 1).
TABLE 1.
Squirrel physiological characteristics per sample perioda
| Parameter | Value during period |
|||
|---|---|---|---|---|
| Summer active (n = 13) | Late torpor (n = 11) | Late IBA (n = 11) | Posthibernation (n = 11) | |
| Cecal contents (g) | 13.49 ± 0.69 A | 4.26 ± 0.69 B | 2.08 ± 0.36 B | 2.53 ± 0.37 B |
| Tb (°C) | NA | −0.49 ± 0.18 A | 36.29 ± 0.79 B | 36.0 ± 0.56 B |
| Total hibernation (days) | NA | 111.0 ± 3.0 A | 115.0 ± 4.0 A | 194.0 ± 9.0 B |
| Torpor bout length (days) | NA | 15.0 ± 1.0 | 14.0 ± 1.0 | NA |
| Total no. of torpor bouts | NA | 8.0 ± 0.0 | 8.0 ± 0.0 | NA |
| IBA length (h) | NA | NA | 9.5 ± 1.5 | NA |
Values are the means ± the standard errors. Different capital letters indicate significant differences among sample periods. NA, not applicable.
The mean mass of cecal contents was significantly greater in summer than during hibernation and posthibernation (P < 0.0001) (Table 1). Additionally, the cecal contents collected from summer squirrels were thick and pasty, whereas, during torpor, cecal contents were liquid with small particles. Cecal contents collected during IBA and posthibernation were more viscous than those collected during torpor.
Microbial diversity.
A total of 771,046 16S rRNA gene reads were sequenced from 46 squirrel ceca. After quality processing, 602,577 sequences remained with an average of 13,695/sample. Additionally, 2552 OTUs were identified from the processed sequences reads, and rarefaction curve analysis indicated that pyrosequencing captured the majority of microbial diversity in our samples (see Table S1 and Fig. S2 in the supplemental material).
Alpha diversity of gut microbiotas differed among sample periods (Fig. 1; see also Fig. S2 in the supplemental material). During summer, alpha diversity (for all three distance metrics) was significantly higher than at all other sample periods (P = 0.006 to 0.04). There were no significant differences in alpha diversity between gut microbiotas during IBA and torpor; however, posthibernation gut microbiotas were significantly lower in alpha diversity than were torpor and IBA microbiotas (P = 0.0222 and 0.0342, respectively).
FIG 1.
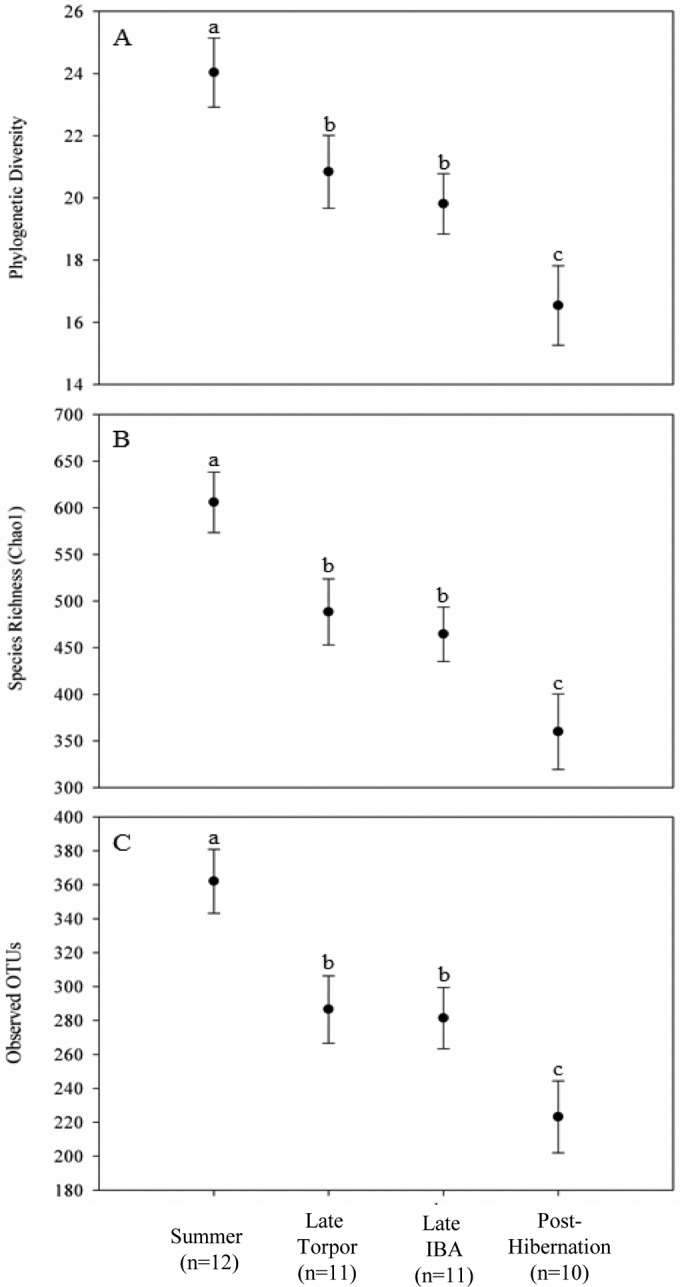
Alpha diversity of cecal microbial communities. Plotted are the last means ± the standard errors of Chao1 (A), observed species (B), and PD whole tree metrics (C) from rarefaction plots (see Fig. S2 in the supplemental material). Significant differences are indicated by different letters.
Beta diversity of AGS gut microbiota differed among sample periods. The three distance metrics used to determine beta diversity showed similar trends, and only unweighted UniFrac analyses are presented here. Gut microbiotas in summer significantly separated along the first principal coordinate axis (PC1; P < 0.0009) compared to gut microflora from the other three sample periods (Fig. 2). The PC2 and PC3 axes from the PCoA revealed no distinct trends or separation among sample periods. There was no significant separation among gut microbiotas in torpor, IBA, and posthibernation. Gut microbial communities in posthibernation had a significantly higher dispersion than did gut microbiotas from all other sample periods (P = 0.002). Dispersion of gut microbiota in summer, torpor, and IBA did not differ significantly. Gut microbial communities in summer squirrels clustered tightly, indicating low dispersion among samples and high similarity in beta diversity (Fig. 2).
FIG 2.
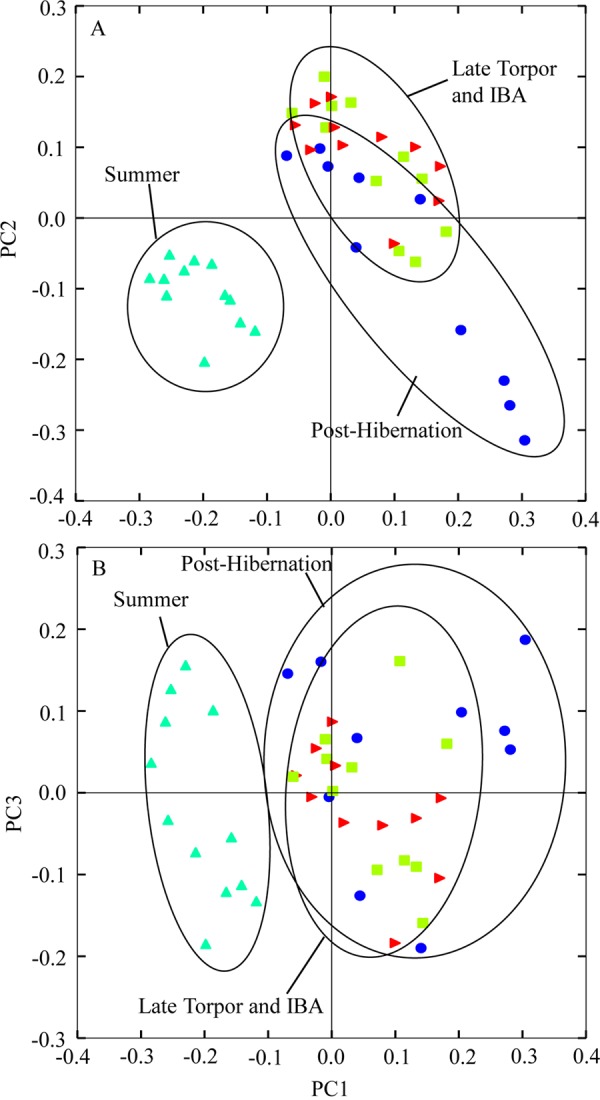
Principal-coordinate analysis plots (PC1 versus PC2 [A] and PC1 versus PC3 [B]), of unweighted UniFrac distance metric of gut microbiotas from 4 sample periods. Each point represents the gut microbial community of an individual arctic ground squirrel at a given sample period.
Bacterial taxonomic composition.
Eleven bacterial phyla were identified in the cecal microbiotas, with the majority of OTUs assigned to the phyla Bacteroidetes and Firmicutes. The microbial compositions were similar among individual squirrels within a sample period (see Fig. S3 in the supplemental material), and significant differences were observed at every taxonomic level across sample periods (Fig. 3; see also Table S2 in the supplemental material). The mean relative abundance of Firmicutes was significantly higher in summer than during torpor, IBA, and posthibernation. In contrast, the mean relative abundance of Bacteroidetes was significantly lower during summer than in torpor and IBA. The phyla Verrucomicrobia and Proteobacteria accounted for the majority of the remaining OTUs. The relative abundance of Proteobacteria was significantly lower in summer than in all other sample periods, whereas the relative abundance of Verrucomicrobia was significantly higher in IBA and posthibernation than in summer and torpor. The Verrucomicrobia relative abundance tended to be elevated in torpor compared to summer. No other bacterial phyla were present at a relative abundance greater than 1% (Fig. 3; see also Table S2 in the supplemental material). Four squirrels contained less than 0.005% relative abundance of the archaeal phylum Euryarchaeota. No other archaeal phyla were detected.
FIG 3.

The relative abundance of dominant taxa per sample period. (A) Phylum; (B) family; (C) genus. Values for each taxa are presented in Table S2 in the supplemental material. * and #, unclassified family and genus, respectively, within a taxonomic group. Taxa with less than 1% relative abundance were not included.
The majority of Bacteroidetes were assigned to the class Bacteroidia and the order Bacteroidales. Dominant families included Bacteroidaceae, S24-7, Rikenellaceae, Prevotellaceae, and an unclassified family in the order Bacteroidales. Dominant genera included Bacteroides, Prevotella, and unclassified genera of both the S24-7 and Rikenellaceae families. During torpor and IBA, the unclassified S24-7 genus was more abundant than any other genus and was significantly higher in relative abundance than in gut microbiotas from summer and posthibernation (Fig. 3; see also Table S2 and Fig. S3 in the supplemental material). The relative abundance of the Rikenellaceae unclassified genus was significantly lower in gut microbiotas of summer and posthibernation than in those of IBA and torpor. Relative abundance of Prevotella was significantly lower in microflora of squirrels during torpor, IBA, and posthibernation than in summer. A significantly higher relative abundance of Bacteroides was observed in microbiotas during posthibernation than during summer (Fig. 3; see also Table S2 and Fig. S3 in the supplemental material).
The majority of Firmicutes matched to the class Clostridia and the order Clostridiales. Dominant families included Lachnospiraceae (over 90%) and Ruminococcaceae. Coprococcus was the only OTU within Lachnospiraceae classified to the genus level. The majority of OTUs from the Ruminococcaceae family were members of the genera Ruminococcus, Roseburia, Blautia, and an unclassified genus. Relative abundances of all genera were significantly reduced in torpor, IBA, and posthibernation compared to those in summer (Fig. 3; see also Table S2 and Fig. S3 in the supplemental material). An unclassified genus of the family Clostridaceae was significantly lower in relative abundance during torpor and IBA than in summer.
All OTUs from Verrucomicrobia were classified as Akkermansia, while the most prominent OTUs from Proteobacteria were classified to the genera Desulfovibrio and Sutterella. The latter were primarily found during hibernation and posthibernation. The Desulfovibrio relative abundance was significantly higher in IBA than at all other time points. The relative abundance of Sutterella was significantly lower in summer than in all other sample periods (Fig. 3; see also Table S2 and Fig. S3 in the supplemental material).
Pairwise comparisons between the various stages of the annual cycle of hibernation and activity (Fig. 4A) indicate that the microbiotas in summer squirrels shared 16.5% (±3.2%), 16.8% (±3.3%), and 14.5% (±4.2%) of their OTUs with those of torpid, IBA, and posthibernation squirrels, respectively. Microbiotas of squirrels in torpor shared 23.2% (±4.2%) and 18.4% (±4.7%) of OTUs with microbiotas from IBA and posthibernation squirrels, respectively, and squirrels sampled during IBA shared 18.9% (±5.3%) of OTUs with microbiotas at posthibernation. The percentage of shared OTUs between torpor and IBA (23.2%) was significantly higher than the percentage of shared OTUs between all other pairs (all P ≤ 0.001), and the percentage of shared OTUs between summer and posthibernation (14.5%) was significantly lower than the percentage of shared OTUs between all other pairs (all P ≤ 0.011). There was no significant difference in the percentage of shared OTUs between IBA and posthibernation and that shared between torpor and posthibernation (P = 0.999). Core microbiota analysis indicated that OTUs from the genera Sutterella (no. 359) and Bacteroides (no. 591), and an unclassified genus of Rikenellaceae (no. 1342) were represented in 100% of the squirrel microbiotas from all sample periods (Fig. 4B). These, along with an unclassified member of the class Clostridia (no. 27), were represented in 100% of the microbiotas from torpor, IBA, and posthibernation sample periods. An OTU from the genus Oscillospira (no. 73) and an additional OTU from the family Rikenellaceae (no. 976) were shared among 100% of squirrels sampled during torpor and IBA and during torpor and posthibernation sample periods, respectively. Finally, summer microbiotas shared three additional OTUs with IBA microbiotas (Oscillospira no. 191 and two OTUs in the S24-7 family [no. 204 and1350]), one additional OTU with posthibernation microbiotas (Lachnospiraceae unclassified genus no. 128), and one additional OTU with torpor microbiotas (Rikenellaceae unclassified genus no. 40).
FIG 4.

Shared OTUs among squirrel microbiotas. (A) Pairwise comparisons of shared OTUs between sample periods. The mean percentage of shared OTUs is indicated in each comparison, and significant differences are indicated by different letters (P < 0.05). (B) Venn diagram of taxa represented in 100% of squirrel microbiotas. ^ and #, unclassified order and genus, respectively, within a taxonomic group. Numbers in parentheses are OTU numbers.
Bacterial cell counts and viability.
Bacterial densities differed significantly among sample periods across hibernation (Table 2). Bacterial densities were ca. 0.6 to 1 order of magnitude lower in torpor and IBA than in summer (P < 0.0001). A similar differential occurred between hibernation and posthibernation; densities at posthibernation were significantly higher than at both torpor (P < 0.0001) and IBA (P = 0.0022). Densities at posthibernation were only slightly lower and not significantly different than those enumerated during summer. Within hibernation, bacterial densities at IBA were significantly higher than at torpor (ca. 0.3 orders of magnitude; P = 0.015).
TABLE 2.
Bacterial densities and viabilities from squirrel cecal content among sample periodsa
| Period | Density (log cells/g) | Viability |
||
|---|---|---|---|---|
| Live cells (%) | Dead cells (%) | Injured cells (%) | ||
| Summer active (n = 12) | 10.29 ± 0.25 A | 79.34 ± 6.46 A | 14.21 ± 5.14 A | 6.89 ± 1.58 |
| Late torpor (n = 10) | 9.34 ± 0.21 B | 69.41 ± 4.95 B | 23.38 ± 7.05 B | 6.12 ± 1.93 |
| Late IBA (n = 10) | 9.67 ± 0.18 C | ND | ND | ND |
| Posthibernation (n =11) | 10.12 ± 0.50 A | 73.71 ± 6.17 B | 21.08 ± 6.31 B | 5.17 ± 2.05 |
Values are the means ± the standard errors. Different capital letters indicate significant differences among sample periods. ND, not determined.
The percentage of live and dead bacteria among sample periods differed, while the percentage of injured bacteria remained unchanged (Table 2). The mean percentage of live bacteria in summer was significantly greater than during torpor and posthibernation (both P < 0.0001), and no significant difference in percentage of live bacteria was found between torpor and posthibernation microbiotas. Percentages of dead bacteria were significantly higher at torpor and posthibernation than in summer (P = 0.0001), and there was no significant difference in the percentage of live or dead bacteria between torpor and posthibernation. Bacterial viability was not determined for IBA samples.
SCFA total concentrations and percent composition.
Mean total cecal SCFA concentrations differed among sample periods (Table 3), with greater concentrations in summer than in torpor, IBA, and posthibernation (P < 0.0001). Concentrations during summer were 10-fold greater than during torpor. During IBA and posthibernation, concentrations were significantly greater than in torpor (P = 0.0062 and 0.0001, respectively) but did not differ between each other.
TABLE 3.
Short-chain fatty acid concentrations and molar proportions among sample periodsa
| Period | Total SCFA concn (mM) | Individual SCFA concn (mM) |
Molar proportion (%) |
||||||||||
|---|---|---|---|---|---|---|---|---|---|---|---|---|---|
| Acetate | Propionate | Butyrate | iso-Butyrate | iso-Valerate | Valerate | Acetate | Propionate | Butyrate | iso-Butyrate | iso-Valerate | Valerate | ||
| Summer (n = 12) | 97.81 ± 13.6 A | 62.38 ± 8.96 A | 12.68 ± 3.46 A | 20.83 ± 7.09 A | 0.55 ± 0.32 A | 0.64 ± 0.44 A | 0.71a ± 0.29 | 63.95 ± 5.55 A | 13.02 ± 2.72 A | 21.02 ± 5.16 A | 1.29 ± 0.38 A | 0.68 ± 0.48 A | 0.75 ± 0.33 A |
| Late torpor (n = 11) | 6.57 ± 2.43 B | 5.99 ± 2.24 B | 0.34 ± 0.13 B | 0.08 ± 0.04 B | 0.06 ± 0.03 B | 0.08 ± 0.03 B | 0.00 ± 0.00 B | 92.42 ± 2.25 B | 5.08 ± 1.28 B | 0.77 ± 0.62 B | 0.87 ± 0.30 A | 0.85 ± 0.30 A | 0.00 ± 0.00 B |
| Late IBA (n = 11) | 29.83 ± 14.7 C | 24.06 ± 12.6 C | 3.62 ± 1.64 C | 1.17 ± 0.58 C | 0.38 ± 0.17 A | 0.37 ± 0.13 A | 0.22 ± 0.01 A | 79.86 ± 2.77 C | 12.09 ± 1.85 A | 4.61 ± 2.43 C | 1.29 ± 0.30 B | 1.35 ± 0.30 B | 0.79 ± 0.26 A |
| Posthibernation (n = 10) | 35.68 ± 16.5 C | 29.87 ± 14.8 C | 4.06 ± 1.70 C | 0.82 ± 0.33 C | 0.41 ± 0.10 A | 0.33 ± 0.06 A | 0.19 ± 0.05 A | 82.69 ± 2.96 C | 11.62 ± 1.83 A | 2.45 ± 0.64 C | 1.38 ± 0.57 B | 1.22 ± 0.74 B | 0.61 ± 0.26 A |
Values are the means ± the standard errors. Different letters indicate significant differences among sample periods.
The mean molar proportion of individual SCFAs differed among sample periods (Table 3). The percentage of acetate was higher than that of any other SCFA at every sample period and was highest in torpor (P < 0.0001). The percentages of acetate in IBA and posthibernation cecal samples did not significantly differ, but they were significantly higher than in summer cecal samples (both P < 0.0001). The butyrate percentage was highest in samples collected in summer (P < 0.0001). Differences in percentage of butyrate between IBA and posthibernation were not significant, but both groups had significantly higher butyrate percentages than during torpor (P < 0.0001). Although the percentage of butyrate was greater than the percentage of propionate in samples collected during summer, the percentage of propionate was greater than that of butyrate at all other sample periods. Samples collected during torpor had significantly lower propionate than all other sample periods (P < 0.0001), and samples collected from summer, IBA, and posthibernation did not differ in propionate molar proportion. Branched-chain fatty acid concentrations (BCFA) were low compared to acetate, propionate, and butyrate concentrations; however, BCFA percentages were significantly higher in IBA and posthibernation compared to in torpor and summer (P = 0.0001 to 0.012) (Table 3). Percentage of valerate was significantly lower in torpor than in any other sample period (P < 0.0001).
DISCUSSION
Hibernation alters the diversity and composition of arctic ground squirrel gut microbiota.
The goal of this study was to characterize the effect of changes in host physiology on the gut microbiotas of captive AGSs at physiologically distinct time points in their annual cycle. We found that diversity, activity, density, and viability of the gut micobiota were contingent upon host physiological state. Hibernation was associated with major changes in diversity and composition of the gut microflora that were not reversed immediately following hibernation. Specifically, alpha diversity was lower, and beta diversity and composition differed in gut microbiotas of torpid, IBA, and posthibernation squirrels from those of summer squirrels. That hibernation is a physiological state that induces a significant alteration of the gut microbiota of AGSs is further supported by similarities between the summer microbiotas of adult AGSs characterized in this study and those of captive juvenile AGSs across their first active season, prior to their first hibernation season (32). We found evidence of a core hibernation microbiota in AGSs, and characteristics of the gut microbiota of AGSs during hibernation are similar to those described for TLSs (4), strongly suggestive of a core hibernation microbiota in obligate seasonal hibernators.
Loss of diet-derived substrates due to fasting during hibernation may select for a gut microflora that utilizes host-derived nutrients, and the microbial community composition in AGSs suggests that this is the case. In our study, animals were not allowed food after entering their first torpor bout, and during hibernation and posthibernation their ceca contained low relative abundances of Firmicutes, a phylum comprising taxa that prefer dietary polysaccharides for growth (33, 34). This result is suggestive of a fasting effect on the gut microbial community that is further supported by the observation that bacteria known to degrade host-derived substrates (e.g., Bacteroides spp. [2, 35] and Akkermansia muciniphila [36]) are in higher relative abundances during hibernation and posthibernation than in summer. Elevated relative abundances of A. muciniphila have also been reported for hibernating TLSs (4) compared to summer animals. Although little is known about the family S24-7, it exhibited the highest relative abundance during hibernation. Interestingly, Serino et al. (37) reported increased relative abundance of S24-7 in mice maintained on diets enriched in gluco-oligosaccharides, an available host-derived nutrient (38). Finally, mucins are high in the sulfur-rich amino acid cysteine, and sulfates are released upon degradation of mucins by microbes (39). We observed a higher relative abundance of Desulfovibrio spp., a sulfate-reducing genus, during hibernation and posthibernation than in summer gut microbiotas. Similar to our findings, Sonoyama et al. (7) reported an increase in Defsulfovibrio and A. muciniphila in fasted compared to fed Syrian hamsters.
Differences in cecal molar proportions of acetate and butyrate during hibernation and posthibernation compared to summer indicate that fasting selects for a microflora reliant on host-derived substrates. The primary metabolic product of mucin degradation, particularly by A. mucinphila, is acetate (36), while Firmicutes are the primary butyrate producers in the gut (33, 40, 41). The lower concentrations of butyrate and higher concentrations of acetate during hibernation and posthibernation than in summer align with the observation that Firmicutes are in lower relative abundance and Akkermansia and Bacteroides spp. are in higher relative abundances during the same sampling periods. Similar to our findings for the AGS, Carey et al. (4) reported a significant correlation between Firmicutes relative abundance and butyrate concentration and molar proportion in the TLS. Total SCFA concentrations were lower during IBA and posthibernation than in summer, reflecting that at euthermic Tb gut microbes are likely substrate limited due to host fasting. Other studies have reported low cecal SCFA concentrations in hibernators upon emergence from hibernation and slow increases through the early active season (4, 42), suggesting that it requires considerable time (weeks) after ending hibernation for SCFA concentrations and molar proportions to rebound to summer levels. Interestingly, although at low concentrations at all sample periods, concentrations of BCFA were significantly higher during IBA and posthibernation than during torpor, indicative of increased mucin and protein catabolism (43) associated with high Tb and a lack of dietary-derived nutrients.
Temperature is known to affect microbial diversity in other ecosystems (44, 45); thus, it is probable that radical fluctuations in host Tb could similarly influence gut microbial diversity in AGSs. However, we failed to detect differences in microbial diversity between IBA and torpor, indicating that a relatively brief (∼12 h) elevation in Tb during an IBA is insufficient to initiate a shift in microbial diversity. These findings are consistent with the microbiotas in TLSs during torpor and IBA (4). We did observe an effect of temperature during posthibernation. After 72 h at euthermic Tb, gut microbiotas contained higher relative abundances of Bacteroides spp. and Akkermansia than during torpor; likely due to the ability of these genera to degrade host-derived nutrients at prolonged high Tb in a fasted host. Our study was not designed to determine the immediate effect of low Tb on gut microbiotas early in hibernation.
While Tb is likely a minor influence on microbial diversity during hibernation, it has a large effect on bacterial density and metabolism. The lowest concentrations of SCFAs and bacterial densities occurred during torpor, when the mean Tb (−0.49°C at sampling) was well below the optimal growth temperature of mesophiles (46). Higher SCFA concentrations and bacterial densities in IBA than in torpor probably reflect increased microbial activity at high Tb. Assuming a Q10 (change in the rate of reaction as a function of temperature) of 2, an increase in host Tb from 0 to 36°C would result in a ca. 4-fold increase in microbial metabolism; more than sufficient to account for higher concentrations of SCFAs at IBA than in torpor. Assuming a range of generation times from 21 min (Escherichia coli [47]) to 2.5 h (Bacteroides spp. [48]) and a squirrel at euthermic Tb (>30°C) for an average of 9.5 h during an IBA, microbial densities would increase by 1 to 6 orders of magnitude, resulting in greater bacterial densities, as observed during IBA compared to torpor. The higher density of microbes at posthibernation than at IBA can be attributed to the longer duration at high Tb. Presumably, the primary energy source during posthibernation is host-derived nutrients, as the squirrels had fasted >194 days when sampled. Bacterial densities at posthibernation tended to be lower than in summer, which is not surprising given that the microflora is likely substrate-limited despite the availability of host-derived nutrients. Combined with the ca. 70% viability of the bacterial population during torpor, these results suggest that the gut microbiota of hibernators is poised to respond to increases in temperature and the resumption of feeding upon reentry into the summer active season.
Potential contributions of short-chain fatty acids to the host during hibernation.
We did not measure the rate of SCFA production by microbes or uptake by host tissues, and in the absence of flux measurements, their contribution to host energy balance is unknown. However, given current knowledge of host utilization of SCFAs by mammals, SCFAs produced by gut microbes during hibernation hold the potential to contribute to squirrel energetics in a number of ways. For example, acetate is absorbed by gut epithelial cells and either transported to the liver for biosynthesis of fatty acids, cholesterol, etc., or used by peripheral gut tissues as an energy source (41, 43). Alternatively, it may be converted to ketone bodies by liver or gut epithelial cells (49). Ketones are used by hibernators as a fuel source in muscle, brain, and heart tissues (50, 51), are protective of reperfusion injury to the heart, and facilitate the transition from low to high O2 consumption during rewarming from torpor to IBA (51). Propionate is utilized in regulation of synthesis of free amino acids and as a gluconeogenic substrate (52). In hibernation, gluconeogenesis occurs only during IBA (53) and microbially derived propionate may serve as a substrate to replenish glucose stores. In other rodents, butyrate is known to contribute 60 to 70% of the energy used by enterocytes (54). Thus, during IBA, butyrate may provide energy for maintenance of host enterocytes. Further experiments are needed to confirm the role of microbially produced SCFAs during hibernation.
The potential for a core microbiota in obligate seasonal hibernators.
Our results suggest the presence of a core hibernation (torpor and IBA) microbiota in AGSs. Summer microbiotas shared fewer OTUs with torpor, IBA, and posthibernation microbiotas than the last three sample periods shared with one another. That all percentages of shared OTUs were low is not surprising given our stringent definition of shared OTU (occurring in 100% of samples being compared). Upon further analysis, we found five OTUs (Sutterella, Oscillospira, Bacteriodes, an unclassified genus of Rikenellaceae, and an unclassified member of the class Clostridia) that were common to all AGS microbiotas sampled during hibernation. Of these five, Rikenellaceae and Bacteroides were in higher relative abundances in hibernation microbiotas compared to summer. Akkermansia and unclassified members of the S24-7 family were also increased in relative abundances in hibernation microbiotas compared to summer and were found in 70% and 90% of hibernation microbiotas, respectively (data not shown). Similar results were obtained when examining microbiotas from torpor, IBA, and posthibernation sample periods combined.
In our study and that of Carey et al. (4), squirrel ceca were sampled during summer activity and after ca. 4 months of hibernation (“late winter” in reference 4), allowing for comparisons of the effects of hibernation on microbiotas of AGSs and TLSs. The microbiotas of both species were dominated by members of the phyla Bacteroidetes and Firmicutes and, to a lesser extent, by Verrucomicrobia and Proteobacteria. Moreover, members of these phyla differed in relative abundances seasonally, with higher relative abundances of Bacteroidetes, Verrucomicrobia, and Proteobacteria and lower abundances of Firmicutes occurring during hibernation compared to summer active microbiotas. In AGSs, the relative abundance of Bacteroidetes in hibernation (torpor and IBA) microbiotas was ca. 1.6-fold higher than that in the TLS (82% and 52% in the AGS and TLS, respectively; see Table 2 in reference 4); however, the magnitude of the difference between summer and hibernation microbiotas was greater in the TLS than in the AGSs. The relative abundance of Firmicutes during hibernation was nearly 3-fold lower in the AGS than in the TLS, and the magnitude of the difference between summer and hibernation microbiotas was also lower in the AGS than the TLS. Unlike in the TLS, members of the phyla Actinobacteria or Tenericutes did not differ seasonally in the AGS. In both the AGS and TLS these were minor taxa. Similarities in diversity in summer microbiotas may reflect that both the AGS and TLS were fed rodent chow diets in captivity (Mazuri no. 5663 and Harlan Teklad no. 7001 in the AGS and TLS, respectively [4]); importantly, however, TLS diets were supplemented with fruit and sunflower seeds (4). Differences in relative abundance of taxa or the magnitude of change across the season could reflect differences in hibernation phenotype (lower Tb during torpor and longer torpor bout length in AGSs [15, 19]) or composition of the captive diet prior to the onset of hibernation.
In both the TLS and AGS, the relative abundance of Akkermansia spp. was higher in hibernation microbiotas than summer microbiotas. The relative abundance of the family Rikenellaceae was also higher in the hibernation microbiotas than in summer microbiotas of both the AGS and TLS. In the AGS the dominant member of the family Rikenellaceae was an unclassified genus, whereas in the TLS the dominant member was the genus Alistipes. Interestingly, in an early preliminary analysis of our sequences using the same database as Carey et al. (4) (Greengenes release February 2011), the OTUs in AGS microbiotas matched to the genus Alistipes. It therefore seems likely that the same genus of the Rikenellaceae family is dominant in both AGS and TLS microbiotas. In the AGS, an unclassified genus in the family S24-7 was the dominant member of the hibernation microbiota and was 2-fold higher in hibernation microbiotas than in summer microbiotas. The genus Bacteroides and the unclassified genera of the families S24-7 and Rikenellaceae comprise the majority of the taxa from the order Bacteroidales and phylum Bacteroidetes identified in the hibernation microbiota of the AGS. Carey et al. (4) did not report S24-7 in the microbiotas of TLSs, likely due to the use of the older database to assign taxonomic identities (IDs); however, the order Bacteroidales was the most abundant in hibernation microbiotas in TLSs, accounting for nearly all of the taxa in the phylum Bacteroidetes.
In addition to being characterized by high relative abundances of the genus Akkermansia and members of the order Bacteroidales, both squirrel species were characterized by increases in less abundant taxa in their hibernation microbiotas, notably members of the order Burkholderiales and the family Desulfovibrionaceae. Finally, the AGS and TLS hibernation microbiotas had significant decreases in the Lachnospiracea compared to summer and completely lost Lactobacillaceae from their hibernation microbiotas.
Conclusion.
Our results clearly indicate that hibernation profoundly affects diversity, composition, activity and densities of the gut microbiota of captive AGSs. Additionally, hibernation selected for a core microbiota comprising Sutterella, Oscillospira, Bacteriodes, an unclassified genus of Rikenellaceae, and an unclassified member of the class Clostridia, and hibernation microbiotas were characterized as well by increased abundance of Akkermansia and S24-7 and the loss of Lactobacillaceae. These results, when combined with the data from TLSs (4), provide compelling evidence that changes in the microbiota during hibernation may be a phenomenon shared among obligate seasonal hibernators. These results also suggest the potential for a core hibernation microbiota among sciurids; however, this requires further study with multiple hibernating species. Core gut microbiotas have been suggested for humans (55) and mice (56), and discovery of a core hibernation gut microbiota among geographically distant and phylogenetically distinct hibernating species would be novel. Questions remain as to the point at which hibernation influences the microbiota and as to the relative effects of host Tb and fasting on the gut microbial community. Additionally, the importance of the gut microbiota to the hibernation phenotype has not been explored. For example, urea nitrogen salvage has been proposed as a method by which obligate seasonal hibernators conserve protein during hibernation (57–59), though few studies have addressed this. Arctic ground squirrels are known to remodel tissues (60) and catabolize lean mass during hibernation at ambient temperatures of <0°C (18, 61), and the gut microbiota may play an important role in protein conservation during their long hibernation season.
Supplementary Material
ACKNOWLEDGMENTS
Funding for this project was provided by NIGMS-NIH (grant 1R15GM098938-01; K.N.D. and C.L.B.), Alaska INBRE (grant NIGMS-NIH P20GM103395; T.J.S. and K.N.D.), UAF Center for Global Change (T.J.S.), UAA INNOVATE and EPSCoR (K.N.D. and C.L.B.), and UAA ENRI and NSF (grants NSF-EF-0732763 and NSF-IOS 1147187; C.L.B.).
We thank H. V. Carey (University of Wisconsin, Madison) for invaluable input during discussions of this study and for providing the SCFA extraction protocol. We thank W. J. Radloff and G. A. Brodrick of the U.S. Dairy Forage Research Center for technical assistance and use of instrumentation for SCFA analysis, M. D. Dillon and W. A. Walters for assistance with QIIME, and B. A. Quinlan, M. M. Richter, and B. M. Salli for assistance with animal care and sampling.
The content of this article is solely the responsibility of the authors and does not necessarily represent the official views of the NSF or the NIH.
We declare no conflict of interest.
Footnotes
Published ahead of print 7 July 2014
Supplemental material for this article may be found at http://dx.doi.org/10.1128/AEM.01537-14.
REFERENCES
- 1.Bäckhed F, Ley RE, Sonnenburg JL, Peterson DA, Gordon JI. 2005. Host-bacterial mutualism in the human intestine. Science 307:915–919. 10.1126/science.1104816 [DOI] [PubMed] [Google Scholar]
- 2.Salyers AA, Vercellotti JR, West SEH, Wilkins TD. 1977. Fermentation of mucin and plant polysaccharides by strains of Bacteroides from the human colon. Appl. Environ. Microbiol. 33:319–322 [DOI] [PMC free article] [PubMed] [Google Scholar]
- 3.Martens EC, Chiang HC, Gordon JI. 2008. Mucosal glycan foraging enhances fitness and transmission of a saccharolytic human gut bacterial symbiont. Cell Host Microbe 4:447–457. 10.1016/j.chom.2008.09.007 [DOI] [PMC free article] [PubMed] [Google Scholar]
- 4.Carey HV, Walters WA, Knight R. 2013. Seasonal restructuring of the ground squirrel gut microbiota over the annual hibernation cycle. Am. J. Physiol. Regul. Integr. Comp. Physiol. 304:R33–R42. 10.1152/ajpregu.00387.2012 [DOI] [PMC free article] [PubMed] [Google Scholar]
- 5.Flint HJ, Scott KP, Duncan SH, Louis P, Forano E. 2012. Microbial degradation of complex carbohydrates in the gut. Gut Microbes 3(4):1–18. 10.4161/gmic.19150 [DOI] [PMC free article] [PubMed] [Google Scholar]
- 6.Costello EK, Gordon JI, Secor SM, Knight R. 2010. Postprandial remodeling of the gut microbiota in Burmese pythons. ISME J. 4:1375–1385. 10.1038/ismej.2010.71 [DOI] [PMC free article] [PubMed] [Google Scholar]
- 7.Sonoyama K, Fujiwara R, Takemura N, Ogasawara T, Watanbe J, Ito H, Morita T. 2009. Response of gut microbiota to fasting and hibernation in Syrian hamsters. Appl. Environ. Microbiol. 75:6451–6456. 10.1128/AEM.00692-09 [DOI] [PMC free article] [PubMed] [Google Scholar]
- 8.Williams CT, Barnes BM, Kenagy GJ, Buck CL. 2014. Phenology of hibernation and reproduction in ground squirrels: integration of environmental cues with endogenous programming. J. Zool. 292(2):112–124. 10.1111/jzo.12103 [DOI] [Google Scholar]
- 9.Lyman CP, Willis JS, Malan A, Wang LCH. (ed). 1982. Hibernation and torpor in mammals and birds. Academic Press, New York, NY [Google Scholar]
- 10.Geiser F. 2004. Reduction of metabolism during hibernation and daily topor in mammals and birds: temperature effect or physiological inhibition. Annu. Rev. Physiol. 66:239–274. 10.1146/annurev.physiol.66.032102.115105 [DOI] [PubMed] [Google Scholar]
- 11.Carey HV. 1990. Seasonal changes in mucosal structure and function in ground squirrel intestine. Am. J. Physiol. 259:R385–R392 [DOI] [PubMed] [Google Scholar]
- 12.Carey HV, Sills NS. 1992. Maintenance of intestinal nutrient transport during hibernation. Am. J. Physiol. Regul. Integr. Comp. Physiol. 32:R517–R523 [DOI] [PubMed] [Google Scholar]
- 13.Schmidt JP. 1963. Microbiological aspects of hibernation in ground squirrels, p 399 In Viereck EG. (ed), Influence of cold on host-parasite interactions. Arctic Aeromedical Labortory, Fort Wainwright, AK [Google Scholar]
- 14.Barnes EM, Burton GC. 1970. The effect of hibernation on the caecal flora of the thirteen-lined ground squirrel. J. Appl. Microbiol. 33:505–514 [DOI] [PubMed] [Google Scholar]
- 15.Buck CL, Barnes BM. 1999. Annual cycle of body composition and hibernation in free-living arctic ground squirrels. J. Mammal. 80:430–442 [Google Scholar]
- 16.Sheriff MJ, Kenagy JG, Richter MR, Lee T, Tøien Ø, Kohl F, Buck CL, Barnes BM. 2011. Phenological variation in annual timing of hibernation and breeding in nearby populations of arctic ground squirrels. Proc. R. Soc. B 278:2369–2375. 10.1098/rspb.2010.2482 [DOI] [PMC free article] [PubMed] [Google Scholar]
- 17.Buck CL, Brenton A, Kohl F, Tøien Ø, Barnes BM. 2008. Overwinter body temperature patterns of free-living arctic ground squirrels (Spermophilis parryii). Torpor, hibernation and cryobiology, p 317–326 In Lovegrove BG, McKenchie AE. (ed), Hypometabolism in animals: torpor, hibernation and cryobiology. University of KwaZulu-Natal, Pietermaritzburg, South Africa [Google Scholar]
- 18.Buck CL, Barnes BM. 2000. Effects of ambient temperature on metabolic rate, respiratory quotient, and torpor in an arctic hibernator. Am. J. Physiol. Regul. Integr. Comp. Physiol. 279:R255–R262 [DOI] [PubMed] [Google Scholar]
- 19.Barnes BM. 1989. Freeze avoidance in a mammal: body temperatures below 0°C in an Arctic hibernator. Science 244:1593–1595. 10.1126/science.2740905 [DOI] [PubMed] [Google Scholar]
- 20.Geiser F. 1998. Evolution of daily and hibernation in birds and mammals: importance of body size. Clin. Exp. Pharmacol. P. 25:736–740. 10.1111/j.1440-1681.1998.tb02287.x [DOI] [PubMed] [Google Scholar]
- 21.Long RA, Hut RA, Barnes BM. 2007. Simultaneous collection of body temperature and activity data in burrowing mammals: a new technique. J. Wildl. Manage. 71:1375–1379. 10.2193/2006-399 [DOI] [Google Scholar]
- 22.Ben-Amor K, Heilig H, Smidt H, Vaughan EE, Abee T, De Vos WM. 2005. Genetic diversity, injured, dead fecal bacteria assessed by fluorescence-activated cell sorting and 16S rRNA gene analysis. Appl. Environ. Microbiol. 71:4679–4789. 10.1128/AEM.71.8.4679-4689.2005 [DOI] [PMC free article] [PubMed] [Google Scholar]
- 23.Caporaso JG, Kuczynski J, Stombaugh J, Bittinger K, Bushman FD, Costello EK, Fierer N, Gonzalez Peña A, Goodrich JK, Gordon JI, Huttley GA, Kelley ST, Knights D, Koenig JE, Ley RE, Lozupone CA, McDonald D, Muegge BD, Pirrung M, Reeder J, Sevinsky JR, Turnbaugh PJ, Walters WA, Widemann J, Yatsunenko T, Zaneveld J, Knight R. 2010. QIIME allows analysis of high-throughput community sequencing data. Nat. Methods 7:335–336. 10.1038/nmeth.f.303 [DOI] [PMC free article] [PubMed] [Google Scholar]
- 24.Reeder J, Knight R. 2010. Rapidly denoising pyrosequencing amplicon reads by exploiting rank-abundance distributions. Nat. Methods 7:668–669. 10.1038/nmeth0910-668b [DOI] [PMC free article] [PubMed] [Google Scholar]
- 25.Edgar RC. 2010. Search and clustering orders of magnitude faster than BLAST. Bioinformatics 26:2460–2461. 10.1093/bioinformatics/btq461 [DOI] [PubMed] [Google Scholar]
- 26.DeSantis TZ, Hugenholtz P, Larsen N, Rojas M, Brodie EL, Keller K, Huber T, Dalevi D, Hu P, Andersen GL. 2006. Greengenes, a chimera-checked 16S rRNA gene database and workbench compatible with ARB. Appl. Environ. Microbiol. 72:5069–5072. 10.1128/AEM.03006-05 [DOI] [PMC free article] [PubMed] [Google Scholar]
- 27.Wang Q, Garrity GM, Tiedje GM, Cole JR. 2007. Naïve Bayesian classifier for rapid assignment of rRNA sequences into the new bacterial taxonomy. Appl. Environ. Microbiol. 73:5261–5267. 10.1128/AEM.00062-07 [DOI] [PMC free article] [PubMed] [Google Scholar]
- 28.Caporaso JG, Bittinger K, Bushman FD, DeSantis TZ, Andersen GL, Knight R. 2010. PyNAST: a flexible tool for aligning sequences to a template alignment. Bioinformatics 26:266–267. 10.1093/bioinformatics/btp636 [DOI] [PMC free article] [PubMed] [Google Scholar]
- 29.Price MN, Dehal PS, Arkin AP. 2010. FastTree 2—approximately maximum-likelihood trees for large alignments. PLoS One 5(3):e9490. 10.1371/journal.pone.0009490 [DOI] [PMC free article] [PubMed] [Google Scholar]
- 30.Lozupone C, Knight R. 2005. UniFrac: a new phylogenetic method for comparing microbial communities. Appl. Environ. Microbiol. 71:8228–8235. 10.1128/AEM.71.12.8228-8235.2005 [DOI] [PMC free article] [PubMed] [Google Scholar]
- 31.Clarke KR, Gorley RN. 2006. Primer 6 user manual. Plymouth Marine Laboratory, Plymouth, United Kingdom. [Google Scholar]
- 32.Stevenson TJ, Buck CL, Duddleston KN. 2014. Temporal dynamics of the cecal gut microbiota of juvenile arctic ground squirrels: a strong litter effect across the first active season. Appl. Environ. Microbiol. 80:4260–4268. 10.1128/AEM.00737-14 [DOI] [PMC free article] [PubMed] [Google Scholar]
- 33.Louis P, Scott SH, Duncan SH, Flint HJ. 2007. Understanding the effects of diet on bacterial metabolism in the large intestine. J. Appl. Microbiol. 102:1197–1208. 10.1111/j.1365-2672.2007.03322.x [DOI] [PubMed] [Google Scholar]
- 34.Scott KP, Gratz SW, Sheridan PO, Flint HJ, Duncan SH. 2013. The influence of diet on the gut microbiota. Pharmacol. Res. 69:52–60. 10.1016/j.phrs.2012.10.020 [DOI] [PubMed] [Google Scholar]
- 35.Xu J, Bjursell MK, Himrod J, Deng S, Carmichael LK, Chiang HC, Hooper LV, Gordon JI. 2003. A genomic view of the human-Bacteroides thetaiotaomicron symbiosis. Science 299:2074–2076. 10.1126/science.1080029 [DOI] [PubMed] [Google Scholar]
- 36.Derrien M, Collado MC, Ben-Amor K, Salminen S, de Vos WM. 2008. The mucin degrader Akkermansia muciniphila is an abundant resident of the human intestinal tract. Appl. Environ. Microbiol. 74:1646–1648. 10.1128/AEM.01226-07 [DOI] [PMC free article] [PubMed] [Google Scholar]
- 37.Serino M, Luche E, Gres S, Baylac A, Bergé M, Cenac C, Waget A, Klopp P, Iacovoni J, Klopp C, Mariette J, Bouchez O, Lluch J, Ouarné F, Monsan P, Valet P, Roques C, Amar J, Bouloumié A, Théodorou V, Burcelin R. 2012. Metabolic adaptation to a high-fat diet is associated with a change in the gut microbiota. Gut 61:543–553. 10.1136/gutjnl-2011-301012 [DOI] [PMC free article] [PubMed] [Google Scholar]
- 38.Comstock LE. 2009. Importance of glycans to the host-bacteroides mutualism in the mammalian intestine. Cell Host Microbe 5:522–526. 10.1016/j.chom.2009.05.010 [DOI] [PubMed] [Google Scholar]
- 39.Gibson GR, Macfarlane GT, Cummings JH. 1988. Occurrence of sulphate-reducing bacteria in human faeces and the relationship of dissimilatory sulphate reduction to methanogenesis in the large gut. J. Appl. Microbiol. 65:103–111 [DOI] [PubMed] [Google Scholar]
- 40.Louis P, Flint HJ. 2009. Diversity, evolution and microbial ecology of butyrate-producing bacteria from the human large intestine. FEMS Microbiol. Lett. 294:1–8. 10.1111/j.1574-6968.2009.01514.x [DOI] [PubMed] [Google Scholar]
- 41.Bernalier-Donadille A. 2010. Fermentative metabolism by the human gut microbiota. Gastroenterol. Clin. Biol. 34(Suppl 1):S16–S22 (In French.) 10.1016/S0399-8320(10)70016-6 [DOI] [PubMed] [Google Scholar]
- 42.Hume D, Beiglbock C, Ruf T, Bruns FRU, Arnold W. 2002. Seasonal changes in morphology and function of the gastrointestinal tract of free-living alpine marmots. J. Comp. Physiol. B 172:197–207. 10.1007/s00360-001-0240-1 [DOI] [PubMed] [Google Scholar]
- 43.Macfarlane S, Macfarlane GT. 2003. Regulation of short-chain fatty acid production. Proc. Nutr. Soc. 62:67–72. 10.1079/PNS2002207 [DOI] [PubMed] [Google Scholar]
- 44.Zogg GP, Zak DR, Ringelberg DB, White DC, MacDonald NW, Pregitzer KS. 1997. Compositional and functional shifts in microbial communities due to soil warming. Soil Sci. Soc. Am. J. 61:475–481. 10.2136/sssaj1997.03615995006100020015x [DOI] [Google Scholar]
- 45.Andrews JA, Matamala R, Westover KM, Schlesinger WH. 2000. Temperature effects on the diversity of soil heterotrophs and the δ13C of soil-respired CO2. Soil Biol. Biochem. 32:699–706. 10.1016/S0038-0717(99)00206-0 [DOI] [Google Scholar]
- 46.Wiley JM, Sherwood L, Woolverton CJ, Lansing PM. 2008. Presscott, Prescott, Harley, and Klein's microbiology. McGraw-Hill Higher Education, New York, NY [Google Scholar]
- 47.Ingraham JL. 1958. Growth of psychrophilic bacteria. J. Bacteriol. 76:75–80 [DOI] [PMC free article] [PubMed] [Google Scholar]
- 48.Sonnenburg JL, Xu J, Leip DD, Chen C, Westover J, Buhler JD, Gordon JI. 2005. Glycan foraging in vivo by an intestine-adapted bacterial symbiont. Science 307:1955–1959. 10.1126/science.1109051 [DOI] [PubMed] [Google Scholar]
- 49.Crawford PA, Crowley JR, Sambandam N, Muegge BD, Costello EK, Hamady M, Knight R, Gordon JI. 2009. Regulation of myocardial ketone body metabolism by the gut microbiota during nutrient deprivation. Proc. Natl. Acad. Sci. U. S. A. 106:11276–11281. 10.1073/pnas.0902366106 [DOI] [PMC free article] [PubMed] [Google Scholar]
- 50.Krilowicz BL. 1985. Ketone body metabolism in a ground squirrel during hibernation and fasting. Am. J. Physiol. Regul. Integr. Comp. Physiol. 249:R462–R470 [DOI] [PubMed] [Google Scholar]
- 51.Andrews MT, Russeth KP, Drewes LR, Henry PG. 2009. Adaptive mechanisms regulate preferred utilization of ketones in the heart and brain of a hibernating mammal during arousal from torpor. Am. J. Physiol. Regul. Integr. Comp. Physiol. 96:R383–R393. 10.1152/ajpregu.90795.2008 [DOI] [PMC free article] [PubMed] [Google Scholar]
- 52.Bergman EN. 1990. Energy contributions of volatile fatty acids from the gastrointestinal tract in various species. Physiol. Rev. 70:567–590 [DOI] [PubMed] [Google Scholar]
- 53.Galster W, Morrison PR. 1975. Gluconeogenesis in arctic ground squirrels between periods of hibernation. Am. J. Physiol. 228:325–330 [DOI] [PubMed] [Google Scholar]
- 54.Newsholme EA, Crabtree B, Ardawi MS. 1985. The roles of high rates of glycolysis and glutamine utilization in rapidily dividing cells. Biosci. Rep. 5:393–400. 10.1007/BF01116556 [DOI] [PubMed] [Google Scholar]
- 55.Arumugam M, Raes J, Pelletier LE, Paslier D, Yamada T, Mende DR, Fernandes GR, Tap J, Bruls T, Batto JM, Bertalan M, Borruel N, Casellas F, Fernandez L, Gautier L, Hansen T, Hattori M, Hayashi T, Kleerobezem M, Kurokawa K, Leclerc M, Levenez F, Manichanh C, Nielsen HB, Nielsen T, Pons N, Poulain J, Qin J, Sicheritz-Ponten T, Tims S, Torrents D, Ugarte E, Zoetendal EG, Wang J, Guarner F, Pedersen O, De Vos WM, Brunak S, Dore J, Weissenbach J, Ehrlich SD, Bork P. 2011. Enterotypes of the human gut microbiome. Nature 473:174–180. 10.1038/nature09944 [DOI] [PMC free article] [PubMed] [Google Scholar]
- 56.Benson AK, Kelly SA, Legge R, Ma F, Low SJ, Kim J, Zhang M, Oh PL, Nehrenberg D, Hua K, Kachman SD, Moriyama EN, Walter J, Peterson DA, Pomp D. 2010. Individuality in the gut microbiota composition is a complex polygenic trait shaped by multiple environmental and host genetic factors. Proc. Natl. Acad. Sci. U. S. A. 107:18933–18938. 10.1073/pnas.1007028107 [DOI] [PMC free article] [PubMed] [Google Scholar]
- 57.Harlow H. 2012. Muscle protein and strength retention by bears during winter fasting and starvation, p 277–296 In McCue MD. (ed), Comparative physiology of fasting, starvation, and food limitation. Soinger-Verlag, Heidelberg, Germany [Google Scholar]
- 58.Nelson RA. 1989. Nitrogen conservation and its turnover in hibernation, p 299–307 In Malan A, Canguilhem B. (ed), Living in the cold. Libbey Eurotext, London, United Kingdom [Google Scholar]
- 59.Riedesel ML, Steffen JM. 1980. Protein metabolism and urea recycling in rodent hibernators. Fed. Proc. 39:2959–2963 [PubMed] [Google Scholar]
- 60.Lee TN, Fridinger RW, Barnes BM, Buck CL, O'Brien DM. 2011. Estimating lean mass over a wide range of body composition: a calibration of deuterium dilution in the arctic ground squirrel. Rapid Commun. Mass Spectrom. 25:3491–3496. 10.1002/rcm.5253 [DOI] [PubMed] [Google Scholar]
- 61.Buck CL, Barnes BM. 1999. Temperatures of hibernacula and changes in body composition of arctic ground squirrels over winter. J. Mammal. 80:1264–1276 [Google Scholar]
Associated Data
This section collects any data citations, data availability statements, or supplementary materials included in this article.