

Abstract
Recent advances in meta-omics and particularly metatranscriptomic approaches have enabled detailed studies of the structure and function of microbial communities in many ecosystems. Molecular analyses of peat soils, ecosystems important to the global carbon balance, are still challenging due to the presence of coextracted substances that inhibit enzymes used in downstream applications. We sampled layers at different depths from two high-Arctic peat soils in Svalbard for metatranscriptome preparation. Here we show that enzyme inhibition in the preparation of metatranscriptomic libraries can be circumvented by linear amplification of diluted template RNA. A comparative analysis of mRNA-enriched and nonenriched metatranscriptomes showed that mRNA enrichment resulted in a 2-fold increase in the relative abundance of mRNA but biased the relative distribution of mRNA. The relative abundance of transcripts for cellulose degradation decreased with depth, while the transcripts for hemicellulose debranching increased, indicating that the polysaccharide composition of the peat was different in the deeper and older layers. Taxonomic annotation revealed that Actinobacteria and Bacteroidetes were the dominating polysaccharide decomposers. The relative abundances of 16S rRNA and mRNA transcripts of methanogenic Archaea increased substantially with depth. Acetoclastic methanogenesis was the dominating pathway, followed by methanogenesis from formate. The relative abundances of 16S rRNA and mRNA assigned to the methanotrophic Methylococcaceae, primarily Methylobacter, increased with depth. In conclusion, linear amplification of total RNA and deep sequencing constituted the preferred method for metatranscriptomic preparation to enable high-resolution functional and taxonomic analyses of the active microbiota in Arctic peat soil.
INTRODUCTION
Metatranscriptomics is the study of rRNA and mRNA of a (microbial) community in an environment. It allows the simultaneous investigation of the gene expression (mRNA) and abundance (rRNA) of the active microorganisms. In contrast to proteins, which have a longer lifetime in the cell and more stable concentrations in response to external influences, mRNAs provide a more immediate picture of the cells responses to changing environmental conditions. Also, metatranscriptomics avoids the limitations inherent to PCR primer-based methods (1, 2). The poly(A) tail of eukaryotic mRNAs enables the cDNA synthesis from these mRNA templates in total RNA pools with selective primers (3). The total microbial RNA is dominated by rRNA transcripts, including prokaryotic 16S and 23S rRNAs and eukaryotic 18S and 28S rRNAs. Only a small fraction, usually 1 to 5%, is mRNA (1, 2). Several strategies are currently applied to enrich for prokaryotic mRNA molecules. Selective nuclease degradation of rRNA (3–5), polyadenylation of mRNA (6), and rRNA depletion by capture with commercial kits (3, 5, 7, 8) and sample-specific probes (9) have been attempted to reduce the rRNA fraction of metatranscriptomes.
A second challenge, and a general problem for DNA- and RNA-based analyses of soil microbes, is the coextraction of enzyme-inhibiting compounds such as humic and fulvic acids and phenolic compounds (1). In peat soils, the inhibition has been shown to increase with soil depth (10). Inhibition is particularly problematic in the preparation of metatranscriptomic libraries, in which rather large quantities of RNA are needed for double-stranded cDNA synthesis prior to sequencing. Several studies have addressed this issue, providing strategies for the removal of humic and fulvic acids during the extraction of nucleic acids (1). Suggested methodology includes Sephadex spin columns and polyethylene glycol (PEG) precipitation of nucleic acids (11). Continued inhibition after extract purification might be related to the high concentrations of enzyme-inhibiting phenolic compounds, particularly in anoxic soils such as peat (12, 13). Metatranscriptomic studies have provided new and important knowledge about soil ecosystems (2, 10, 14–16), but few studies have been carried out compared to studies of marine ecosystems, in part because of the inhibition problems mentioned above.
Arctic peat soils store large amounts of soil organic carbon (SOC). Soil microorganisms are driving the SOC mineralization to the greenhouse gases methane (CH4) and carbon dioxide (CO2). In anoxic peat, plant polymers are degraded through several hydrolysis and fermentation steps involving at least four functionally distinct types of microorganisms: primary and secondary fermenters and two groups of methanogens (17, 18). Formate, H2/CO2, and acetate are the major substrates for methanogenesis, but in certain situations, methylamines and methanol are also substrates (19).
CH4 emissions can be mitigated by microbial CH4 oxidation. In terrestrial and freshwater ecosystems, CH4 oxidation is primarily aerobic and performed by Proteobacteria (20) and Verrucomicrobia (21). Proteobacterial methanotrophs closely related to the aerobic Methylobacter are characteristic for circumarctic soils (22, 23). Stable isotope signature studies indicate that a major sink for CH4 in peat soils is anaerobic CH4 oxidation (24), but the oxidants, enzymes, and organism(s) involved are unknown.
More knowledge is needed to understand how microbial communities functionally interact in the degradation of SOC and how they will respond to environmental changes such as the predicted drastic increase of surface temperatures in Arctic regions.
In this study, we present a method for the generation of high-quality metatranscriptomes from peat soils to circumvent inhibition problems. Further, we assessed the usability of widely applied mRNA enrichment protocols. We used the generated metatranscriptomes for analyzing the expression of genes encoding key functions in SOC degradation, such as hydrolysis of polysaccharides and methanogenesis, and methanotrophy in two high-Arctic peat soils.
MATERIALS AND METHODS
Study sites and sampling.
High organic Arctic peat soil samples were collected from two sites in Svalbard, Norway, Solvatn (N78°55.550, E11°56.611) and Knudsenheia (N78°56.544, E11°49.055), in August 2009 (10). Peat blocks were kept intact under transport from the field sites to the laboratory where the first preparation was made. Processing of the deeper layers was performed under nitrogen atmosphere to avoid oxygen contamination. Immediately after disruption of the peat blocks for subsampling and storage, subsamples were frozen in liquid nitrogen to avoid effects of changing conditions in the mRNA pools. The samples were transported in a dry shipper from Svalbard to the home laboratories where the further preparation for RNA isolation was done.
Sample and RNA processing.
Samples from oxic and anoxic layers of the two sites Knudsenheia (from the top to deepest layers: Ka, Kb, and Kc) and Solvatn (Sa and Sb) were ground in liquid nitrogen using a mortar and pestle until a fine powder was obtained. The low temperature prevented microbial and RNase activities. From each homogenized sample six replicates of ∼0.2 g of peat soil were used for nucleic acid (NA) extraction using a modified version of Griffith's protocol (2, 10). To prevent RNase activity during cell lysis, bead beating was carried out in the presence of the denaturant phenol. DNA was removed using RQ1 DNase treatment (Promega, Madison, WI), followed by RNA purification using the MEGAclear kit (Ambion, Austin, TX). The two top samples, Ka and Sa, were used for mRNA enrichment, applying the three commercially kits according to the manufacturers' instructions in the following order: (i) RiboMinus kit for bacteria (specificity: Gram-positive and -negative bacteria, human, mouse, yeast; Invitrogen, Carlsbad, CA), (ii) MICROBExpress (specificity: Gram-positive and -negative bacteria; Ambion, Austin, TX), and (iii) RiboMinus kit for eukaryotes (specificity: eukaryotes; Invitrogen). All three kits are based on subtractive hybridization of rRNA with oligonucleotide probes and capture with magnetic beads. Starting quantities for each kit are shown in Table S2 in the supplemental material. The quality of RNA was assessed using automated gel electrophoresis (Experion; Bio-Rad, Hercules, CA) with standard-sensitivity RNA chips.
Total RNA for all samples and the mRNA-enriched sample (Km) were diluted and amplified using linear amplification with MessageAmp II-Bacteria kit (Ambion). A test with RNA extracted from Kb was performed with concentrations of 2.5, 10, and 20 ng/μl (equivalent to 12.5, 50, and 100 ng per reaction) to identify whether the concentration affected the output of amplified RNA. It was found that concentrations of 10 and 20 ng/μl resulted in <25% of the final yield of amplified RNA. Based on this, a total of 12.5 ng of RNA at a concentration of 2.5 ng/μl was used as the template for all samples. This was in accordance with the recommendations of the supplier, which stated that 10 ng of RNA should be considered the minimum input. Double-stranded cDNA was generated from the amplified RNA using the Superscript II double-stranded cDNA synthesis kit (Invitrogen) by following the manufacturer's protocol, with the exception that both the first- and second-strand syntheses were carried out for 4 h each. Library preparation, processing, and sequencing were performed at the Norwegian High Throughput Sequencing Centre (NSC), using the Illumina HighSeq2000 (Illumina, Inc., San Diego, CA) with paired-end (PE) 101-bp sequencing of ∼170-bp-long templates.
Sequence analyses.
Paired-end sequence reads were first assembled using Pandaseq (25), with a minimum overlap of 10 bp and otherwise default settings. Preprocessing of the assembled sequences was carried out using Prinseq (26); poly(A/T) tails longer than 15 bp (Table 1) were trimmed away, sequences with more than 5 ambiguous bases were removed, and all but one sequence in pools of exactly identical sequences were removed (Table 1). rRNA and putative mRNAs were separated as previously described (2, 27). Sequences with bit scores of <50 were assigned as putative mRNA tags. Small subunit (SSU) rRNAs (subsets of 500,000 sequences) were taxonomically assigned by MEGAN analysis of BLASTN files against the CREST SilvaMod rRNA reference database (parameters: minimum bit score, 150; minimum support, 1; top percent, 2; 50 best blast hits) (28). Putative mRNAs were taxonomically and functionally annotated by MEGAN analysis (parameters: minimum bit score, 50; minimum support, 1; top percent; best blast hit only) of BLASTX files against the RefSeq protein database. Analysis of methanogenic pathways was performed by functional annotation of mRNAs assigned to Archaea using the KEGG and SEED classification systems available in MEGAN (29). Analysis of pathways of anaerobic respiration and fermentation was done the same way, using all taxonomically assigned reads. For assignment of transcripts to protein families (Pfams), the putative mRNAs were translated into all six frames, each frame into separate open reading frames (ORFs), avoiding any “*” characters marking stop codons in a resulting ORF. All ORFs corresponding to 40 amino acids or larger were screened for assignable conserved protein domains. All ORFs were inspected by reference hidden Markov models (HMMs) using HMMER tools (http://hmmer.janelia.org/) with the Pfam database HMMs (Pfam release 25; http://pfam.xfam.org/). All database hits with E values below a threshold of 10−4 were counted. Counts were used to generate Pfam profiles for all sample metatranscriptomes. These were combined in a sample Pfam profile matrix for further analysis. The matrix contains the counts of transcripts assigned to each Pfam for each sample. The computations were performed on the Stallo cluster at the High Performance Computing Group at the University of Tromsø (https://www.notur.no/). Putative Pfam sequence-containing ORFs were taxonomically annotated by MEGAN analysis (parameters: minimum bit score, 50; minimum support, 1; top percent, 2) of BLASTP files against the RefSeq protein database.
TABLE 1.
Number of assembled sequence reads generated from paired-end sequencing of metatranscriptomesa
| Sample | Preprocessing |
|||||||||||
|---|---|---|---|---|---|---|---|---|---|---|---|---|
| No. of assembled RNA sequences | No. of sequences with ambiguous bases | No. of sequences from which poly(A/T) tails were trimmed | No. of sequences consisting only of poly(A/T) tails | No. of duplicate sequences removed | No. of sequences remaining after preprocessing | Mean sequence length | No. of low-complexity sequences | No. of LSSU rRNAs | No. of putative mRNAs | No. of RefSeq protein sequences | No. of sequences with Pfam domains | |
| Ka | 14,781,052 | 1,560,346 | 585,366 | 1,665 | 1,360,987 | 11,858,054 | 150.27 | 8,939 | 10,036,189 (0.85) | 1,812,926 (0.15) | 298,698 (0.16) | 92,630 (0.051) |
| Km | 19,899,358 | 1,937,845 | 4,213,884 | 170 | 2,090,266 | 15,871,077 | 143.31 | 8,296 | 9,726,981 (0.61) | 6,135,800 (0.39) | 815,486 (0.13) | 256,062 (0.042) |
| Kb | 8,695,485 | 1,011,477 | 545,346 | 59 | 669,990 | 7,013,959 | 153.20 | 7,513 | 5,557,385 (0.79) | 1,449,061 (0.21) | 137,257 (0.09) | 42,858 (0.030) |
| Kc | 17,292,468 | 2,006,386 | 850,267 | 199 | 2,508,518 | 12,777,365 | 151.85 | 3,129 | 9,198,689 (0.72) | 3,575,547 (0.28) | 272,563 (0.08) | 80,374 (0.022) |
| Sa | 16,963,375 | 1,804,460 | 514,250 | 585 | 1,985,671 | 13,172,659 | 150.54 | 7,861 | 10,935,169 (0.83) | 2,229,629 (0.17) | 321,674 (0.14) | 97,115 (0.044) |
| Sb | 13,939,690 | 1,395,723 | 672,145 | 117 | 1,286,672 | 11,257,178 | 151.76 | 4,625 | 9,280,077 (0.82) | 1,972,476 (0.18) | 214,568 (0.11) | 62,941 (0.032) |
An Illumina HiSeq2000 was used (see Materials and Methods for details about sequencing and bioinformatics). Low-complexity sequences were removed with default settings by BLASTN with LSSU database, LSSU rRNAs are sequences with similarity to LSSU database sequences, putative mRNAs are sequences below threshold in an LSSU database search, and RefSeq protein sequences are sequences with similarity to RefSeq protein database sequences. Numbers in parentheses for LSSU rRNAs and putative mRNAs are percentages of the last column under “Preprocessing.” Numbers in parentheses for RefSeq protein and Pfam sequences are percentages of the putative mRNAs.
Statistical data analyses.
The R package (30) was used for subsampling from sample Pfam profile matrices (function: sample; replacement = TRUE), linear regression (function: lm), multivariate analyses, chi-squared contingency table test (function: chisq.test), and plotting. Correspondence analysis (CA) and contribution biplots were done according to Greenacre (31, 32). CA was applied because it grants a larger impact of low-abundance variables (Pfams) in the analysis than alternative methods. Also, it weights the samples based on the number of reads to ensure that the ordination is not biased by the low variance that is characteristic for small samples.
Significant differences between the frequencies of conserved protein domains (Pfam) in ORFs and transcripts homologous to genes encoding key enzymes for methanogenesis and methanotrophy of different peat soil depths were evaluated statistically by using the R package (30), using the chi-squared contingency table test. The contingency table contains the frequency counts of hits and nonhits for a certain Pfam domain category or methanogenesis enzyme of two different soils. The total frequency count is given by all hits found for any domain in the Pfam database. In cases where the frequencies were too low to meet the rules of the test, the P values were calculated by Monte Carlo simulations with 2,000 replicates.
Accession numbers.
The sequence data generated in this study were deposited in the Sequence Read Archive of NCBI and are accessible through accession numbers SRR1509497, SRR1509498, SRR1509518, SRR1509520, SRR1509521, and SRR1509522.
RESULTS
Generation of peat soil metatranscriptomes.
The nucleic acid (NA) extraction efficiency of the sample lysis procedure was substantially increased by a prior grinding of the peat matrix in liquid nitrogen, from 5 to 10 μg of NA/g (dry weight) (gDW) of soil to >20 μg of NA/gDW of soil (see Materials and Methods for details). The quantity and quality of extracted NAs varied between the sites and the depths (see Table S1 in the supplemental material). Higher NA yields, ∼500 to 600 μg g of soil−1, were obtained from the top layers (Ka and Sa) and the lower layer of Solvatn (Sb), while the deeper layers of Knudsenheia (Kb and Kc) yielded low quantities (∼100 μg of NA g of soil−1). The ratios of A260 to A230 obtained from spectrophotometric measurements decreased with depth (Kb and Kc), indicating higher concentrations of coextracted humic substances. In line with this, cDNA synthesis efficiencies were high with samples from the top layers, whereas the reactions with deeper-layer samples were severely inhibited. Total RNA was dominated by peaks corresponding to 16S/23S and 18S/28S rRNAs of pro- and eukaryotes, respectively (Fig. 1; see also Fig. S1 in the supplemental material). rRNA removal with probe-based kits resulted in RNA profiles exhibiting a clear reduction in the sizes of peaks corresponding to rRNA molecules (Fig. 1; see also Fig. S1). The RiboMinus kit for bacteria (Invitrogen) used in the first step contains probes compatible with a broad range of bacterial taxa and correspondingly decreased the size of the 16S and 23S rRNAs of the RNA pools. The MICROBExpress (Ambion) kit used in the second step has a profile similar to that of the Ribominus kitfor bacteria, thus removing additional 16S and 23S rRNAs from the RNA pools. The RiboMinus kit for eukaryotes (Invitrogen) used in the third step has rRNA probe compatibility to eukaryotic rRNA and correspondingly removed 18S and 28S rRNAs from the remaining RNA pool. RNA removal after each subtractive hybridization step with three subsequent kits removed ∼70% and ∼77% of the rRNAs from the total RNA pools of for samples Sa and Ka, respectively (see Table S2 in the supplemental material). However, cDNA synthesis attempts with mRNA-enriched RNA from Sa and Ka as the template failed.
FIG 1.

Relative abundances of different RNA fragments in the sample Ka. (A) Total RNA; (B) after treatment with the RiboMinus kit for bacteria; (C) after treatment with the RiboMinus kit for bacteria and the MICROBExpress kit; (D) after treatment with the RiboMinus kit for bacteria, the MICROBExpress kit, and the RiboMinus kit for eukaryotes. Fluorescence and time are equivalent to the abundance and the size of RNA fragments, respectively. The relative abundances of RNA fragments can be compared within and between treatments.
To circumvent inhibition of the cDNA synthesis of RNA from the deep peat layers (Kb, Kc, and Sb) and the mRNA-enriched top layer (Km), the RNA was diluted to 2.5 ng/μl. Five microliters (12.5 ng) was used as the template in linear RNA amplification procedures using the MessageAmp II-Bacteria kit (Ambion). A test performed prior to this experiment showed that concentrations of 10 and 20 ng/μl of RNA (50 and 100 ng RNA per reaction, respectively) from anoxic peat samples (Kb) resulted in approximately one-fourth of the amplified RNA output compared to that obtained in the reaction with 12.5 ng of the template. Linear amplification with 12.5 ng of template RNA yielded large amounts of amplified RNA for all samples (see Table S3 in the supplemental material). The amplification efficiency was highest for the previously uninhibited top-layer samples (Ka and Sa), while all the samples from deep peat layers yielded smaller amounts of amplified RNA, despite equal amounts of template RNA. This, together with the above-described experiment, suggests a persistent inhibition of enzymatic steps in the RNA amplification protocol with RNA from the lower peat layers, which is concentration dependent. Nevertheless, the synthesis of double-stranded cDNA was possible with the amplified RNA from all samples.
Comparison of mRNA-enriched with original samples.
Sequencing with the Illumina HighSeq2000 platform yielded 7 to 16 million overlapping sequences (Table 1). The fraction of putative mRNAs was 15 to 28% in the total RNA samples, while it was 39% in the mRNA-enriched sample (Km). Between 8% and 16% of putative mRNAs had homology to known protein-coding genes (RefSeq BLASTx bit score, 50).
To assess potential biases introduced during mRNA enrichment, the relative abundance of transcripts annotated to Pfams was compared between the mRNA-enriched (Km) and nonenriched (Ka) metatranscriptomes. Linear regressions on the double-log scatter plots of the relative abundances of Pfams in two random subsamples from the Pfam profile of the same metatranscriptomic library (Ka1 and Ka2 or Km1 and Km2) gave R2 values of ∼0.96 (Fig. 2). However, the R2 was ∼0.75 in the comparison of mRNA-enriched (Km) and nonenriched samples (Ka) (Fig. 2), indicating that the relative abundances of transcripts were affected by the mRNA enrichment procedures. The Pfam profiles of nonenriched top layer samples from the two different sites (Sa and Ka) were more similar than the profiles of the mRNA-enriched and nonenriched samples from the same site (Ka and Km) (Fig. 2). This is clearly illustrated in a CA plot in which Km separated from Ka to a similar extent as the two samples from the other site, Solvatn (Sa and Sb) (Fig. 3). However, no Pfams were particularly affected by the mRNA enrichment, as indicated by the comparison of differences in relative abundances of transcripts for all Pfams between Ka and Km (data not shown). Also, the taxonomic distribution of mRNA transcripts homologous to protein-coding genes in reference sequence genomes (RefSeq protein) showed that no microbial taxa were specifically affected by the mRNA enrichment (data not shown).
FIG 2.
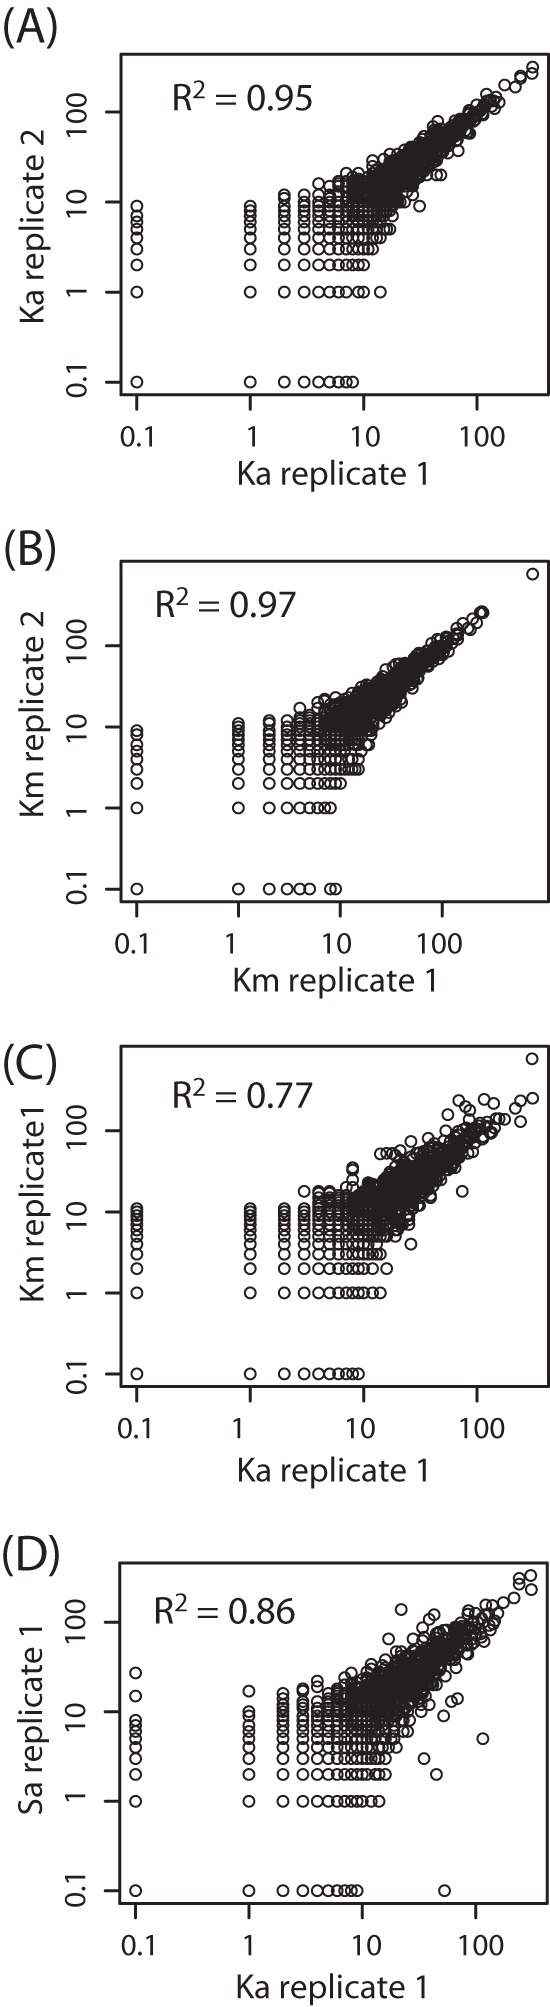
Double-log plots showing the abundance distribution between protein families (Pfam) in subsamples of Ka (A), Km (B), Ka and Km (C), and Ka and Sa (D). The Pfam profiles for all samples were randomly subsampled two times for 30,000 transcripts, within the number of the sample with fewest transcripts assigned to a Pfam. Replicate number indicates the specific random subsampling used in the comparison. Each comparison displays the transcript abundances of Pfams for two subsamples plotted on a logarithmic scale in XY plots. The logarithmic scale is used to reduce the effect of outliers in the comparison. Linear regression on each XY plot gives R2 values.
FIG 3.
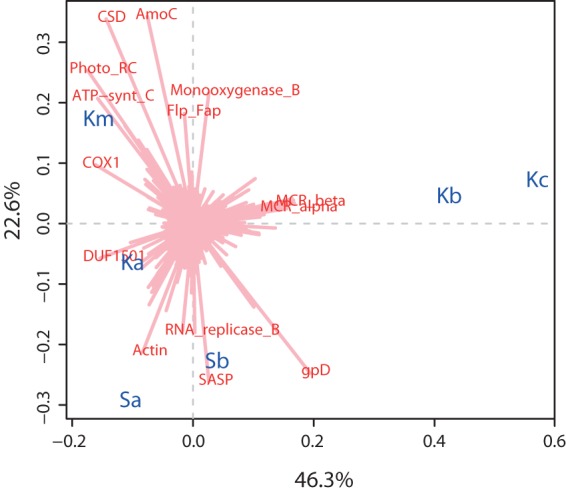
Biplot of correspondence analysis of sample Pfam profiles, illustrating the difference in gene expression. Pfam profiles corresponding to the different depths of Knudsenheia (Ka, Kb, and Kc) and Solvatn (Sa and Sb) are shown in blue. Individual Pfams responsible for the majority of the differences between samples are shown in red. The x axis represents the first dimension, which explained 46.3% of the inertia (a measure of the total difference between sample profiles); the y axis represents the second dimension, which explained 22.6% of the inertia. The distance between the sample Pfam profiles indicates the difference in gene expression between samples. The length of the line connecting Pfams to the center of the plot is equivalent to the weight of particular Pfams in the final solution, given the inertia of the dimensions it crosses (i.e., the longer the line, the larger part of the inertia it explains). The direction of the line indicates the sample orientation of its weight (e.g., if a line points toward deeper-layer samples, the relative abundance of transcripts for that Pfam is highest in the deeper layers).
Transcripts of polysaccharide hydrolysis, fermentation, methanogenesis, and methanotrophy.
The development of a protocol for peat soil metatranscriptomes has enabled deeper insights into the microbiology of Arctic peat soil. We have focused on the following key steps of SOC degradation and CH4 cycling in peat soils: hydrolysis of polysaccharides, the initial steps of SOC degradation, methanogenesis, and CH4 oxidation. The bacterial communities in the top peat layers in Solvatn and Knudsenheia were dominated by Alpha- and Deltaproteobacteria, Acidobacteria, Planctomycetes, and Actinobacteria (see Fig. S2 in the supplemental material). In Knudsenheia, the relative abundance of Actinobacteria increased substantially with depth, while the Planctomycetes and Acidobacteria populations decreased. In Solvatn, there were only minor depth-related differences between the bacterial populations. The Eukarya profiles were dominated by 18S rRNA fragments assigned to plants (Viridiplantae), primarily mosses. The relative abundance of plant rRNA decreased with depth in both Knudsenheia and Solvatn. Other large taxa were the Metazoa, Alveolata, and Rhizaria, all of which decreased with depth, particularly in Knudsenheia.
Transcripts related to the degradation of plant polysaccharides (cellulose, hemicellulose, and hemicellulose branches) and aromatic compounds (e.g., phenolic compounds) were investigated in detail (Fig. 4). The relative abundances of transcripts for cellulose and aromatic degradation decreased with depth, while transcripts for hemicellulose debranching enzymes showed the opposite trend. Transcripts for hemicellulose degradation did not have a distinct depth-related pattern. The major glycoside hydrolase families involved in hemicellulose degradation were GH53 (galactosidase), GH26 (mannanase), and GH10 (xylanase), involved in the cleavage of galactose and mannan from, e.g., galactomannans and glucogalactomannans and in xylan degradation, respectively. Particularly abundant in the lower layers were the transcripts for alpha-l-fucosidases, rhamnosidases, and alpha-l-arabinofuranosidases, which are involved in the degradation of highly branched hemicelluloses of plant cell walls such as fucoside xyloglucans, rhamnogalacturonans (structural domains in complex pectins), and arabinoxylan. The transcripts for all four enzyme categories were taxonomically binned to a broad range of bacterial taxa (see Fig. S3 in the supplemental material). A large fraction of the transcripts encoding oxidases were assigned to Proteobacteria, while cellulases were predominantly assigned to Actinobacteria. Transcripts for hemicellulases and debranching enzymes were primarily assigned to Bacteroidetes and Actinobacteria.
FIG 4.

Relative abundances of transcripts encoding enzymes involved in plant polymer decomposition at different depths in Knudsenheia (Ka, Kb, and Kc) and Solvatn (Sa and Sb). (A) Oxidases that catalyze the degradation of lignin and other phenolic compounds; (B) cellulases that hydrolyze cellulose; (C) endohemicellulases that hydrolyze the core chain of hemicelluloses; (D) debranching enzymes that hydrolyze the side chains of hemicelluloses. Protein family domains were identified by searches in the protein family database Pfam. Each name given for the color code represents a Pfam domain. The whole range of enzymatic functions associated with glycoside hydrolases (GH) and other Pfam domains can be found in the Pfam (http://pfam.sanger.ac.uk/) and CAZy (carbohydrate-active enzymes) (http://www.cazy.org/) databases. Note that some Pfams have overlapping activities and that the grouping of these into categories is based on their main or one of their main functions. Significant differences in the number of transcripts for the categories of polymer decomposition between peat soil depths are indicated as follows: “*” over Kb means that there is a difference between Ka and Kb, “*” over Kc means that there is a difference between Ka and Kc, “(*)” over Kc means that there is a difference between Kb and Kc, and “*” over Sb means that there is a difference between Sa and Sb. P value confidence levels: *, <0.05; **, <0.01; and ***, <0.001.
Analyses of transcripts for pathways of anaerobic respiration indicated that both denitrification and sulfate reduction occurred in these soils (data not shown). However, the relative abundance of transcripts for denitrification decreased with depth in both sites (chi-square contingency table test P value: Ka-Kb, 0.02; Ka-Kc, 2e−8; Kb-Kc, 3e−13; and Sa-Sb, 4e−8), while transcripts for sulfate reduction decreased only in Knudsenheia (chi-square contingency table test P value: Ka-Kb, 0.01; Ka-Kc, 7e−11; Kb-Kc, 0.003; and Sa-Sb, 0.2). The relative abundance of transcripts for fermentative pathways of glycolysis (KEGG pathway: glycolysis/gluconeogenesis) (P value: Ka-Kc, 5e−7, and Kb-Kc, 3e−6), propionate fermentation (KEGG pathway: propanoate metabolism) (P value: Ka-Kc, 4e−12, and Kb-Kc, 2e−10), and ethanol fermentation (EC 1.1.1.1, EC 1.2.1.10, and EC 1.2.1.3) (P value: Ka-Kc, 4e−13; Kb-Kc, 5e−7; and Sa-Sb, 0.02) was consistently lower in Kc than in Ka and Kb, while there were no significant differences between Ka and Kb and between Sa and Sb (with the exception of ethanol fermentation).
There was a significant increase in the relative abundance of archaeal 16S rRNA transcripts with depth (Fig. 5B), from <0.2% of the microbiota in the top layer to ∼7% in the lower layers in Knudsenheia and from <0.1% to ∼3% in Solvatn peat. The majority of the archaeal 16S rRNAs were assigned to known methanogenic taxa, with the family Methanosaetaceae being the overall most abundant (∼10% of Archaea in the top layer and ∼40% in lower layers), followed by Methanosarcinaceae and the orders Methanomicrobiales and Methanobacteriales (50% in the top layer of Knudsenheia) (Fig. 5B). Similarly, at Knudsenheia, the relative abundance of mRNAs assigned to Archaea was low in the top layers and increased with depth, from ∼0.5% (∼1,500 reads) to ∼8% (∼25,000 reads) of all taxonomically assigned mRNAs (Fig. 5A). For the Solvatn site, archaeal mRNA transcripts increased from ∼0.5% (∼1,500 reads) to ∼1.5% (∼3,000 reads). Most mRNAs stemmed from the Methanosaetacaea, followed by Methanosarcinaceae and Methanomicrobiales. A detailed analysis of the transcripts encoding enzymes of methanogenesis pathways showed that all major pathways were present (Fig. 6). In general, the relative abundance of transcripts for all pathways increased with depth. Among these, the transcripts encoding subunits of methyl coenzyme M reductase (methyl-CoM reductase [MCR]; EC 2.8.4.1) were most abundant. Corresponding to the high abundance of Methanosaetaceae identified by 16S rRNA and mRNA annotation, the transcripts for AMP-forming acetate-coenzyme A ligase (EC 6.2.1.1), a key enzyme for acetoclastic methanogenesis by Methanosaetaceae, was the most abundant. In line with this, there was also a high relative abundance of transcripts for the carbon monoxide dehydrogenase, catalyzing the reduction of acetyl-coenzyme A to 5-methyl tetrahydromethanopterin in acetoclastic methanogens. The transcripts encoding enzymes for acetoclastic methanogenesis typical for the Methanosarcinaceae were of low relative abundance (acetate kinase, EC 2.7.2.1, and phosphate acetyltransferase, EC 2.3.1.8). Among the hydrogenotrophic branches of methanogenic pathways, the transcripts for the pathway for methanogenesis from formate were present at the highest relative abundance (key enzyme, formate dehydrogenase, EC 1.2.1.2), while those specific for the reduction of CO2 with reducing power from H2 (ferredoxin hydrogenase, EC 1.12.7.2) were present at a low relative abundance. The transcripts for the remaining steps of hydrogenotrophic methanogenesis, which are common to both H2 and formate metabolism, were present at relative abundances similar to that of formate dehydrogenase. Transcripts related to methylotrophic methanogenesis were at lower relative abundances, with methanol-related transcripts (EC 2.1.1.246) being highest, followed by trimethylamine-related transcripts (EC 2.1.1.250), with transcripts for dimethylamine (EC 2.1.1.249) and monomethylamine (EC 2.1.1.248) at the lowest abundances.
FIG 5.

Archaeal community profiles based on mRNA (A) and SSU rRNA (B) at the different peat depths of Knudsenheia (Ka, Kb, and Kc) and Solvatn (Sa and Sb). Column sizes represent the fraction of sequences assigned to taxa within Archaea at order-level taxonomy or higher. Methanosarcinales was split into the families Methanosarcinaceae and Methanosaetaceae. Those assigned as Methanosarcinales could not be further assigned to family level with the thresholds applied (see Materials and Methods). Other Euryarchaeota, Crenarchaeota, and Thaumarchaeota include orders that made up very small fractions of the total; thus, these were pooled. Other Archaea include sequences belonging to other phyla or could not be assigned to phylum with the thresholds applied. Significant differences in the number of transcripts between peat soil depths are indicated as explained in the Fig. 4 legend.
FIG 6.

Relative abundances of transcripts for key enzymes in methanogenesis (A) and the specific catalytic steps for the enzymes in the different pathways of methanogenesis (B). Red arrows indicate omitted pathway steps. Abbreviations: THMPT, tetrahydromethanopterin (THSPT [S for Sarcina] within Methanosarcinales); CoA, coenzyme A; CoM, coenzyme M. Enzyme categories (EC): 6.2.1.1, acetate-CoA ligase (AMP forming); 2.7.2.1, acetate kinase; 2.3.1.8, phosphate acetyltransferase; 1.2.99.2, carbon monoxide dehydrogenase; 1.2.1.2, formate dehydrogenase; 1.12.7.2, ferredoxin hydrogenase; 1.5.99.9, 5,10-methylene-THMPT dehydrogenase; 1.12.98.1, coenzyme F420 hydrogenase; 1.5.99.11, 5,10-methylene-THMPT reductase; 2.1.1.250, trimethylamine methyltransferase; 2.1.1.249, dimethylamine methyltransferase; 2.1.1.248, monomethylamine methyltransferase; 2.1.1.246, methanol methyltransferase; 2.1.1.86, tetrahydromethanopterin S-methyltransferase; 2.8.4.1, methyl-CoM reductase (CoB-CoM heterodisulfide reductase). Significant differences in the number of transcripts between peat soil depths are indicated as explained in the Fig. 4 legend.
The relative abundance of SSU rRNA assigned to the methane-oxidizing bacteria (MOB) within Methylococcaceae increased with depth (Fig. 7). The majority of these sequences were assigned to Methylobacter, being most similar to the 16S rRNA of Methylobacter tundripaludum (33). Correspondingly, there was also an increase in the relative abundance of mRNA assigned to Methylococcaceae (Fig. 7). The majority of the mRNA transcripts were most similar to homologues encoded in the genome of M. tundripaludum SV96 (34) (see Table S4 in the supplemental material). The transcripts encoding the subunits of the particulate methane monooxygenase (pMMO) were the most abundant, being >5-fold higher than transcripts encoding enzymes for the downstream steps of methane oxidation: methanol, formaldehyde, and formate oxidation (see Table S4). Other methanotrophic taxa, such as the candidate division NC10 (relative abundance < 2e−3) and the Methylocystaceae (<1.5e−4), were observed at lower relative abundances.
FIG 7.
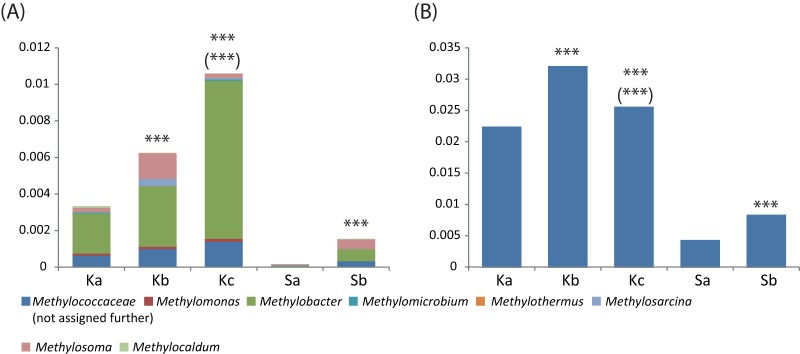
Relative abundances of 16S rRNA sequences (A) and mRNA assigned to methanotrophic taxa (relative to total assigned sequences) (B) at the different depths of Knudsenheia (Ka, Kb, and Kc) and Solvatn (Sa and Sb). Due to the low number of genomes, particularly from Arctic regions, within the Methylococcaceae, mRNA sequence tags were not assigned further to genus level taxonomy. The majority of mRNA was assigned to the genome of Methylobacter tundripaludum SV96 (see Table S4 in the supplemental material for details). Significant differences in the number of transcripts between peat soil depths are indicated as explained in the Fig. 4 legend.
DISCUSSION
A major limitation for the utilization of metatranscriptomics in the study of active microorganisms in the environment is the short half-lives of mRNA molecules (35) and the variations in half-lives between species and different genes (1). Thus, changes in the soil conditions upon sample retrieval might cause a change in the transcript patterns. RNA isolation from soils is particularly challenging due to the inaccessibility of cells located on and within soil particles, inefficient cell lysis, the adsorption of RNA to soil particles, and the presence of RNases (1). In our study, changes in transcript patterns were counteracted by rapid flash-freezing of samples in liquid nitrogen immediately after sampling, while high-efficiency extraction was achieved by grinding the peat soil in liquid nitrogen before NA extraction.
Due to the absence of poly(A) tails in prokaryotic mRNAs, common enrichment strategies mostly rely on the removal of rRNAs (3, 4). Soil contains organisms from all the three domains, Bacteria, Archaea, and Eukarya, making it difficult to synthesize a compatible combination of probes for subtractive hybridization. Eukaryotes have been shown to comprise 10% or more of the rRNA in soil metatranscriptomes (2, 10), stemming from fungi, protists, and metazoa. Therefore, a removal of the eukaryotes is essential to achieve a high fraction of mRNA. Subtractive hybridization using custom-generated probes, constructed only from the bacterial rRNA, was shown to reduce the rRNA fraction to 50 to 60%, leaving 40 to 50% of putative mRNA in marine metatranscriptomes (for an example, see reference 9). This is similar to the kit-based rRNA removal from the high-Arctic peat soils performed in this study, where the rRNA fraction was reduced to 60%, leaving 40% putative mRNA (Km) (Table 1). Thus, the commercial kit-based method was as efficient as the custom probe-based method. This might in part be due to the efficient utilization of two kits with different probe compatibilities with bacterial rRNA and one kit compatible with eukaryotic rRNA, removing the 16S and 23S and the 18S and 28S fractions of the rRNA, respectively (Fig. 1; see also Fig. S1 in the supplemental material). In a polycyclic aromatic carbon-contaminated soil microcosm, mRNA enrichment with MICROBExpress (Ambion) gave a final fraction of putative mRNA at ∼18% (16), less than half that obtained in our mRNA enrichment. MICROBExpress was one of the three kits used with the peat microbiota, and the higher fraction of putative mRNA obtained might be explained by the utilization of two additional kits.
Organic molecules such as humic and tannic acids have been shown to inhibit PCR by affecting the polymerase activity or binding the template, rendering it inaccessible to the enzyme (11, 36). The activities of hydrolytic extracellular enzymes as well as general bacterial activity are inhibited by accumulated phenolic compounds in the anoxic layers of peat soils (13). The cDNA synthesis from the deeper layers in Arctic peat soils was severely inhibited despite the extraction of high-quality RNA and purification of the extracts. To circumvent the inhibition problem, the RNA samples were diluted and linearly amplified after poly(A) tailing. This proved to be an efficient method for generating high RNA yields. Linear amplification is not prone to skewing the relative abundances of different mRNAs, since the templates for the RNA synthesis are cDNA fragments that after initial reverse transcription are present at the same concentration throughout the amplification step. However, the amplification of RNA has been shown to increase the mRNA fraction of the metatranscriptomes (6, 9). It has been suggested that this is due to a preferential polyadenylation of mRNA and an inefficient amplification of molecules with a high degree of secondary structure (6). This was also observed in our study, with the fraction of putative mRNA ranging from 15 to 28%, 2- to 4-fold higher than that observed in previously obtained metatranscriptomes processed from the same soil samples without amplification (putative mRNA, ∼5 to 7%) (10). Compared to the moderate mRNA enrichment during the rRNA removal procedures, the RNA amplification step was particularly powerful and in parallel circumvented the inhibition problems.
Comparison between the gene expression profiles of the mRNA-enriched library and the mRNA fraction of the total RNA in human stool samples has shown that there was little effect on the relative abundance of mRNAs (double-log scatterplot R2 values, 0.91 and 0.94) (8). Also, subtractive hybridization with sample-specific probes had a low impact on the relative abundances of mRNAs (9). In contrast to this, our study showed that the mRNA enrichment had substantial effects on the relative abundances of transcripts within many different protein families. Ideally, the transcripts in an mRNA-enriched library should be a larger subsample of the nonenriched library; however, the differences observed were larger than that obtained between two random samplings from the same set of annotated mRNA sequence tags (e.g., Ka replicate 1 and Ka replicate 2) (Fig. 2A). The difference was also shown to be larger than that observed between the nonenriched libraries from two different peat microbiotas (Ka and Sa). It was not possible to determine the exact cause for the observed skew in relative abundances of transcripts for different Pfams. It was shown that the relative abundances of transcripts for some Pfams were particularly high in Ka relative to Km, while other Pfams were higher in Km. Also, the taxonomic annotation of mRNA indicated that no specific taxonomic lineages were affected by the mRNA enrichment. Rather, the effect was broad as shown by the low R2 value in the double-log scatter plots (Fig. 2A). Thus, it can be speculated that the skew was due to unspecific mRNA degradation during the prolonged sample processing. Considering these limitations and the high-throughput sequencing technologies available, we recommend performing deep sequencing on linearly amplified or nonamplified peat soil metatranscriptomes, leaving out the time-consuming subtractive hybridization steps.
Metatranscriptomics allows for a holistic study of microbial processes in response to environmental changes. Particularly, it enables the study of microbial transcription of genes that are taxonomically diverse and those that encode enzymes involved in complex pathways, including many enzymes with different roles in different organisms. In anoxic peat soils, extracellular degradation of plant polymers and methanogenesis are the initial and last steps in the mineralization of SOC, and both are difficult to study using targeted primer PCR-based methods due to the diversity of organisms and metabolic pathways involved. The partly degraded peat soil matrix contains a mixture of polysaccharides, proteins, and aromatic (e.g., lignin and other phenolic compounds) and aliphatic compounds which differs depending on the vegetation input to the soil (37). The Arctic peat soils studied in this work are characterized by a cover of moss species interspersed by grasses (10). Mosses and grasses contain many similar cell wall polysaccharides, but some are unique to each of them and many are present at different proportions (38). Also, while grasses are rich in lignin, mosses are not, but they contain other types of phenolic compounds (38). The degradation of these compounds is initially catalyzed by extracellular hydrolytic and oxidative enzymes. The vegetation input in these soils is reflected in the relative abundance of transcripts for polymer-degrading enzymes. In particular, the high relative abundance of transcripts for cellulases in the top layers of both Knudsenheia and Solvatn correspond to the high cellulose content in both moss and grass cell walls (38). Also, considering hemicelluloses, the high relative abundance of galactosidases (GH53) and mannanases (GH26) reflects the high fraction of mosses, which are known to contain larger proportions of galactomannans and glucogalactomannans than grasses (38). Interestingly, the decreased relative abundance of cellulase transcripts and increase in transcripts for the degradation of highly branched hemicelluloses indicate that the SOC in deeper peat layers contained less cellulose. Thus, it appears that the microbiota metabolism had shifted toward degradation of highly branched hemicelluloses containing fucose, arabinose, and rhamnose. These are known as fucoside xyloglucans, heteroxylans, and rhamnogalacturonans and are more common in grasses than mosses (38), indicating that these parts of the grass cell walls are particularly recalcitrant to decomposition and/or that the contribution of grasses to peat accumulation has been higher in the past. Extracellular hydrolytic degradation of polysaccharides has been considered a potential rate-limiting step in SOC mineralization (13, 39). Therefore, the characterization of changes in microbial transcription patterns might help to identify the specific compounds that make up the substrates for limiting steps in decomposition in different peat deposits and the dynamics of their decomposition. Genes encoding plant polymer-degrading enzymes are found in the genomes of members of a broad range of bacterial phyla (40, 41). Thus, it has been difficult to investigate which members of a given bacterial community are involved in the decomposition of plant polymers and the dynamics of these particular communities. Taxonomic annotation of transcripts encoding extracellular enzymes has allowed us to investigate these microbial taxa, showing that many different phyla are involved in polymer decomposition. However, Bacteroidetes seemed to be particularly important in the decomposition of branched hemicelluloses, Actinobacteria in cellulose and hemicellulose degradation, and Proteobacteria in the degradation of phenolic compounds.
Most major groups of methanogens in the Svalbard peat soils have been observed earlier, including Methanomicrobiales, Methanobacteriales, Methanosaetaceae, and Methanosarcinales (10, 42). Correspondingly, all these groups were identified in this study (Fig. 5). Several studies have shown that methanogenic communities switch from hydrogenotrophic to acetoclastic methanogenesis with peat depth (43–45), while others have shown that the proportion of hydrogenotrophic methanogenesis increased with depth (46). Our results indicate that acetoclastic methanogens were both more abundant and more active in the deeper layers, while hydrogenotrophs were more abundant in the top layers. However, mRNA analysis showed that genes for a broad range of methanogenic pathways were transcribed, including methanogenesis from formate, methanol, and methylamines in addition to acetate. Particularly, transcripts for methanogenesis from acetate and formate were abundant in the deeper layers. It has been shown that at low temperature, acetoclastic methanogenesis predominates, possibly due to the activity of homoacetogenic bacteria (39, 47–49). This might also be the case for these peats, as the relative abundance of transcripts for methanogenesis from H2/CO2 were low compared to those for methanogenesis from acetate and formate. However, whether this is due to homoacetogenic competition for H2 or to formate and acetate being major fermentation products while H2 is not was not clear from our results. While pathways of methanogenesis from methanol and methylamines have received little attention in earlier studies, our results indicated that these pathways might be important for methanogenesis in the Arctic peat soils.
Bacteria closely related to M. tundripaludum were the most abundant MOB at both Knudsenheia and Solvatn at all peat depths, similar to previous studies (10). The increase in relative abundances of 16S rRNA and mRNA of M. tundripaludum with depth indicated that this species has means of coping with anoxic conditions, enabling the cells to sustain a high number of ribosomes and mRNA. However, whether this is due to an anaerobic energy metabolism involving methane oxidation utilizing pMMO and intracellularly produced O2 (50), alternative energy metabolism (51–53), or an ability to survive longer periods of starvation is not evident from the current data set.
Conclusion.
The utilization of metatranscriptomics has been limited in part due to the difficulties associated with generating high-quality cDNA from the total RNA extracted from the peat soils. In this paper, we have described the generation of metatranscriptomes from soil samples with inhibitory components. We have tested the application of kit-based mRNA enrichment on complex peat soil ecosystems, finding that the introduced bias outweighs the advantages of this approach. Particularly in poorly studied ecosystems, it can be of advantage to simultaneously obtain broad information about present and active organisms (derived from rRNA) in addition to the transcript profile (derived from mRNA). We have demonstrated the analysis of such data sets and how these holistic community system analyses can provide new knowledge about microbial activities in peat soils, ecosystems important to the global carbon cycle. In particular, the transcript patterns reveal the gradual shift from aerobic to anaerobic microbiotas and metabolisms in the deeper peat layers, corresponding to a transition from CO2- to CH4-dominated greenhouse gas emissions with depth.
Supplementary Material
ACKNOWLEDGMENTS
We thank Peter Frenzel, Vigdis Torsvik, and Ricardo Alves for important contributions during the fieldwork in Ny-Ålesund, Svalbard. The sequencing service was provided by the Norwegian High-Throughput Sequencing Centre (http://www.sequencing.uio.no).
This work was funded through The Research Council of Norway, grant 191696/V49.
Footnotes
Published ahead of print 11 July 2014
Supplemental material for this article may be found at http://dx.doi.org/10.1128/AEM.01030-14.
REFERENCES
- 1.Carvalhais LC, Dennis PG, Tyson GW, Schenk PM. 2012. Application of metatranscriptomics to soil environments. J. Microbiol. Methods 91:246–251. 10.1016/j.mimet.2012.08.011 [DOI] [PubMed] [Google Scholar]
- 2.Urich T, Lanzen A, Qi J, Huson DH, Schleper C, Schuster SC. 2008. Simultaneous assessment of soil microbial community structure and function through analysis of the meta-transcriptome. PLoS One 3:e2527. 10.1371/journal.pone.0002527 [DOI] [PMC free article] [PubMed] [Google Scholar]
- 3.He S, Wurtzel O, Singh K, Froula JL, Yilmaz S, Tringe SG, Wang Z, Chen F, Lindquist EA, Sorek R, Hugenholtz P. 2010. Validation of two ribosomal RNA removal methods for microbial metatranscriptomics. Nat. Methods 7:807–812. 10.1038/nmeth.1507 [DOI] [PubMed] [Google Scholar]
- 4.Sorek R, Cossart P. 2010. Prokaryotic transcriptomics: a new view on regulation, physiology and pathogenicity. Nat. Rev. Genet. 11:9–16. 10.1038/nrg2695 [DOI] [PubMed] [Google Scholar]
- 5.Yi H, Cho Y-J, Won S, Lee J-E, Yu HJ, Kim S, Schroth GP, Luo S, Chun J. 2011. Duplex-specific nuclease efficiently removes rRNA for prokaryotic RNA-seq. Nucleic Acids Res. 39:e140. 10.1093/nar/gkr617 [DOI] [PMC free article] [PubMed] [Google Scholar]
- 6.Frias-Lopez J, Shi Y, Tyson GW, Coleman ML, Schuster SC, Chisholm SW, DeLong EF. 2008. Microbial community gene expression in ocean surface waters. Proc. Natl. Acad. Sci. U. S. A. 105:3805–3810. 10.1073/pnas.0708897105 [DOI] [PMC free article] [PubMed] [Google Scholar]
- 7.Gifford SM, Sharma S, Rinta-Kanto JM, Moran MA. 2011. Quantitative analysis of a deeply sequenced marine microbial metatranscriptome. ISME J. 5:461–472. 10.1038/ismej.2010.141 [DOI] [PMC free article] [PubMed] [Google Scholar]
- 8.Giannoukos G, Ciulla DM, Huang K, Haas BJ, Izard J, Levin JZ, Livny J, Earl AM, Gevers D, Ward DV, Nusbaum C, Birren BW, Gnirke A. 2012. Efficient and robust RNA-seq process for cultured bacteria and complex community transcriptomes. Genome Biol. 13:r23. 10.1186/gb-2012-13-3-r23 [DOI] [PMC free article] [PubMed] [Google Scholar]
- 9.Stewart FJ, Ottesen EA, DeLong EF. 2010. Development and quantitative analyses of a universal rRNA-subtraction protocol for microbial metatranscriptomics. ISME J. 4:896–907. 10.1038/ismej.2010.18 [DOI] [PubMed] [Google Scholar]
- 10.Tveit A, Schwacke R, Svenning MM, Urich T. 2013. Organic carbon transformations in high-Arctic peat soils: key functions and microorganisms. ISME J. 7:299–311. 10.1038/ismej.2012.99 [DOI] [PMC free article] [PubMed] [Google Scholar]
- 11.Arbeli Z, Fuentes CL. 2007. Improved purification and PCR amplification of DNA from environmental samples. FEMS Microbiol. Lett. 272:269–275. 10.1111/j.1574-6968.2007.00764.x [DOI] [PubMed] [Google Scholar]
- 12.Freeman C, Ostle N, Kang H. 2001. An enzymic ‘latch' on a global carbon store—a shortage of oxygen locks up carbon in peatlands by restraining a single enzyme. Nature 409:149. 10.1038/35051650 [DOI] [PubMed] [Google Scholar]
- 13.Fenner N, Freeman C. 2011. Drought-induced carbon loss in peatlands. Nat. Geosci. 4:895–900. 10.1038/ngeo1323 [DOI] [Google Scholar]
- 14.Bailly J, Fraissinet-Tachet L, Verner MC, Debaud JC, Lemaire M, Wesolowski-Louvel M, Marmeisse R. 2007. Soil eukaryotic functional diversity, a metatranscriptomic approach. ISME J. 1:632–642. 10.1038/ismej.2007.68 [DOI] [PubMed] [Google Scholar]
- 15.Damon C, Lehembre F, Oger-Desfeux C, Luis P, Ranger J, Fraissinet-Tachet L, Marmeisse R. 2012. Metatranscriptomics reveals the diversity of genes expressed by eukaryotes in forest soils. PLoS One 7:e28967. 10.1371/journal.pone.0028967 [DOI] [PMC free article] [PubMed] [Google Scholar]
- 16.de Menezes A, Clipson N, Doyle E. 2012. Comparative metatranscriptomics reveals widespread community responses during phenanthrene degradation in soil. Environ. Microbiol. 14:2577–2588. 10.1111/j.1462-2920.2012.02781.x [DOI] [PubMed] [Google Scholar]
- 17.Schink B. 1997. Energetics of syntrophic cooperation in methanogenic degradation. Microbiol. Mol. Biol. Rev. 61:262–280 [DOI] [PMC free article] [PubMed] [Google Scholar]
- 18.Schink B, Stams AM. 2013. Syntrophism among prokaryotes, p 471–493 In Rosenberg E, DeLong E, Lory S, Stackebrandt E, Thompson F. (ed), The prokaryotes. Springer, Berlin, Germany [Google Scholar]
- 19.Whitman WB, Bowen TL, Boone DR. 2006. The methanogenic bacteria, p 165–207 In Dworkin M, Falkow S, Rosenberg E, Schleifer KH, Stackebrandt E. (ed), The prokaryotes, 3rd ed, vol 2 Springer, New York, NY [Google Scholar]
- 20.Bowman J. 2006. The methanotrophs—the families Methylococcaceae and Methylocystaceae, p 266–289 In Dworkin M, Falkow S, Rosenberg E, Schleifer K-H, Stackebrandt E. (ed), The prokaryotes, 3rd ed, vol 2 Springer, New York, NY [Google Scholar]
- 21.Dunfield PF, Yuryev A, Senin P, Smirnova AV, Stott MB, Hou S, Ly B, Saw JH, Zhou Z, Ren Y, Wang J, Mountain BW, Crowe MA, Weatherby TM, Bodelier PL, Liesack W, Feng L, Wang L, Alam M. 2007. Methane oxidation by an extremely acidophilic bacterium of the phylum Verrucomicrobia. Nature 450:879–882. 10.1038/nature06411 [DOI] [PubMed] [Google Scholar]
- 22.Wartiainen I, Hestnes AG, Svenning MM. 2003. Methanotrophic diversity in high arctic wetlands on the islands of Svalbard (Norway)—denaturing gradient gel electrophoresis analysis of soil DNA and enrichment cultures. Can. J. Microbiol. 49:602–612. 10.1139/w03-080 [DOI] [PubMed] [Google Scholar]
- 23.Liebner S, Rublack K, Stuehrmann T, Wagner D. 2009. Diversity of aerobic methanotrophic bacteria in a permafrost active layer soil of the Lena Delta, Siberia. Microb. Ecol. 57:25–35. 10.1007/s00248-008-9411-x [DOI] [PubMed] [Google Scholar]
- 24.Smemo KA, Yavitt JB. 2007. Evidence for anaerobic CH4 oxidation in freshwater peatlands. Geomicrobiol. J. 24:583–597. 10.1080/01490450701672083 [DOI] [Google Scholar]
- 25.Masella AP, Bartram AK, Truszkowski JM, Brown DG, Neufeld JD. 2012. PANDAseq: PAired-eND Assembler for Illumina sequences. BMC Bioinformatics 13:31. 10.1186/1471-2105-13-31 [DOI] [PMC free article] [PubMed] [Google Scholar]
- 26.Schmieder R, Edwards R. 2011. Quality control and preprocessing of metagenomic datasets. Bioinformatics 27:863–864. 10.1093/bioinformatics/btr026 [DOI] [PMC free article] [PubMed] [Google Scholar]
- 27.Altschul SF, Madden TL, Schaffer AA, Zhang JH, Zhang Z, Miller W, Lipman DJ. 1997. Gapped BLAST and PSI-BLAST: a new generation of protein database search programs. Nucleic Acids Res. 25:3389–3402. 10.1093/nar/25.17.3389 [DOI] [PMC free article] [PubMed] [Google Scholar]
- 28.Lanzén A, Jørgensen SL, Huson DH, Gorfer M, Grindhaug SH, Jonassen I, Øvreås L, Urich T. 2012. CREST—classification resources for environmental sequence tags. PLoS One 7:e49334. 10.1371/journal.pone.0049334 [DOI] [PMC free article] [PubMed] [Google Scholar]
- 29.Mitra S, Rupek P, Richter D, Urich T, Gilbert J, Meyer F, Wilke A, Huson D. 2011. Functional analysis of metagenomes and metatranscriptomes using SEED and KEGG. BMC Bioinformatics 12:S21. 10.1186/1471-2105-12-S1-S21 [DOI] [PMC free article] [PubMed] [Google Scholar]
- 30.R Development Core Team. 2009. R: a language and environment for statistical computing. R Foundation for Statistical Computing, Vienna, Austria [Google Scholar]
- 31.Greenacre M. 2010. Biplots in practice, p 79–88 Fundación BBVA, Bilbao, Spain. http://www.multivariatestatistics.org/biplots.html [Google Scholar]
- 32.Greenacre M. 2007. Computation of correspondence analysis, p 213–259 In Keiding N, Morgan B, Speed T, van der Heijden P. (ed), Correspondence analysis in practice, 2nd ed. Chapman and Hall/CRC, Boca Raton, FL [Google Scholar]
- 33.Wartiainen I, Hestnes AG, McDonald IR, Svenning MM. 2006. Methylobacter tundripaludum sp. nov., a methane-oxidizing bacterium from Arctic wetland soil on the Svalbard islands, Norway (78 degrees N). Int. J. Syst. Evol. Microbiol. 56:109–113. 10.1099/ijs.0.63728-0 [DOI] [PubMed] [Google Scholar]
- 34.Svenning MM, Hestnes AG, Wartiainen I, Stein LY, Klotz MG, Kalyuzhnaya MG, Spang A, Bringel F, Vuilleumier S, Lajus A, Medigue C, Bruce DC, Cheng JF, Goodwin L, Ivanova N, Han J, Han CS, Hauser L, Held B, Land ML, Lapidus A, Lucas S, Nolan M, Pitluck S, Woyke T. 2011. Genome sequence of the Arctic methanotroph Methylobacter tundripaludum SV96. J. Bacteriol. 193:6418–6419. 10.1128/JB.05380-11 [DOI] [PMC free article] [PubMed] [Google Scholar]
- 35.Deutscher MP. 2006. Degradation of RNA in bacteria: comparison of mRNA and stable RNA. Nucleic Acids Res. 34:659–666. 10.1093/nar/gkj472 [DOI] [PMC free article] [PubMed] [Google Scholar]
- 36.Opel KL, Chung D, McCord BR. 2010. A study of PCR inhibition mechanisms using real time PCR. J. Forensic Sci. 55:25–33. 10.1111/j.1556-4029.2009.01245.x [DOI] [PubMed] [Google Scholar]
- 37.Kögel-Knabner I. 2000. Analytical approaches for characterizing soil organic matter. Org. Geochem. 31:609–625. 10.1016/S0146-6380(00)00042-5 [DOI] [Google Scholar]
- 38.Sarkar P, Bosneaga E, Auer M. 2009. Plant cell walls throughout evolution: towards a molecular understanding of their design principles. J. Exp. Bot. 60:3615–3635. 10.1093/jxb/erp245 [DOI] [PubMed] [Google Scholar]
- 39.Kotsyurbenko OR. 2005. Trophic interactions in the methanogenic microbial community of low-temperature terrestrial ecosystems. FEMS Microbiol. Ecol. 53:3–13. 10.1016/j.femsec.2004.12.009 [DOI] [PubMed] [Google Scholar]
- 40.Berlemont R, Martiny AC. 2013. Phylogenetic distribution of potential cellulases in bacteria. Appl. Environ. Microbiol. 79:1545–1554. 10.1128/AEM.03305-12 [DOI] [PMC free article] [PubMed] [Google Scholar]
- 41.Cantarel BL, Coutinho PM, Rancurel C, Bernard T, Lombard V, Henrissat B. 2009. The Carbohydrate-Active EnZymes database (CAZy): an expert resource for glycogenomics. Nucleic Acids Res. 37:D233–D238. 10.1093/nar/gkn663 [DOI] [PMC free article] [PubMed] [Google Scholar]
- 42.Høj L, Olsen RA, Torsvik VL. 2005. Archaeal communities in High Arctic wetlands at Spitsbergen, Norway (78°N) as characterized by 16S rRNA gene fingerprinting. FEMS Microbiol. Ecol. 53:89–101. 10.1016/j.femsec.2005.01.004 [DOI] [PubMed] [Google Scholar]
- 43.Cadillo-Quiroz H, Brauer S, Yashiro E, Sun C, Yavitt J, Zinder S. 2006. Vertical profiles of methanogenesis and methanogens in two contrasting acidic peatlands in central New York State, U. S. A. Environ. Microbiol. 8:1428–1440. 10.1111/j.1462-2920.2006.01036.x [DOI] [PubMed] [Google Scholar]
- 44.Galand PE, Saarnio S, Fritze H, Yrjala K. 2002. Depth related diversity of methanogen Archaea in Finnish oligotrophic fen. FEMS Microbiol. Ecol. 42:441–449. 10.1111/j.1574-6941.2002.tb01033.x [DOI] [PubMed] [Google Scholar]
- 45.Merilä P, Galand PE, Fritze H, Tuittila ES, Kukko-oja K, Laine J, Yrjala K. 2006. Methanogen communities along a primary succession transect of mire ecosystems. FEMS Microbiol. Ecol. 55:221–229. 10.1111/j.1574-6941.2005.00030.x [DOI] [PubMed] [Google Scholar]
- 46.Kotsyurbenko OR, Chin KJ, Glagolev MV, Stubner S, Simankova MV, Nozhevnikova AN, Conrad R. 2004. Acetoclastic and hydrogenotrophic methane production and methanogenic populations in an acidic West-Siberian peat bog. Environ. Microbiol. 6:1159–1173. 10.1111/j.1462-2920.2004.00634.x [DOI] [PubMed] [Google Scholar]
- 47.Schulz S, Matsuyama H, Conrad R. 1997. Temperature dependence of methane production from different precursors in a profundal sediment (Lake Constance). FEMS Microbiol. Ecol. 22:207–213. 10.1111/j.1574-6941.1997.tb00372.x [DOI] [Google Scholar]
- 48.Schulz S, Conrad R. 1996. Influence of temperature on pathways to methane production in the permanently cold profundal sediment of Lake Constance. FEMS Microbiol. Ecol. 20:1–14. 10.1111/j.1574-6941.1996.tb00299.x [DOI] [Google Scholar]
- 49.Fey A, Conrad R. 2000. Effect of temperature on carbon and electron flow and on the archaeal community in methanogenic rice field soil. Appl. Environ. Microbiol. 66:4790–4797. 10.1128/AEM.66.11.4790-4797.2000 [DOI] [PMC free article] [PubMed] [Google Scholar]
- 50.Ettwig KF, Butler MK, Le Paslier D, Pelletier E, Mangenot S, Kuypers MMM, Schreiber F, Dutilh BE, Zedelius J, de Beer D, Gloerich J, Wessels H, van Alen T, Luesken F, Wu ML, van de Pas-Schoonen KT, den Camp H, Janssen-Megens EM, Francoijs KJ, Stunnenberg H, Weissenbach J, Jetten MSM, Strous M. 2010. Nitrite-driven anaerobic methane oxidation by oxygenic bacteria. Nature 464:543–548. 10.1038/nature08883 [DOI] [PubMed] [Google Scholar]
- 51.Smemo KA, Yavitt JB. 2010. Anaerobic oxidation of methane: an underappreciated aspect of methane cycling in peatland ecosystems? Biogeosciences 7:7945–7983. 10.5194/bgd-7-7945-2010 [DOI] [Google Scholar]
- 52.Kalyuzhnaya MG, Yang S, Rozova ON, Smalley NE, Clubb J, Lamb A, Gowda GA Nagana, Raftery D, Fu Y, Bringel F, Vuilleumier S, Beck DAC, Trotsenko YA, Khmelenina VN, Lidstrom ME. 2013. Highly efficient methane biocatalysis revealed in a methanotrophic bacterium. Nat. Commun. 4:2785. 10.1038/ncomms3785 [DOI] [PubMed] [Google Scholar]
- 53.Roslev P, King GM. 1995. Aerobic and anaerobic starvation metabolism in methanotrophic bacteria. Appl. Environ. Microbiol. 61:1563–1570 [DOI] [PMC free article] [PubMed] [Google Scholar]
Associated Data
This section collects any data citations, data availability statements, or supplementary materials included in this article.