

Abstract
The mechanisms and rates of mercury methylation in the Florida Everglades are of great concern because of potential adverse impacts on human and wildlife health through mercury accumulation in aquatic food webs. We developed a new PCR primer set targeting hgcA, a gene encoding a corrinoid protein essential for Hg methylation across broad phylogenetic boundaries, and used this primer set to study the distribution of hgcA sequences in soils collected from three sites along a gradient in sulfate and nutrient concentrations in the northern Everglades. The sequences obtained were distributed in diverse phyla, including Proteobacteria, Chloroflexi, Firmicutes, and Methanomicrobia; however, hgcA clone libraries from all sites were dominated by sequences clustering within the order Syntrophobacterales of the Deltaproteobacteria (49 to 65% of total sequences). dsrB mRNA sequences, representing active sulfate-reducing prokaryotes at the time of sampling, obtained from these sites were also dominated by Syntrophobacterales (75 to 89%). Laboratory incubations with soils taken from the site low in sulfate concentrations also suggested that Hg methylation activities were primarily mediated by members of the order Syntrophobacterales, with some contribution by methanogens, Chloroflexi, iron-reducing Geobacter, and non-sulfate-reducing Firmicutes inhabiting the sites. This suggests that prokaryotes distributed within clades defined by syntrophs are the predominant group controlling methylation of Hg in low-sulfate areas of the Everglades. Any strategy for managing mercury methylation in the Everglades should consider that net mercury methylation is not limited to the action of sulfate reduction.
INTRODUCTION
The remnant Everglades is a large (971,548 ha) freshwater marsh (1) located at the southern tip of the United States of America state of Florida and which provides many ecosystem services (habitat, fishing, and esthetics). However, it is subject to significant amounts of atmospheric deposition of inorganic mercury (2), which may be biologically transformed to the more toxic methylmercury (CH3Hg+, MeHg). Bioaccumulation of methylmercury in the Everglades is of great concern because of its impacts on wildlife (3) and potential impacts on human health (4, 5).
Considerable recent research has been devoted to the identification of the complex geochemical interactions that control the availability of Hg2+ for uptake by methylating prokaryotes (6, 7); however, limited work has been conducted to identify the dominant phylogenetic groups responsible for methylation in the Everglades (8). Specific knowledge of the dominant mercury methylators would provide valuable information on their physiologies and ecologies, thereby providing additional insight into the specific controls on mercury methylation in this ecosystem. The dominant methylators of mercury in the Everglades are generally considered to be sulfate-reducing prokaryotes (SuRP) (9), although recent work indicated that diverse groups of prokaryotes may also contribute to mercury methylation in other anaerobic environments (10, 11) and in low-sulfate regions of the Everglades (8). In addition, it should be noted that not all SuRP are capable of mercury methylation, nor are all mercury-methylating SuRP equally efficient at methylating mercury (11, 12).
The Water Conservation Areas (WCAs) of the northern Everglades (see Fig. S1 in the supplemental material) are subject to runoff from the Everglades Agricultural Area (EAA), and gradients in both phosphorus (1, 13–15) and sulfate (SO42−) (16, 17) concentrations have been well documented for the soils and waters of these wetlands. The distribution of numbers of SuRP is a function of SO42− and phosphorus concentrations. For example, greater SuRP numbers were observed in areas of WCA-2A with higher SO42− concentrations than in the lower-SO42− regions (18, 19). However, the numbers of SuRP and concentrations of SO42− do not correspond directly with potential mercury methylation rates; at least some of this variability has been attributed to the formation of insoluble precipitates by sulfide with Hg2+ in soils with relatively high rates of SO42− reduction (20).
In addition to complex geochemical factors that control the availabilities of Hg2+ for uptake by methylating organisms (6), the physiologies of mercury-methylating SuRP are as complex and varied, such that their distribution and methylating activities in the environment may be difficult to predict. The SuRP are distributed among diverse phylogenetic groups, including Deltaproteobacteria, Firmicutes, and Archaea (21). Not surprisingly, they also exhibit highly diverse metabolisms and include those that are capable of syntrophic fermentation of simple organic acids in the absence of SO42− as the terminal electron acceptor (22, 23). The gene encoding a component of dissimilatory (bi)sulfite reductase (DSR; EC 1.8.99.1), dsrB, is common among all known SuRP and tracks their phylogeny well (24). The distribution of dsrB phylotypes in the Everglades is strongly dependent on SO42− concentrations, indicating that the physiologies of the dominant SuRP differ along SO42− concentration gradients in the WCAs (19). It is not known at this time, however, how mercury-methylating SuRP are distributed along these SO42− gradients.
Recently, Parks et al. (10) reported that the genes hgcA and hgcB are required for mercury methylation in a phylogenetically diverse group of microorganisms. hgcA and hgcB encode a corrinoid protein and a ferredoxin that are responsible for transferring methyl carbanions to Hg2+ and reducing the corrinoid cofactor, respectively (25). All strains that carry hgcAB and have been studied in pure cultures to date methylate mercury. These include various taxa in the Firmicutes, Chloroflexi, and Methanomicrobia (11, 26), in addition to certain SuRP. The number of hgcA sequences available in GenBank is limited at this time; however, the hgcA phylogeny of known strains tends to track 16S rRNA gene phylogeny well (11, 26), such that hgcA sequences can provide taxonomic information on the host organism. With the newly reported genomic information, Schaefer et al. (8) designed a novel PCR primer set targeting hgcA and reported the sequence diversity of that gene in soils of the southern Everglades and a wetland in Sweden.
The primary objectives of this study were to investigate the distribution of hgcA and dsrB along gradients in SO42− concentrations in the WCAs of the northern Everglades and to investigate the relationships between hgcA and dsrB phylotypes and mercury methylation in laboratory microcosms employing specific metabolic inhibitors that target SuRP and methanogens. As part of this study, a new PCR primer set targeting hgcA was developed. This study provides important information on the diversity of prokaryotes responsible for mercury methylation in the Everglades, which, in turn, provides insight into potential management strategies to limit methylation.
MATERIALS AND METHODS
Sampling and processing.
Triplicates of soil cores were collected from sites F1 (35.3°26′21″N, 12.2°80′22″W) and U3 (16.3°26′17″N, 40.2°80′24″W) of WCA-2A on 23 August 2012. Another set of 15 soil cores were taken at site W3 of WCA-3A (26°02′35.16″N, 80°49′38.72″W) on 30 April 2013. The top 5 cm of soil from each core was composited and mixed in a polyethylene ziplock bag. Three subsamples (50 to 100 g) of the composited soil were immediately frozen by dry ice and ethanol for transport to the laboratory, where it was stored at −80°C until isolation of nucleic acids. The remaining unfrozen soil was placed on ice and transported to the laboratory on the same date of sampling and stored at 4°C for geochemical analysis and the incubation study (WCA-3A soils only).
In addition to the soils sampled at W3, 115 liters of surface water was collected in precleaned (10% each nitric and hydrochloric acids) carboys. This water served as the source water for the incubation study. Pore waters from F1 and U3 were collected and stored as described by Holmes et al. (27).
Primer design for hgcAB.
The hgcAB sequences of 50 known strains were retrieved from databases in NCBI (http://www.ncbi.nlm.nih.gov) and JGI IMG/ER (https://img.jgi.doe.gov). Degenerate primers were designed based on the highly conserved nucleotide sequences in the alignments of each gene: forward primer, hgcA_F (5′-GGN RTY AAY RTN TGG TGY GC-3′); reverse primer, hgcB_R (5′-CAD GCN CCR CAY TCV ATR CA-3′). The forward primer targets the conserved region at the cap-helix motif G(V/I) N(V/I)WCA(A/G)GK of hgcA (nucleotides corresponding to the underlined amino acid sequences), while the reverse primer targets the [4Fe-4S] motifs region (CX2CX2CX3C) of hgcB (see Fig. S2 in the supplemental material), which corresponds with the 148- to 180-nucleotide sequences of Desulfovibrio desulfuricans ND132. These primer sequences are matched with the target region of all strains in the alignments, with one base pair mismatch observed in 5 strains out of 50 for the forward primer and in 2 strains out of 50 for the reverse primer (see Table S1 in the supplemental material). The target region includes 732 to 780 bp of hgcA, of which total sequence sizes vary from 924 to 973 bp dependent on species, and 156 to 165 bp of hgcB (total length ranging from 216 to 372 bp). The expected amplicon ranges in size from 888 to 945 bp.
PCR, cloning, and sequence analysis.
DNA was isolated from 0.2 g of soil (wet weight) using a PowerSoil DNA isolation kit (MoBio Laboratories, Carlsbad, CA). The mRNA was isolated from 2 g of soil using a MoBio PowerSoil total mRNA isolation kit. The cDNA was constructed from the isolated mRNA using SuperScript III first-strand synthesis supermix (Invitrogen, Carlsbad, CA).
dsrB [encoding the β-subunit of dissimilatory (bi)sulfite reductase] sequences were amplified from the cDNAs using primers DSRp2060F/DSR4R in an iQ supermix (Bio-Rad Laboratories, Hercules, CA) with an iCycler iQ (Bio-Rad) thermal cycler under the PCR conditions described by Foti et al. (28).
hgcAB sequences were amplified from soil DNA using primers hgc_F/hgcB_R with the following cycling conditions: an initial denaturation step at 94°C for 5 min and 6 cycles of touchdown steps at 94°C for 30 s and 60°C for 30 s, decreasing 1°C per each cycle, and 72°C for 1 min, followed by 30 cycles at 94°C for 30 s, 55°C for 30 s, and 72°C for 1 min and a final extension at 72°C for 5 min.
The PCR products were purified by a QIAquick gel extraction kit (Qiagen, Valencia, CA) to remove sear bands and primer dimers and then cloned using TOPO TA cloning kit for sequencing (Invitrogen, Carlsbad, CA) and electroporated into competent Escherichia coli TOP10 Electrocomp in the kit. The transformed cell clones were randomly selected in a Luria-Bertani (LB) agar plate containing kanamycin (50 μg ml−1) and submitted to the University of Florida Sequencing Core Laboratory (http://www.biotech.ufl.edu/) for sequencing the target insert fragments.
The (c)DNA sequences were aligned using Clustal X v.2.0 (29) and translated in silico into amino acid sequences and edited in BioEdit v7.1.3 (30). From the hgcAB sequences, only the segments aligning with hgcA were used for further sequence analysis; hgcB sequences were excluded from analysis because only a small segment (≤165 DNA sequences) was targeted by the primers, many of which yielded a weak signal during the one-direction sequencing that initiated from hgcA. The sequences were placed into operational taxonomic units (OTUs) depending on difference of the deduced amino acids via the Furthest Neighbor option in Mothur v.1.32.1 (31). The phylogeny of representative OTUs was analyzed using a maximum likelihood method in MEGA version 5.2.1 (32) with bootstrap analysis (1,000 reassemblages). OTU richness, diversity, and library coverages were calculated in Mothur. Fast UniFrac (33) was used for UniFrac significance test (34), P-test (35), and a principal coordinate analysis (PCoA) to see if the difference between two gene communities is significant.
RT-qPCR.
Reverse transcription–real-time PCR (RT-qPCR) was performed using Bio-Rad iQ SYBR green supermix in a StepOnePlus real-time PCR system (Applied Biosystems, Foster City, CA) for enumeration of the transcripts of dsrB and mcrA (encoding a methyl coenzyme M reductase of methanogens) in the soils incubated for 14 days for the production of MeHg in the presence of various inhibitors (see below). The cycling parameters for amplification of dsrB were similar to that described above. The PCR cycling parameters for the different groups of mcrA were similar to those described by Steinberg and Regan (36).
All RT-qPCR amplifications included an image capture step (15 s at 80°C) after a final extension step of each cycle, as well as a melt curve analysis (increasing the temperature from 60 to 95°C in 0.5°C increments every 10 s) when the PCR amplification was completed. All sample DNAs and standard DNAs were analyzed in triplicate. For every PCR run, the standard plasmid DNA carrying the gene fragment of interest was included in the 96-well PCR plate. A plasmid DNA from the clone libraries was used for standard DNA. The insertion of the correct gene fragments in the standard plasmid DNA was confirmed by their sequences. A standard curve was constructed by plotting the relative fluorescent units at a threshold fluorescence value (CT) versus the logarithm of copy number of the standard plasmid DNAs. The PCR efficiency (E) was calculated from the slope of the standard curve by using the formula E = 10−1/slope−1 (37). PCR efficiencies observed in the RT-qPCR for dsrB and mcrA ranged from 93 to 96%.
Soil incubation studies.
Soils from the low-SO42− region of WCA-3A (see Fig. S1 in the supplemental material) were used for the incubation study. One hundred grams of wet soil was initially slurried with 900 ml of site water in a 1.2-liter borosilicate incubation vessel to render homogeneous the added water with the soil; no further soil resuspension occurred throughout the 14-day incubation period. The water column of each vessel was gently purged with 0.03% (vol/vol) CO2 in N2 for 2 h daily to ensure that anoxia would be maintained within the soil during the incubation. Purging also poised the aqueous pH close to the in situ pH of 7.37 and provided a gentle agitation of the water column that mimicked the low advective and dispersive mixing under in situ conditions. Triplicate vessels were supplemented with either sodium molybdate (MoO42−; 20 mM), bromoethanesulfonate (BES; 50 mM), or both inhibitors. Molybdate and BES inhibit SuRP and methanogens, respectively (38). Each treatment was supplemented with Hg2+ (139 ng liter−1) as HgCl2 and SO42− (4.5 mg liter−1) as Na2SO4. Two types of controls were used for this incubation study: one with no addition of SO42− or inhibitor (CT-I) and the other with SO42− but no inhibitor (CT-II). The two control groups contained added Hg2+ at the same concentration (139 ng liter−1) as in the inhibitor-treated vessels. The vessels were incubated at room temperature (22.5 to 25.5°C) in the dark. Overlying water samples were collected on days 0, 7, and 14 of incubation.
Analytical methods.
The dissolved (passed through a 0.45-μm-pore-size cellulose nitrate filter) MeHg and total Hg (THg) concentrations were analyzed according to EPA Methods 1630 and 1631, respectively (39, 40). Sulfate was analyzed on a Dionex ICS-1000 ion chromatograph according to SM4110 B (41) after filtering of the sample through a 0.45-μm polyether sulfone filter. Dissolved iron (Fe) was determined using a modified bathophenanthroline procedure (42). Soil P (0 to 5 cm) was analyzed using a wet digestion procedure (43) following measurement of soluble reactive P in the digestate by EPA Method 365.2 (44).
Nucleotide sequence accession numbers.
The GenBank accession numbers for sequences determined in this study are KJ499195 to KJ499431 for dsrB and KJ580624 to KJ580833 for hgcAB sequences.
RESULTS
Site descriptions and geochemical characteristics.
Sites F1 and U3 are located within WCA-2A of the northern Everglades (see Fig. S1 in the supplemental material), which is characterized by a well-documented gradient in soil P concentrations due to discharge of nutrient-rich drainage from EAA (15). The soil P concentrations in the F1 and U3 samples used in this study were 1,278 mg kg−1 and 275 mg kg−1, respectively, and are similar to those reported by Castro et al. (19, 45). Unlike aqueous and soil P concentrations, surface and pore water SO42− concentration gradients between the two stations in WCA-2A, which are separated by 8.9 km, were not as sharp (see Table S2 in the supplemental material). The temporal variation of SO42− within WCA-2A has been previously reported (16) and may be due to several factors, such as fluctuations in sulfidogenic activity, rainwater input, pumping schedules, and the lack of surface water discharge with time. Even though SO42− concentrations in surface and pore waters were similar at F1 and U3, MeHg concentrations were higher at U3 than F1 in the surface and pore waters and soil (see Table S2).
Site W3 is located in the interior region of WCA-3A (see Fig. S1) and is removed from the direct influence of surface water discharges. This site had low soil P (339 mg kg−1) and surface water SO42− (≤0.20 mg liter−1) concentrations prior to the incubation. Notwithstanding the low SO42− concentrations, pore water and soil MeHg concentrations have historically been the highest of all three of the sites (see Table S2). The sites selected for this study are therefore distinct from each other in the concentrations of soil P, surface water SO42−, and MeHg: F1 (high P, high SO42−, and low MeHg), U3 (low P, high SO42−, and high MeHg), and W3 (low P, low SO42−, and high MeHg).
hgcAB primer design and optimization of PCR.
Primers were designed to amplify an approximately 900-bp product that spans regions of both hgcA and hgcB. The decision to design primers that would have the forward primer anchored in conserved regions of hgcA and the reverse primer in hgcB, rather than both in hgcA, was based on the degrees of degeneracy required for the reverse primer within hgcA. As described by Schaefer et al. (8), opportunities for design of the reverse primer within hgcA are limited by significant sequence diversity between diverse families within hgcA. This degree of sequence diversity led Schaefer et al. (8) to design a primer that was biased toward the more important Deltaproteobacteria, with the understanding that the primer set was biased away from groups that would yield greater diversity in the hgcA sequences, such as the Firmicutes and Methanomicrobia.
In the hgcAB primer set designed for this study, the primer binding region within hgcB is far less diverse than in the comparable regions for hgcA, such that a primer based in this region was expected to amplify a broader range of phylogenetic groups than might be possible for a reverse primer anchored in hgcA. Primer binding regions with degenerate positions for 50 sequences are presented in Table S1 in the supplemental material. This strategy is based on the fact that the great majority of target species have contiguous hgcA and hgcB genes; strains with a different gene order would not likely be detected with this system. In the 50 hgcA and hgcB sequences currently available in GenBank, only Desulfovibrio africanus has a different gene order (with an insertion between hgcA and hgcB) (10) such that it would not be expected to be amplified with this primer set. In silico studies suggest that the hgcAB primer set would amplify the target sequences from a broad range of Deltaproteobacteria, Methanomicrobia, Firmicutes, and Chloroflexi.
Preliminary experiments were conducted to optimize the cycling conditions (e.g., annealing temperatures and extension times). No significant differences in amplicon intensity in agarose electrophoresis with ethidium bromide staining were observed at annealing temperatures of 50°C, 55°C, and 60°C (the calculated melting temperatures were 55.5°C and 58.2°C for forward and reverse primers, respectively) and extension times at 72°C of, e.g., 30 s, 1 min, and 1.5 min. Regardless of extension time, a single major band with the expected size (∼900 bp) was observed, with some faint smaller-molecular-size products (observed as smearing on electrophoretic gels). These faint smaller-molecular-size products were attributed to nonspecific amplification. To reduce the amount of nonspecific amplification, a touchdown PCR protocol was established that greatly reduced the production of smaller-molecular-size amplicons (data not shown).
Reverse transcription-PCR (RT-PCR) for hgcAB was also performed for RNA isolated from environmental samples and from the laboratory incubations. No hgcAB was amplified in any sample, indicating that hgcAB mRNA concentrations were below the limits of detection, if present at all.
Diversity and distribution of hgcA in WCA-2A and WCA-3A soils.
Sequence analysis was conducted exclusively on hgcA sequences and did not include the segment of hgcB included in the amplification products. A total of 220 hgcA sequences were obtained from sites F1, U3 and W3 and were distributed between 168 OTUs defined by a 5% cutoff. When 10% and 20% are used as cutoff values, 159 and 137 OTUs were obtained, respectively. The OTUs (5% cutoff) were affiliated with phyla Chloroflexi and Firmicutes or classes Deltaproteobacteria and Methanomicrobia of phylum Euryarchaeota (Fig. 1; detailed information on the phylogenetic affiliations of hgcA OTUs is given in Table S3 in the supplemental material). This overall phylogenetic tree for only hgcA was in good agreement with the one using the concatenated sequences of both hgcAB genes (11). Deltaproteobacteria was the dominant group in all sites (≥53%), and ≥93% were affiliated with Syntrophobacterales (subgroup DP-I) (Fig. 1). The remaining Deltaproteobacteria members (DP-II) were affiliated with the orders Desulfovibrionales and Desulfuromonadales, including many previously characterized Hg methylators, e.g., Desulfovibrio and Geobacter species (12, 46). Phyla Chloroflexi and Firmicutes occurred as minor groups but with a constant portion in all sties (4 to 7% and 15 to 18%, respectively). Chloroflexi comprising 10 distinct OTUs were related to Dehalococcoides mccartyi DCMB5 (46). The Firmicutes OTUs were mostly unidentified members, which were loosely related to families Syntrophomonadaceae, Peptococcaceae, and Veillonellaceae. Sequences associated with the Euryarchaeota were present in all sites and were related to families Methanosarcinaceae, Methanoregulaceae, Methanomicrobiaceae, and Methanocellales in the class Methanomicrobia. Interestingly, among four classes of methanogenic Euryarchaeota, namely, Methanomicrobia, Methanobacteria, Methanococci, and Methanopyri, only Methanomicrobia has been shown to harbor hgcAB to date. Although they appeared as a minor group in F1 (8%), the portion increased up to 27% at W3, which follows a gradient in decreasing concentrations of SO42− (see Table S2).
FIG 1.

Maximum likelihood phylogenetic tree representing phylogenetic distribution of hgcA-based OTUs from soil samples at three Everglades sites. Clade colors black, gray, and white represent clades composed of only reference sequences from GenBank, reference sequences and our sequences, and our sequences only, respectively. Taxon names inferred from reference sequences were presented for individual clades, with the number of OTUs included in the clades. Reference sequences and representative OTUs in each clade are provided in Table S3 in the supplemental material. Bootstrap values higher than 50% of 1,000 reassemblages are placed at branch points. Bar represents 0.1 substitution per deduced amino acid sequences of hgcA. Pie charts show relative proportions of major clades within clone libraries. ChFlx, Chloroflexi; FIRM, Firmicutes; EuArch, Euryarchaeota.
The sequence diversity of hgcA detected by this primer set in the Everglades is very high. The Chao1 richness estimator predicted the presence of 250 OTUs at W3, 139 OTUs at U3, and 125 OTUs at F1 (see Table S5 in the supplemental material). The coverage statistic indicated that less than 43% of hgcA in our libraries were included in our sequences. Site W3 showed somewhat a higher Shannon diversity index (4.1) than either U3 or F1 (both 3.9). These α-diversity measurements (diversity within a community) indicate that the low nutrient status and/or low SO42− (see Table S2) is related to high diversity within the hgcA fragments.
The communities shared very few OTUs (≤4 OTUs) between the two sites, and no OTUs were shared among all three sites (see Fig. S3A in the supplemental material). To assess any difference among the hgcA communities, P-test and the UniFrac significance tests were performed based on their phylogeny. Both P-test and UniFrac Significant tests indicate that the hgcA fragment assemblage structures among the sites are different with a high degree of significance (P ≤ 0.05). In the PCoA plot, sequences from each site were clearly separated by axes P1 (explaining 53.4% of the variation) and P2 (explaining 46.5% of the variation) as illustrated in Fig. S3B in the supplemental material. All β-diversity measurements (diversity between communities) indicated that the hgcA communities are significantly different each other across the SO42− and nutrient gradients.
Diversity and distribution of dsrB mRNA in WCA-2A and WCA-3A soils.
Based on previous studies on mercury methylation (20) and the distribution of hgcA in the Everglades (8) indicating that SuRP are the dominant mercury methylators in much of the Everglades, we were interested in potential relationships between SuRP and the distribution of hgcAB at selected sites along a gradient in SO42− concentrations in WCA-2A and -3A (see Table S2). The distribution of active SuRP at the time of sampling was assessed by sequence analysis of cDNA produced from dsrB mRNA. Analysis of dsrB mRNA rather than DNA was conducted because of the apparent great redundancy in dsrB in WCA-2A (18, 19); analysis of mRNA would provide a snapshot of those phylotypes that were active, which could then be compared with hgcAB sequences.
A total of 237 dsrB transcripts were obtained from sites F1, U3, and W3, and were assigned to 82 OTUs defined by a 5% cutoff in differences between deduced amino acid sequences. The numbers of OTUs obtained with different cutoff values are presented in Table S5 in the supplemental material. The 82 dsrB mRNA sequences representing each OTU were distributed between the phyla Firmicutes and Nitrospirae or the class Deltaproteobacteria (Fig. 2; detailed phylogenetic affiliation of dsrB OTUs is provided in Table S4). The Deltaproteobacteria transcripts were divided into two distinct clades representing the orders Syntrophobacterales (DP-A) and Desulfobacterales/Desulfovibrionales (DP-B). The DP-A clade dominated all sites (≥75% of total transcripts), comprising five subgroups (S-I to S-V) affiliated with the Syntrophaceae (S-I and S-V), Syntrophobacteraceae (S-III), and two unidentified groups (S-II and S-IV). S-I was related to Desulfobacca acetoxidans DSM 11109, which specifically dominated U3 (70% of DP-A) while lowest at W3 (7.2%). S-III included many sequences closely related to those of syntrophs, e.g., Syntrophobacter wolinii, Syntrophobacter fumaroxidans, and Desulfacinum infernum, and dominated site W3 (71% of DP-A). The DP-B comprised typical sulfidogens in the families Desulfobacteraceae, Desulfovibrionaceae, and Desulfobulbaceae. They appeared as a minor group with ≤15% of total transcripts detected, and their proportion was highest at site F1, followed by U3 and W3. The Firmicutes occurred as a minor group (≤14% of total) in all sites, distributed into the genera Desulfotomaculum (25 to 75% of total Firmicutes) and Carboxydothermus (≤15%) and unknown clades. Only one OTU of Nitrospirae was detected at sites U3 and W3, which were related to Thermodesulfovibrio islandicus DSM 12570, a strain isolated from a hot spring (47).
FIG 2.

Phylogenetic distribution of dsrB mRNA sequences from soil samples at three Everglades sites. Maximum likelihood phylogenetic trees were generated using deduced amino acid sequences from the dsrB transcripts. Bar represents 0.2 substitution per deduced amino acid sequences of dsrB. The taxon name in each clade was inferred from the reference sequences inside the clade (detailed reference sequences are provided in Table S4 in the supplemental material). The clades containing only our sequences or together with known reference sequences are indicated by white or gray, respectively; clades containing none of our sequences are shown in black. Pie charts show relative proportions of major clades within clone libraries.
The calculated Chao1 richness index estimated that site U3 harbored the highest richness (38 OTUs), while F1 harbored the lowest number of OTUs (29) (see Table S5). The coverage statistic indicated that 69% to 85% of OTUs were sampled from the gene libraries for each site. The Shannon diversity index was somewhat higher at sites U3 and W3 than at F1 (3.2 versus 3.0, respectively). These α-diversity measurements consistently indicate that the oligotrophic sites U3 and W3 supported a greater diversity of active SuRP than the more highly nutrient-impacted site, F1. Fewer than six OTUs were common between any two sites, and only four OTUs were shared in the communities at all three sites (see Fig. S4A). The significant P values (<0.05) from both the P-test and UniFrac significance test indicate that the dsrB assemblages at the three sites are significantly different from each other. The PCoA revealed that the dsrB sequences were separated by axes P1 (52.8% of the variance) and P2 (47.2% of the variance) (see Fig. S4B). The dsrB mRNA analysis provided strong evidence of the ubiquity of active syntrophic clades of the SuRP at all three of the study sites. It is not known at this time if members of those clades were functioning syntrophically or using SO42− as a terminal electron acceptor. dsrB may be actively transcribed during syntrophy and during anaerobic respiration (48).
MeHg production in laboratory incubations.
The contributions of SuRP and methanogens to Hg methylation were assessed in laboratory incubations of W3 soils with different combinations of specific metabolic inhibitors. W3 soils have relatively low SO42− concentrations, such that the impacts of SO42− additions on mercury methylation could be investigated in these soils. All control and inhibitor-treated vessels received 139 ng liter−1 of Hg2+ as HgCl2. A control incubation with no added SO42− or inhibitor (CT-I) produced 0.90 ng liter−1 and 0.78 ng liter−1 of MeHg after 7 and 14 days of incubation, respectively (Fig. 3). Amendments with 4.5 mg liter−1 of SO42−, but without added inhibitor (CT-II), enhanced net MeHg production by ∼50% at day 7. No further net MeHg production occurred between days 7 and 14, even though SO42− was continuously reduced throughout the incubation (Fig. 3). The cessation of MeHg production after day 7 in the controls was likely due to the exhaustion of some limiting nutrient. On day 14 of incubation, the copy numbers of mcrA transcripts and dsrB transcripts were 6.2 × 10⁶ and 1.9 × 10⁵ copies g−1 of soil, respectively, in CT-II (Fig. 3).
FIG 3.
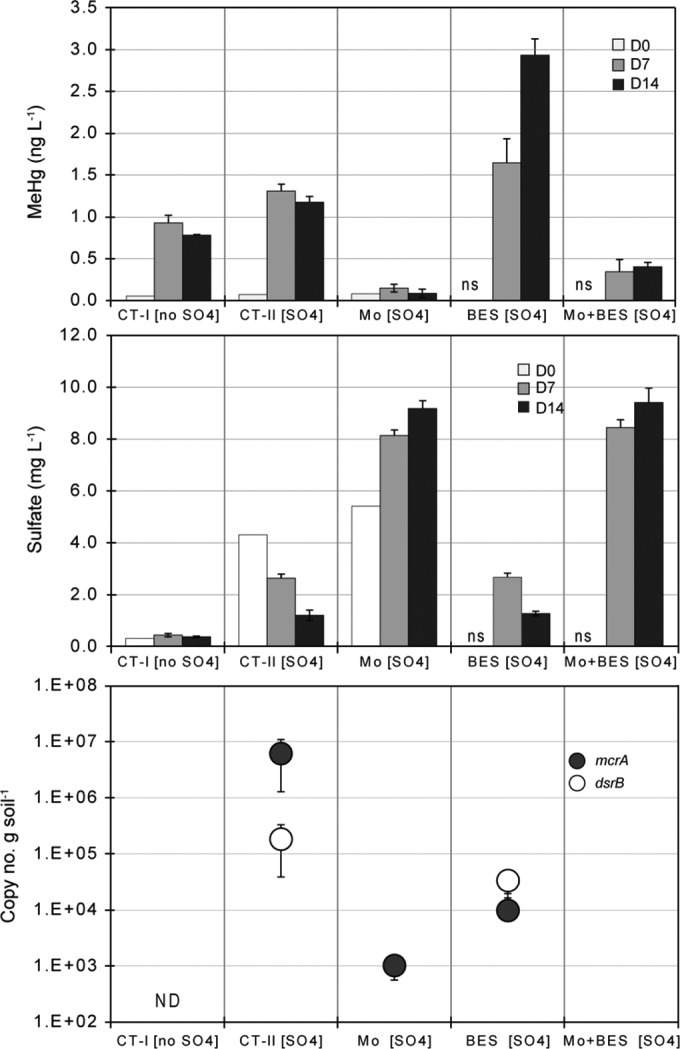
Methylmercury (MeHg) production, sulfate (SO42−) consumption and the transcript concentration of mcrA and dsrB during the laboratory incubations of WCA-3A soils with and without specific inhibitors. All controls and treatments received 139 ng liter−1 of Hg2+ as HgCl2 at the beginning of the incubation. D0, D7, and D14 represent the initial, day 7, and day 14 concentrations, respectively, of MeHg and sulfate in the water column. The transcript concentrations are from the soil after 14 days of incubation. CT, control (no inhibitors added); Mo, 20 mM molybdate (MoO42−); BES, 50 mM bromoethanesulfonate; ND, not determined; ns, no sample. Error bars represent the standard errors from triplicate incubation vessels.
The MoO42− treatment dramatically decreased MeHg accumulation and SO42− reduction. The inhibition of SO42− reduction by MoO42− resulted in increasing SO42− concentrations, probably due to decomposition of organic sulfur compounds. No transcripts of dsrB were detected, indicating that the activity of SuRP was completely inhibited by MoO42−. The concentrations of mcrA transcripts were also significantly decreased in the MoO42− treatment, with fewer than 1 × 10³ copies g−1 soil detected.
In treatment with BES, an inhibitor of methanogens, net MeHg production reached its highest level (2.9 ng liter−1) on day 14 of any other treatments or control groups, whereas SO42− concentrations decreased during the incubation. Numbers of dsrB transcripts were 3.4 × 10⁴ copies g−1, which is somewhat lower than those in the control incubations (1.9 × 10⁵ copies g−1), suggesting that BES may have inhibited the activities of some SuRP, either directly or indirectly. BES markedly decreased the numbers of mcrA transcripts by 2 orders of magnitude relative to the control but did not completely inhibit production of mcrA mRNA.
The combined treatment with MoO42− and BES inhibited MeHg production and SO42− reduction. Interestingly, the MeHg concentrations on days 7 and 14 were higher than those in the treatment with MoO42− only. No mcrA and dsrB transcripts were detected in this incubation, implying that the higher MeHg concentration might not have been due to SuRP or methanogenic activities. Soluble iron concentrations were also monitored in most of these incubations (see Fig. S5), with the exception of the treatments with MoO42− only and with MoO42− plus BES treatments. As can be seen, iron was actively reduced in all incubations, and it was likely also reduced in the treatments with MoO42− only and with MoO42− plus BES.
DISCUSSION
In this study, we designed a new set of PCR primers to amplify regions of hgcAB and used the primer set to investigate the diversity of approximately 750 bp of hgcA, across the SO42− concentration gradient in the northern Everglades. hgcA sequences affiliated with the Deltaproteobacteria were the dominant group in all sites, constituting ≥53% of total hgcA sequences. The great majority of Deltaproteobacteria sequences (≥93%) were affiliated with Syntrophobacterales (DP-I). The orders Desulfovibrionales and Desulfuromonadales, which include some of the more well-studied mercury methylators (12, 46, 49), constituted relatively minor groups in our clone libraries.
With the exceptions of three sequences affiliated with Geobacter in site W3, all hgcA sequences clustering within the Deltaproteobacteria were affiliated with SuRP. To date, all known SuRP harbor dsrB, such that dsrB would be carried with hgcAB in mercury-methylating SuRP, and consequently, the function of dsrB would affect the distribution of Deltaproteobacteria hgcAB. Similar to the hgcA sequences, the dsrB transcript sequences were also dominated by Deltaproteobacteria (80 to 95%), and representatives of Firmicutes and Nitrospirae constituted minor groups (5 to 14% and ≤1%, respectively) among the study sites. Interestingly, as was seen with the hgcA distribution, the Deltaproteobacteria sequences were dominated (≥84% of sequences) by Syntrophobacterales sequences (DP-A) (Fig. 2), and Desulfovibrionales and Desulfobacteriales sequences were represented by relatively few (≤15%) sequences (DP-B) (Fig. 2). The observation that hgcA and dsrB sequences shared similar distribution patterns implies that hgcAB was distributed in each site according to the host's response to the environmental conditions of that site. It should be noted that the activities of similar groups of SuRP do not imply active transcription of hgcAB, nor does they imply correlations between the transcription of dsrB and potential mercury methylation rates. They do, however, provide insight into the distribution and relative importance of the host groups and may provide clues to controls on the distribution of the dominant hgcAB-bearing SuRP in the Everglades.
The dominant distribution of hgcAB within syntrophic SuRP is likely to be due to the relatively low concentration of SO42− such as observed at W3 and to their function as secondary fermenters in methanogenic environments (50) such as F1. SuRP have been shown to be capable of mercury methylation during syntrophic metabolism in coculture with a strain of H2-utilizing methanogens (51). Mercury methylation during syntrophy in a marine sediment was also suggested by a recent study that showed that production of MeHg was greater in SO42−-limiting than in higher-SO42− slurries (52). It may be that syntrophic methylation of Hg includes either SuRP, methanogens, or both syntrophic partners in SO42−-limited freshwater environments, which occupy vast areas of the remnant Everglades. Moreover, syntrophic methylation may not be restricted to only relatively low-SO42− environments in the Everglades. Previous studies (53, 54) have shown that syntrophs are present at both the higher-SO42− F1 and U3 sites, with greater numbers present in F1 than in U3, likely due to the higher ratios of carbon to SO42− present in F1 than U3.
The culture-independent approach identified a diverse group of potential syntrophic SuRP (91 hgcA OTUs) in this study. Unfortunately, relatively few hgcAB sequences are available to date as references for inferring the phylogenetic affiliation of the detected sequences. References available at this time are from an extensive screening of microbial genomes by Gilmour et al. (11) and include sequences from Syntrophus aciditrophicus SB, Desulfomonile tiedjei DCB-1, Syntrophorhabdus aromaticivorans UI, and the uncultured bacterium NaphS2. The limited sequence information available prevents the specific assignment of the majority of hgcA sequences associated with syntrophic SuRP, particularly the clade labeled “Deltaproteobacteria I” in Fig. 1, such that they are labeled “unidentified.” The dsrB transcripts detected in those sites indicate that clades S-I (related to Desulfobacca acetoxidans) and S-III (related to multiple genera in family Syntrophobacteraceae [see Table S4 in the supplemental material]) are dominant groups of syntrophs, whereas clades S-IV (related to bacterium NaphS2) and S-V (related to Desulfomonile tiedjei DCB-1) are minor groups, consistent with the results of hgcA sequence composition (Fig. 1; see also Table S3). Therefore, a large number of unidentified hgcA sequences may come from groups S-I and S-III; however, it is not possible to draw definitive links between them due to lack of information required to link the two genes. Further work is necessary to better understand the contribution of syntrophs to Hg methylation.
The distributions of both dsrB and hgcA sequences differ according to their position along the SO42−, iron, and nutrient gradients; the proportions of methanogens and iron reducers were higher in the low-SO42− site W3 (27% and 4%, respectively) than in F1 and U3, where iron concentrations were lower than at W3 (see Table S2). Methanogens and iron reducers have been identified as significant mercury methylators in other freshwater environments (49, 55).
The production of MeHg was evaluated in Hg2+-amended laboratory incubations of the low-SO42− W3 soils with and without additional SO42− and inhibitors of SuRP (MoO42−) and methanogens (BES) (Fig. 3). The addition of SO42− resulted in somewhat increased MeHg accumulations, with concomitant SO42− reduction, suggesting that the sulfidogenic methylation was accelerated by the SO42− addition. The addition of MoO42− almost completely inhibited MeHg production and SO42− reduction, suggesting that Hg methylation is controlled predominantly by SuRP. However, MoO42− inhibition may be complex because Hg methylation can be mediated not only by SuRP dependent on SO42− respiration but also by syntrophs and methanogens that would be independent of SO42− reduction. MoO42− has been shown to inhibit SuRP under both SO42− reduction and syntrophic metabolism (56, 57). The MoO42− inhibition of both syntrophs and their methanogenic partners in these incubations is suggested by the inability to detect dsrB transcripts and the significant decrease in mcrA mRNA copies detected (Fig. 3). The potential inhibition by MoO42− of syntrophic conversion of propionate or butyrate to acetate or H2 has been previously reported for anaerobic granules (57) and SO42−-reducing aquifer sediments (58). The inhibition of methanogens observed in this study may be an indirect effect following the inhibition of syntrophs, thereby blocking the supply of H2 or formate to hydrogenotrophic methanogens. These incubations suggest that Hg methylation in W3 may be related to both SO42−-reducing and syntrophic activities. This result is consistent with the dominance of syntrophic sequences represented in both the hgcA and dsrB libraries from W3 soil.
The observation that BES did not inhibit MeHg production but rather increased its production suggests that methanogens are not the key organisms responsible for methylation in these soils. The increased concentrations of MeHg observed in the BES incubations may suggest that methanogens are responsible for mercury demethylation at this site (59). At this time, it is not clear what mechanism is responsible for the high concentrations of MeHg observed in the BES treatment.
Also of interest is the incubation with both BES and MoO42−, which inhibited both SuRP and methanogens (Fig. 3). This is confirmed by the lack of detection of mcrA and dsrB mRNA and indicates the presence of additional groups responsible for mercury methylation since MeHg was produced in these soils. Iron-reducing bacteria belonging to the family Geobacteriaceae have been shown to be efficient mercury methylators (46), and hgcA sequences related to the Geobacteriaceae were detected in the W3 soil (Fig. 1). The concentration of Fe in this soil was 7,900 mg kg−1, and production of dissolved Fe (presumably Fe2+) was observed in the controls and treatments (see Fig. S5 in the supplemental material). More work is needed to confirm the possibility that iron reducers are significant mercury methylators in Fe-enriched Everglades environments.
To summarize, our findings reveal the potential importance of syntrophs within the SuRP clades in the Water Conservation Areas of the Everglades. Further investigations into the significance of syntrophic versus sulfidogenic metabolism in accounting for net methylmercury accumulation, as well as the role of non-SuRP, such as iron-reducing bacteria, are therefore warranted. Also, the degree and extent of demethylation in the Everglades have been understudied. Clarification of these important processes, and under what environmental conditions they become significant, should facilitate management actions to help minimize mercury methylation in the Everglades.
Supplementary Material
ACKNOWLEDGMENTS
This research was supported by a grant from the National Science Foundation (DEB 0841596) and funding from the Everglades Agricultural Area Environmental Protection District, the Florida Department of Environmental Protection, and the Florida Department of Agriculture and Consumer Services.
The South Florida Water Management District provided technical oversight. N. Larson participated in the laboratory incubation, and J. Wolack assisted in the chemical analyses of waters. Mercury concentrations were determined by Brooks Rand Laboratory. M. Kharbanda helped produce the graphics. Thanks are due to Garth Redfield, Binhe Gu, Paul Julian II, Tom DeBusk, and Mike Jerauld for critically reviewing the manuscript.
Footnotes
Published ahead of print 8 August 2014
Supplemental material for this article may be found at http://dx.doi.org/10.1128/AEM.01666-14.
REFERENCES
- 1.Julian P, II, Payne GG, Xue SK. 2014. Water quality in the Everglades Protection Area, chapter 3A, p 3A-1–3A-50 In 2014 South Florida environmental report, vol 1 South Florida Water Management District, West Palm Beach, FL. [Google Scholar]
- 2.Rood BE, Gottgens JF, Delfino JJ, Earle CD, Crisman TL. 1995. Mercury accumulation trends in Florida Everglades and Savannas Marsh flooded soils. Water Air Soil Pollut. 80:981–990. 10.1007/BF01189752 [DOI] [Google Scholar]
- 3.Cleckner L, Garrison P, Hurley J, Olson M, Krabbenhoft D. 1998. Trophic transfer of methyl mercury in the northern Florida Everglades. Biogeochemistry 40:347–361. 10.1023/A:1005918101773 [DOI] [Google Scholar]
- 4.Clarkson TW. 1997. The toxicology of mercury. Crit. Rev. Clin. Lab. Sci. 34:369–403. 10.3109/10408369708998098 [DOI] [PubMed] [Google Scholar]
- 5.Mergler D, Anderson HA, Chan LHM, Mahaffey KR, Murray M, Sakamoto M, Stern AH. 2007. Methylmercury exposure and health effects in humans: a worldwide concern. Ambio 36:3–11. 10.1579/0044-7447(2007)36[3:MEAHEI]2.0.CO;2 [DOI] [PubMed] [Google Scholar]
- 6.Hsu-Kim H, Kucharzyk KH, Zhang T, Deshusses MA. 2013. Mechanisms regulating mercury bioavailability for methylating microorganisms in the aquatic environment: a critical review. Environ. Sci. Technol. 47:2441–2456. 10.1021/es304370g [DOI] [PubMed] [Google Scholar]
- 7.Liu G, Cai Y, Mao Y, Scheidt D, Kalla P, Richards J, Scinto LJ, Tachiev G, Roelant D, Appleby C. 2009. Spatial variability in mercury cycling and relevant biogeochemical controls in the Florida Everglades. Environ. Sci. Technol. 43:4361–4366. 10.1021/es803665c [DOI] [PubMed] [Google Scholar]
- 8.Schaefer JK, Kronberg R-M, Morel FMM, Skyllberg U. 2014. Detection of a key Hg methylation gene, hgcA, in wetland soils. Environ. Microbiol. Rep. 10.1111/1758-2229.12136 [DOI] [PubMed] [Google Scholar]
- 9.Gilmour CC, Henry EA, Mitchell R. 1992. Sulfate stimulation of mercury methylation in freshwater sediments. Environ. Sci. Technol. 26:2281–2287. 10.1021/es00035a029 [DOI] [Google Scholar]
- 10.Parks JM, Johs A, Podar M, Bridou R, Hurt RA, Jr, Smith SD, Tomanicek SJ, Qian Y, Brown SD, Brandt CC, Palumbo AV, Smith JC, Wall JD, Elias DA, Liang L. 2013. The genetic basis for bacterial mercury methylation. Science 339:1332–1335. 10.1126/science.1230667 [DOI] [PubMed] [Google Scholar]
- 11.Gilmour CC, Podar M, Bullock AL, Graham AM, Brown S, Somenahally AC, Johs A, Hurt RA, Jr, Bailet KL, Elias DA. 2013. Mercury methylation by novel microorganisms from new environments. Environ. Sci. Technol. 47:11810–11820. 10.1021/es403075t [DOI] [PubMed] [Google Scholar]
- 12.King JK, Kostka JE, Frischer ME, Saunders FM. 2000. Sulfate reducing bacteria methylate mercury at variable rates in pure culture and in marine sediments. Appl. Environ. Microbiol. 66:2430–2437. 10.1128/AEM.66.6.2430-2437.2000 [DOI] [PMC free article] [PubMed] [Google Scholar]
- 13.Craft CB, Richardson CJ. 1993. Peat accretion and phosphorus accumulation along a eutrophication gradient in the northern Everglades. Biogeochemistry 22:133–156. 10.1007/BF00002708 [DOI] [Google Scholar]
- 14.DeBusk WF, Newman S, Reddy KR. 2001. Spatio-temporal patterns of soil phosphorus enrichment in Everglades Water Conservation Area 2A. J. Environ. Qual. 30:1438–1446. 10.2134/jeq2001.3041438x [DOI] [PubMed] [Google Scholar]
- 15.Reddy KR, White JR, Wright A, Chua T. 1999. Influence of phosphorus loading on microbial processes in the soil and water column of wetlands, p 249–273 In Reddy KRO', Connor GA, Schelske CL. (ed), Phosphorus biogeochemistry in subtropical ecosystems. Lewis Publishers, New York, NY [Google Scholar]
- 16.Orem W, Gilmour C, Axelrad D, Krabbenhoft D, Scheidt D, Kalla P, McCormick P, Gabriel M, Aiken G. 2011. Sulfur in the South Florida ecosystem: distribution, sources, biogeochemistry, impacts, and management for restoration. Crit. Rev. Environ. Sci. Technol. 41(Suppl 1):249–288. 10.1080/10643389.2010.531201 [DOI] [Google Scholar]
- 17.Julian P, II, Gu B, Frydenborg R, Lange T, Wright AL, McCray JM. 2014. Mercury and sulfur environmental assessment for the Everglades, chapter 3B, p 3B-1–3B-59 In 2014 South Florida environmental report, vol 1 South Florida Water Management District, West Palm Beach, FL. [Google Scholar]
- 18.Castro HF, Ogram A, Reddy KR. 2004. Phylogenetic characterization of methanogenic assemblages in eutrophic and oligotrophic areas of the Florida Everglades. Appl. Environ. Microbiol. 70:6559–6568. 10.1128/AEM.70.11.6559-6568.2004 [DOI] [PMC free article] [PubMed] [Google Scholar]
- 19.Castro HF, Newman S, Reddy KR, Ogram A. 2005. Distribution and stability of sulfate reducing prokaryotic and hydrogenotrophic methanogenic assemblages in nutrient-impacted regions of the Florida Everglades. Appl. Environ. Microbiol. 71:2695–2704. 10.1128/AEM.71.5.2695-2704.2005 [DOI] [PMC free article] [PubMed] [Google Scholar]
- 20.Gilmour CC, Riedel GS, Ederington MC, Bell JT, Benoit JM, Gill GA, Stordal MC. 1998. Methylmercury concentrations and production rates across a trophic gradient in the northern Everglades. Biogeochemistry 40:327–345. 10.1023/A:1005972708616 [DOI] [Google Scholar]
- 21.Castro HF, Williams N, Ogram AV. 2000. Phylogeny of sulfate reducing bacteria. FEMS Microbiol. Ecol. 31:1–9. 10.1111/j.1574-6941.2000.tb00665.x [DOI] [PubMed] [Google Scholar]
- 22.McInerney MJ, Struchtemeyer CG, Sieber J, Mouttaki H, Stams AJM, Schink B, Rohlin L, Gunsalus RP. 2008. Physiology, ecology, phylogeny, and genomics of microorganisms capable of syntrophic metabolism. Ann. N. Y. Acad. Sci. 1125:58–72. 10.1196/annals.1419.005 [DOI] [PubMed] [Google Scholar]
- 23.Plugge CM, Zhang W, Scholten JCM, Stams AJM. 2011. Metabolic flexibility of sulfate-reducing bacteria. Front. Microbiol. 2:81. 10.3389/fmicb.2011.00081 [DOI] [PMC free article] [PubMed] [Google Scholar]
- 24.Dar SA, Yao L, van Dongen U, Kuenen JG, Muyzer G. 2007. Analysis of diversity and activity of sulfate-reducing bacterial communities in sulfidogenic bioreactors using 16S rRNA and dsrB genes as molecular markers. Appl. Environ. Microbiol. 73:594–604. 10.1128/AEM.01875-06 [DOI] [PMC free article] [PubMed] [Google Scholar]
- 25.Zhou J, Riccardi D, Beste A, Smith J, Parks J. 2014. Mercury methylation by hgcA: theory supports carbanion transfer to Hg(II). Inorg. Chem. 53:772–777. 10.1021/ic401992y [DOI] [PubMed] [Google Scholar]
- 26.Yu R-Q, Reinfelder JR, Hines ME, Barkay T. 2013. Mercury methylation by the methanogen Methanospirillum hungatei. Appl. Environ. Microbiol. 79:6325–6330. 10.1128/AEM.01556-13 [DOI] [PMC free article] [PubMed] [Google Scholar]
- 27.Holmes ME, Chanton JP, Bae H-S, Ogram A. 2014. Effect of nutrient enrichment on δ13CH4 and the methane production pathway in the Florida Everglades. J. Geophys. Res.Biogeosci. 119:1267–1280. 10.1002/jgrg.20122 [DOI] [Google Scholar]
- 28.Foti M, Sorokin DY, Lomans B, Mussman M, Zacharova EE, Pimenov NV, Kuenen JG, Muyzer G. 2007. Diversity, activity, and abundance of sulfate-reducing bacteria in saline and hypersaline soda lakes. Appl. Environ. Microbiol. 73:2093–2100. 10.1128/AEM.02622-06 [DOI] [PMC free article] [PubMed] [Google Scholar]
- 29.Thompson JD, Gibson TJ, Plewniak F, Jeanmougin F, Higgins DG. 1997. The Clustal_X windows interface: flexible strategies for multiple sequence alignment aided by quality analysis tools. Nucleic Acids Res. 25:4876–4882. 10.1093/nar/25.24.4876 [DOI] [PMC free article] [PubMed] [Google Scholar]
- 30.Hall TA. 1999. BioEdit: A user-friendly biological sequence alignment editor and analysis program for Windows 95/98/NT. Nucleic Acids Symp. Ser. 41:95–98 [Google Scholar]
- 31.Schloss PD, Westcott SL, Ryabin T, Hall JR, Hartmann M, Hollister EB, Lesniewski RA, Oakley BB, Parks DH, Robinson CJ, Sahl JW, Stres B, Tahllinger GG, Van Horn DJ, Weber CF. 2009. Introducing mothur: open-source, platform independent, community-supported software for describing and comparing microbial communities. Appl. Environ. Microbiol. 75:7537–7541. 10.1128/AEM.01541-09 [DOI] [PMC free article] [PubMed] [Google Scholar]
- 32.Tamura K, Peterson D, Peterson N, Stecher G, Nei M, Kumar S. 2011. MEGA 5: molecular evolutionary genetics analysis using maximum likelihood, evolutionary distance, and maximum parsimony methods. Mol. Biol. Evol. 28:2731–2739. 10.1093/molbev/msr121 [DOI] [PMC free article] [PubMed] [Google Scholar]
- 33.Hamady M, Lozupone C, Knight R. 2010. Fast UniFrac: facilitating high-throughput phylogenetic analyses of microbial communities including analysis of pyrosequencing and PhyloChip data. ISME J. 4:17–27. 10.1038/ismej.2009.97 [DOI] [PMC free article] [PubMed] [Google Scholar]
- 34.Lozupone C, Knight R. 2005. UniFrac: a new phylogenetic method for comparing microbial communities. Appl. Environ. Microbiol. 71:8228–8235. 10.1128/AEM.71.12.8228-8235.2005 [DOI] [PMC free article] [PubMed] [Google Scholar]
- 35.Martin AP. 2002. Phylogenetic approaches for describing and comparing the diversity of microbial communities. Appl. Environ. Microbiol. 68:3673–3682. 10.1128/AEM.68.8.3673-3682.2002 [DOI] [PMC free article] [PubMed] [Google Scholar]
- 36.Steinberg LM, Regan JM. 2009. mcrA-targeted real-time quantitative pcr method to examine methanogen communities. Appl. Environ. Microbiol. 75:4435–4442. 10.1128/AEM.02858-08 [DOI] [PMC free article] [PubMed] [Google Scholar]
- 37.Klein D. 2002. Quantification using real-time PCR technology: applications and limitations. Trends Mol. Med. 8:257–260. 10.1016/S1471-4914(02)02355-9 [DOI] [PubMed] [Google Scholar]
- 38.Oremland RS, Capone DG. 1988. Use of “specific” inhibitor in biogeochemistry and microbial ecology. Adv. Microb. Ecol. 10:285–383. 10.1007/978-1-4684-5409-3_8 [DOI] [Google Scholar]
- 39.US Environmental Protection Agency. 2002. Method 1631, Revision E: Mercury in water by oxidation, purge and trap, and cold vapor atomic fluorescence spectrometry (August 2002). EPA-821-R-02–019. Office of Water, Office of Science and Technology, Engineering and Analysis Division, US Environmental Protection Agency, Washington, DC [Google Scholar]
- 40.US Environmental Protection Agency. 2001. Method 1630: Methyl mercury in water by distillation, aqueous ethylation, purge and trap, and CVAFS (January 2001). EPA-821-R-01–020. Office of Water, Office of Science and Technology, Engineering and Analysis Division, US Environmental Protection Agency, Washington, DC [Google Scholar]
- 41.American Public Health Association. 1992. Standard methods for the examination of water and wastewater, 18th ed. American Public Health Association, Washington, DC [Google Scholar]
- 42.Nürnberg G. 1984. Iron and hydrogen sulfide interference in the analysis of soluble reactive phosphorus in anoxic waters. Water Res. 18:369–377. 10.1016/0043-1354(84)90114-3 [DOI] [Google Scholar]
- 43.Plumb RH., Jr 1981. Procedures for handling and chemical analysis of sediment and water samples. Technical report EPA/CE-81-1. Prepared for USEPA/US Army Corps of Engineers Technical Committee on Criteria for Dredged and Fill Material. US Army Engineers Waterways Experimental Station, Vicksburg, MS [Google Scholar]
- 44.US Environmental Protection Agency. 1979. Methods for chemical analysis of waters and wastes, 1978. EPA Rep. 600/4-79-020. US Environmental Protection Agency, Washington, DC [Google Scholar]
- 45.Castro H, Reddy KR, Ogram A. 2002. Composition and function of sulfate-reducing prokaryotes in eutrophic and pristine areas of the Florida Everglades. Appl. Environ. Microbiol. 68:6129–6137. 10.1128/AEM.68.12.6129-6137.2002 [DOI] [PMC free article] [PubMed] [Google Scholar]
- 46.Kerin EJ, Gilmour CC, Roden E, Suzuki MT, Coates JD, Mason RP. 2006. Mercury methylation by dissimilatory iron-reducing bacteria. Appl. Environ. Microbiol. 72:7919–7921. 10.1128/AEM.01602-06 [DOI] [PMC free article] [PubMed] [Google Scholar]
- 47.Sonne-Hansen J, Ahring BK. 1999. Thermodesulfobacterium hveragerdense sp. nov., and Thermodesulfovibrio islandicus sp. nov., two thermophilic sulfate reducing bacteria isolated from a Icelandic hot spring. Syst. Appl. Microbiol. 22:559–564. 10.1016/S0723-2020(99)80009-5 [DOI] [PubMed] [Google Scholar]
- 48.Imachi H, Sekiguchi Y, Kamagata Y, Loy A, Qiu YL, Hugenholtz P, Kimura N, Wagner M, Ohashi A, Harada H. 2006. Non-sulfate-reducing, syntrophic bacteria affiliated with Desulfotomaculum cluster I are widely distributed in methanogenic environments. Appl. Environ. Microbiol. 72:2080–2091. 10.1128/AEM.72.3.2080-2091.2006 [DOI] [PMC free article] [PubMed] [Google Scholar]
- 49.Fleming EJ, Mack EE, Green PG, Nelson DC. 2006. Mercury methylation from unexpected sources: molybdate-inhibited freshwater sediments and an iron-reducing bacterium. Appl. Environ. Microbiol. 72:457–464. 10.1128/AEM.72.1.457-464.2006 [DOI] [PMC free article] [PubMed] [Google Scholar]
- 50.Stams AJ, Plugge CM. 2009. Electron transfer in syntrophic communities of anaerobic bacteria and archaea. Nat. Rev. Microbiol. 7:568–577. 10.1038/nrmicro2166 [DOI] [PubMed] [Google Scholar]
- 51.Pak KR, Bartha R. 1998. Mercury methylation and demethylation in anoxic lake sediments and by strictly anaerobic bacteria. Appl. Environ. Microbiol. 64:1013–1017 [DOI] [PMC free article] [PubMed] [Google Scholar]
- 52.Han S, Narasingarao P, Obraztsova A, Gieskes J, Hartmann AC, Tebo BM, Allen EE, Deheyn DD. 2010. Mercury speciation in marine sediments under sulfate-limited conditions. Environ. Sci. Technol. 44:3752–3757. 10.1021/es903112m [DOI] [PubMed] [Google Scholar]
- 53.Chauhan A, Ogram A, Reddy KR. 2004. Novel syntrophic-methanogenic associations along a nutrient gradient in the Florida Everglades. Appl. Environ. Microbiol. 70:3475–3484. 10.1128/AEM.70.6.3475-3484.2004 [DOI] [PMC free article] [PubMed] [Google Scholar]
- 54.Chauhan A, Ogram A. 2006. Fatty acid oxidizing guilds in the Florida Everglades. Appl. Environ. Microbiol. 72:2400–2406. 10.1128/AEM.72.4.2400-2406.2006 [DOI] [PMC free article] [PubMed] [Google Scholar]
- 55.Hamelin S, Amyot M, Barkay T, Wang Y, Planas D. 2011. Methanogens: principal methylators of mercury in lake periphyton. Environ. Sci. Technol. 45:7693–7700. 10.1021/es2010072 [DOI] [PubMed] [Google Scholar]
- 56.Taylor BF, Oremland RS. 1979. Depletion of adenosine triphosphate in Desulfovibrio by oxyanions of group VI elements. Curr. Microbiol. 3:101–103. 10.1007/BF02602440 [DOI] [Google Scholar]
- 57.Wu WM, Hickey RF, Zeikus JG. 1991. Characterization of metabolic performance of methanogenic granules treating brewery wastewater role of sulfate-reducing bacteria. Appl. Environ. Microbiol. 57:3438–3449 [DOI] [PMC free article] [PubMed] [Google Scholar]
- 58.Struchtemeyer CG, Duncan KE, McInerney MJ. 2011. Evidence for syntrophic butyrate metabolism under sulfate-reducing conditions in a hydrocarbon-contaminated aquifer. FEMS Microbiol. Ecol. 76:289–300. 10.1111/j.1574-6941.2011.01046.x [DOI] [PubMed] [Google Scholar]
- 59.Marvin-Dipasquale M, Oremland RS. 1998. Bacterial methylmercury degradation in Florida everglades peat sediment. Environ. Sci. Technol. 32:2556–2563. 10.1021/es971099l [DOI] [Google Scholar]
- 60.Pöritz M, Goris T, Wubet T, Tarkka MT, Buscot F, Nijenhuis I, Lechner U, Adrian L. 2013. Genome sequences of two dehalogenation specialists—Dehalococcoides mccartyi strains BTF08 and DCMB5 enriched from the highly polluted Bitterfeld region. FEMS Microbiol. Lett. 343:101–104. 10.1111/1574-6968.12160 [DOI] [PubMed] [Google Scholar]
Associated Data
This section collects any data citations, data availability statements, or supplementary materials included in this article.