

Abstract
High-cell-density fermentation for industrial production of chemicals can impose numerous stresses on cells due to high substrate, product, and by-product concentrations; high osmolarity; reactive oxygen species; and elevated temperatures. There is a need to develop platform strains of industrial microorganisms that are more tolerant toward these typical processing conditions. In this study, the growth of six industrially relevant strains of Escherichia coli was characterized under eight stress conditions representative of fed-batch fermentation, and strains W and BL21(DE3) were selected as platforms for transposon (Tn) mutagenesis due to favorable resistance characteristics. Selection experiments, followed by either targeted or genome-wide next-generation-sequencing-based Tn insertion site determination, were performed to identify mutants with improved growth properties under a subset of three stress conditions and two combinations of individual stresses. A subset of the identified loss-of-function mutants were selected for a combinatorial approach, where strains with combinations of two and three gene deletions were systematically constructed and tested for single and multistress resistance. These approaches allowed identification of (i) strain-background-specific stress resistance phenotypes, (ii) novel gene deletion mutants in E. coli that confer single and multistress resistance in a strain-background-dependent manner, and (iii) synergistic effects of multiple gene deletions that confer improved resistance over single deletions. The results of this study underscore the suboptimality and strain-specific variability of the genetic network regulating growth under stressful conditions and suggest that further exploration of the combinatorial gene deletion space in multiple strain backgrounds is needed for optimizing strains for microbial bioprocessing applications.
INTRODUCTION
There is significant interest in developing strains of production microorganisms that are more tolerant toward fermentation conditions encountered in large-scale microbial bioprocessing. These conditions include high concentrations of products and by-products, the presence of chemical inhibitors in feedstocks, and general stresses inherent in high-cell-density culturing, such as elevated temperatures, high concentrations of reactive oxygen species, and high osmolarities (1, 2). Most conditions encountered in industrial fermentation do not resemble the native or rich medium environments to which wild-type and laboratory strains have adapted. For this reason, it would be anticipated that significant opportunities exist in both selecting optimal host strains for specific processing conditions and improving fitness phenotypes of strains commonly used as metabolic engineering hosts. Furthermore, the lack of adaptation to processing conditions allows the use of a variety of techniques to introduce genetic diversity in the population and to select for mutants with improved stress and chemical tolerance phenotypes.
The phenotypic variation between different environmental isolates and laboratory strains of microbial production hosts, including Escherichia coli, is often overlooked (3, 4). In particular, there exist only very limited comparative studies of quantitative stress tolerance across multiple stress conditions for commonly used E. coli host strains (5–7). Despite the lack of studies, host strain selection has played a critical role in the development of processes with improved production of chemicals and improved product tolerance (8–12), indicating the existence of extensive physiological, metabolic, and regulatory differences that would likely also manifest as differences in stress resistance.
Once a suitable host strain is selected, in principle any method that is capable of generating genetic diversity can be used to develop further improved industrial strains through selections. Here, a number of methods that have been commonly used for this purpose are highlighted. Adaptive laboratory evolution (ALE), where strains with improved growth are selected for by performing consecutive serial transfers under batch conditions or through long-term continuous cultivation, has been applied to generate strains resistant to a number of industrially relevant stresses in E. coli and other hosts (13–15). Selection from genomic overexpression libraries is another common approach that has been employed to develop strains with improved growth phenotypes under stress conditions, including exposure to high levels of acetate, butanol, hydrogen peroxide, or inhibitory compounds present in lignocellulosic hydrolysates (16–20). Global transcription machinery engineering (gTME), where a global transcriptional regulator is targeted for mutagenesis in order to quickly generate complex phenotypic changes based on transcriptome perturbation (21), is a more targeted method that has also been widely utilized to create new host strains (21, 22). Each of these methods has its own benefits and drawbacks relating to the degree of phenotypic variation that can be introduced, the ability to relate a specific set of genetic changes to a phenotypic change, and the effort required to implement the method.
Improved fitness resulting from loss-of-function mutations is a commonly encountered phenomenon (23). It has been suggested that in the absence of counterselections and without a source for horizontal gene transfer, reductive evolution of the genome through removal of genetic material is a natural outcome (24). Indeed, deletional bias can be observed as a shaping force in the size of bacterial genomes (25) and in ALE experiments conducted under strictly defined conditions (15, 26). Beneficial null mutations can increase fitness through a variety of different mechanisms, including the loss of cell structural proteins causing alterations in morphology and membrane properties, remodeling of gene and protein expression via loss of transcriptional and translational regulators and modulators of these proteins, and inactivation of enzymes when the resulting metabolic flux remodeling improves growth or survival under specific conditions. It would be expected that many functional genes and regulatory interactions may be present in the genome only to assist survival under environmental conditions not encountered in laboratory or industrial settings. Despite the known potential of even single loss-of-function mutations to improve strain phenotypes, there have been only limited efforts to verify results obtained in large-scale knockout collection studies in other strain backgrounds or to build strains that incorporate multiple simultaneous beneficial knockouts (26–28). Transposon (Tn) mutagenesis is a rapid way to generate libraries mostly consisting of loss-of-function mutations while avoiding the limitation of being constrained to a particular strain background, as is the case for knockout strain collections. A limited number of studies have isolated null mutations conferring improved phenotypes from Tn libraries in various organisms (28–31). To our knowledge, no genome-scale investigation of beneficial loss-of-function mutations has been conducted in E. coli for general stress or chemical resistance. Therefore, significant opportunity remains to identify genes that are detrimental to fitness under industrially relevant stress conditions and to develop a more targeted approach to engineer more-resistant industrial platform strains by combining multiple mutations found in screening studies under one or more conditions.
Recent years have also seen the development of a general technique, here referred to as Tn-Seq, where next-generation sequencing is applied to a high-density Tn library to identify all Tn insertion sites present in a library in a single experiment. Tn-Seq has proven to be a powerful method for the determination of conditionally essential genes in microbes without the need to create knockout mutant collections (32, 33). There are different variants of Tn-Seq, but they all rely on growing a transposon insertion library under a selective condition for a short time period, isolating genomic DNA from the population, and preparing a DNA sequencing library enriched in transposon-chromosome junctions which enable mapping of insertion locations in the entire population onto the genome. The number of insertions in each gene can then be determined under the selection condition versus a control condition, providing an estimate for the relative fitness of each loss-of-function mutant under the two conditions (34). Genes required for growth under a particular condition are specifically depleted in insertions and thus determine the genetic basis for resistance toward that condition in the particular strain background. At the same time, genes that are specifically enriched in insertions correspond to candidate condition-dependent beneficial loss-of-function mutations. This approach allows replacement of the labor-intensive process of screening for individual Tn mutants and identifying the insertion locations, while also enabling more thorough discovery of beneficial insertions. Tn-Seq has previously been used to determine genes that rendered Salmonella enterica serovar Typhi resistant to lysis following the addition of a Vi bacteriophage (78) and to determine loss-of-function mutations that were transduced using P1vir from the Keio collection (35) to E. coli K-12 MG1655 ΔlacZ which improved growth on several amino acids as a sole carbon source (23).
In this work, six different wild-type and laboratory E. coli strains [K-12 MG1655, K-12 W3110, BL21(DE3), W, C, and Crooks; Table 1] were first characterized for their growth behavior under controlled conditions by the addition of stressors during the mid-exponential phase of growth. Two strains, W and BL21(DE3), were selected as background strains for construction of Tn5 insertion libraries due to their reasonable resistance toward multiple stresses while also having publicly available, well-annotated genome sequences. Tn library selections were performed under selected conditions (Fig. 1) in order to isolate insertion mutants possessing improved growth properties, and corresponding individual and combinatorial loss-of-function mutants possessing improved growth properties were discovered for both strains under specific conditions. In addition to targeted identification of Tn5 insertions in specific isolates, a parallel effort was conducted to identify the population frequencies of genome-wide Tn insertion sites following short-term selections of libraries in W and BL21(DE3) strain backgrounds in 0.5 to 0.6 M NaCl using Tn-Seq. To our knowledge, this is the first study where Tn-Seq is used to study the effects of strain background on loss-of-function mutants, especially in the context of industrially relevant stresses.
TABLE 1.
Major strains and plasmids used in this studyd
| Strain or plasmid | Relevant genotype/propertya | Source/referenceb |
|---|---|---|
| Strains | ||
| DH5α | F− endA1 glnV44 thi-1 recA1 relA1 gyrA96 deoR nupG ϕ80dlacZΔM15 Δ(lacZYA-argF)U169 hsdR17(rK− mK+), λ− (DSMZ 6897) | DSMZ |
| K-12 MG1655 | F− λ− ilvG rfb-50 rph-1 | A. Feist, UCSDc |
| K-12 W3110 | F− λ− rph-1 INV(rrnD rrnE) (DSMZ 5911) | DSMZ |
| BL21(DE3) | F− ompT gal dcm lon hsdSB(rB− mB−) λ(DE3 [lacI lacUV5-T7 gene 1 ind1 sam7 nin5]) | Invitrogen |
| W | F−, soil isolate, harbors pRK1 and pRK2 (ATCC 9637/DSMZ 1116) | DSMZ |
| C | F−, wild type (Migula 1985) (ATCC 13706/DSMZ 4860) | DSMZ |
| Crooks | Wild-type fecal isolate (ATCC 8739/DSMZ 1576) | DSMZ |
| BW25113 | K-12 derivative, lacIq rrnB3 F− Δ(araD-araB)567 ΔlacZ4787(::rrnB-3) λ− rph-1 Δ(rhaD-rhaB)568 hsdR514 | 35 |
| Plasmids | ||
| pCP20 | Carries yeast FLP recombinase under constitutive promoter, pSC101 origin, λ cI857+ λ pR Repts Ampr Cmr | 41 |
| pKD46 | λ Red under PBAD promoter, pSC101 origin, Ampr Repts | 39 |
| pSIM5 | λ Red under temperature-inducible promoter, pSC101 origin, Cmr Repts | 40 |
Abbreviations: Amp, ampicillin; Cm, chloramphenicol; r, resistance; ts, temperature sensitive.
DSMZ, Deutsche Sammlung von Mikroorganismen und Zellkulturen GmbH.
This strain was generously donated by Adam Feist, University of California, San Diego. It is the designated BOP27 strain (http://gcrg.ucsd.edu/BOP27_sequence), which has resequenced alleles identical to those present in ATCC 47076.
Additional strains are shown in Table S1 in the supplemental material.
FIG 1.

Schematic illustrating the experimental strategy utilized in this study. Liquid cultures of Tn5 insertion libraries in E. coli W and BL21(DE3) were either directly spread on plates containing different stressors or inoculated into liquid cultures with different stressors, serially passaged for several days, and then spread onto plates. Alternatively, short-term selections of Tn5 libraries were performed in M9 containing high salt concentrations. Colonies growing more rapidly and appearing larger than the majority of background colonies on plates following plate or liquid culture selections were then selected and screened in liquid culture, and hits were analyzed to determine Tn5 insertion locations. From the short-term selections on NaCl, insertions were also determined at the population level by transposon insertion sequencing (Tn-Seq). Clean deletion strains were constructed and tested for individual isolates; for clean knockout mutants still possessing improved growth (increased growth rate and decreased lag time), all combinations of double deletion mutants were constructed and tested; and finally, selected triple deletion mutants were constructed and tested.
MATERIALS AND METHODS
Chemicals, reagents, and oligonucleotides.
All chemicals and media were purchased from Sigma-Aldrich Denmark (Copenhagen, Denmark) unless otherwise specified. PCR and plasmid purification kits were purchased from Macherey-Nagel (AH Diagnostics, Aarhus, Denmark). Oligonucleotide primers and adapters were purchased from Integrated DNA Technologies (IDT; Leuven, Belgium) (see Table S1 in the supplemental material).
Cell cultivation under stress conditions.
Starter cultures of each strain (Table 1) were inoculated from single colonies on LB agar plates into 2 ml of M9 medium (15 g/liter agar, 12.8 g/liter Na2HPO4 · 7H2O, 3.0 g/liter KH2PO4, 0.5 g/liter NaCl, 1.0 g/liter NH4Cl, 2 mM MgSO4, 0.1 mM CaCl2) supplemented with 0.4% (wt/vol) glucose, 2 μM thiamine HCl, 60 μM FeCl3, 1.8 mg/liter ZnSO4 · 7H2O, 1.2 mg/liter CuCl2 · 2H2O, 1.2 mg/liter MnSO4 · H2O, and 1.8 mg/liter CoCl2 · 6H2O. Biological triplicates derived from different colonies were cultivated for each strain at 37°C with 250 rpm shaking. After 14 to 18 h, wells of a BioLector 48-well FlowerPlate without optodes (m2p-labs GmbH, Baesweiler, Germany) containing between 1.2 and 1.4 ml of M9 medium (such that the final volume after any later additions to the medium would equal 1.4 ml) were inoculated to an initial optical density at 600 nm (OD600) of 0.05 and incubated in a BioLector microbioreactor system (m2p-labs GmbH) at 37°C with 1,000-rpm shaking until a detectable increase in light backscatter was detected. This occurred at approximately 5 h for strains K-12 MG1655 and W3110 and after 3.5 h for BL21(DE3), W, C, and Crooks and corresponds to the mid-log phase of growth. At this time, stock concentrations containing 100 g/liter sodium acetate, 4 M sodium chloride, or 3% (vol/vol) hydrogen peroxide were added to achieve the maximum tested concentrations, with the addition of water up to the maximum added volume for concentrations lower than the maximum. To test growth at low pH, cultures were initially grown in 10 ml of supplemented M9 medium. When cultures reached mid-log phase with an OD600 of 0.5 to 1.0, aliquots of cell culture were transferred to microcentrifuge tubes, centrifuged for 2 min at 16,000 × g, and resuspended in an equivalent volume of M9 medium adjusted to different pH values using HCl or nonadjusted M9 medium at pH 7.0 for control cultures.
Tn5 mutant library construction.
Aliquots of electrocompetent Escherichia coli W and BL21(DE3) (Table 1) were electroporated (1.8 kV, 0.1-cm gap) with 1 μl of transposase-transposon complex from the EZ-Tn5 <R6Kγori/KAN-2> transposome kit (Epicentre, Madison, WI) and outgrown for 1.5 h in 1 ml of SOC medium (Super Optimal Broth with catabolite repression). To assess the approximate number of transposon insertions per ml of population, 1 μl and 10 μl were plated on LB agar plates containing 25 μg/ml kanamycin and colonies were counted after overnight incubation at 37°C. To generate liquid Tn5 insertion libraries, 0.7 ml of outgrowth was transferred to 50 ml of LB broth supplemented with 0.5 mM magnesium sulfate and 25 μg/ml kanamycin and grown overnight in a 37°C shaking incubator at 250 rpm. As controls, nontransformed cells were added in the same proportion to separate flasks. After overnight incubation, the OD600s of W and BL21(DE3) transformed with the transposome kit were 5.13 and 4.80, respectively. The nontransformed controls had OD600 values of 0.220 and 0.080, respectively. To minimize carryover of non-kanamycin-resistant cells, all subsequent cultivations were performed in the presence of 25 μg/ml kanamycin.
Tn5 mutant library selections.
Selective M9 minimal agar plates (composition as described previously for M9 medium, with the addition of 15 g/liter agar and 25 μg/ml kanamycin) were prepared containing either 15 g/liter sodium acetate, an additional 0.6 M NaCl, HCl to pH 5.5 plus an additional 0.4 M NaCl, 5 g/liter sodium acetate plus an additional 0.4 M NaCl, or HCl to pH 4.5. Nonselective plates did not include any additional components. Volumes of HCl to add to achieve the final desired pH for low-pH plates were first determined by a volumetric titration in the supplemented M9 minimal medium. The molten agar containing all components and additional HCl for pH adjustment was verified to be in the correct pH range (±0.25 pH units) using colorimetric pH test strips.
For immediate growth on selective plates, 10 μl of each 105-diluted overnight liquid Tn5 library culture in phosphate-buffered saline was spread plated on 20 M9 agar plates for each selection condition. To begin liquid culture passaging with the goal of enriching desirable growth phenotypes in the population prior to plating, 2.5 ml of M9 minimal medium containing 25 μg/ml kanamycin with or without selective conditions in 24-well deep-well plates was inoculated to an OD600 of 0.05 from the overnight liquid Tn5 library cultures. Optical densities at 630 nm were monitored on a BioTek ELx808 plate reader (Winooski, VT) using 100 μl of culture in a 96-well microtiter plate. Once saturation or near-saturation was reached, 25 μl of culture was transferred to 2.475 ml of fresh medium. After reaching saturation following either 7 total passages or 9 days, whichever came sooner (each passaging profile is provided in Fig. S13 in the supplemental material), a sufficient volume of diluted cells from one replicate culture was plated onto 5 selective plates such that approximately 200 to 500 colonies would be expected on each plate. Colonies appeared on nonselective M9 agar plates after less than 24 h of incubation at 37°C for strain W and after less than 48 h of incubation for BL21(DE3). Colonies that appeared significantly larger than the predominant colony size distribution were restruck on LB agar plates containing 25 μg/ml kanamycin for future secondary screening. No larger colonies were visible without passaging for either the W or BL21(DE3) library grown on plates containing 15 g/liter sodium acetate, the W library grown on plates containing 5 g/liter sodium acetate and 0.4 M NaCl, the W library grown on plates at pH 4.5, or the BL21(DE3) library grown on plates at pH 5.5 containing 0.4 M NaCl. No growth was observed after 1.5 weeks for passaged libraries of BL21(DE3) on plates containing 0.6 M NaCl or plates at pH 4.5.
For short-term selections for Tn-Seq, cryogenic 1-ml stocks of each library stored in LB plus 15% glycerol were thawed, centrifuged at 4,000 × g for 2 min, and resuspended in 1 ml of fresh LB medium. A 250-ml shake flask containing 50 ml of LB plus 25 μg/ml kanamycin was inoculated with the resuspended cells and cultivated at 37°C with 250-rpm shaking. The following day, 2 ml of the overnight cultures was resuspended twice in 2 ml of M9 medium following centrifugation at 4,000 × g for 2 min and removal of the supernatant. The resuspended cells were used to inoculate 250-ml flasks containing 50 ml of M9 medium or M9 plus added stressors. A reduced concentration of 0.5 M NaCl was used for BL21(DE3) to achieve a selection profile similar to that for W in 0.6 M NaCl. At an OD600 of 2 to 3, 2 OD/ml of culture was harvested and spun down at 16,000 × g for 2 min. The supernatant was removed, and cell pellets were stored at −20°C.
Identification of individual Tn5 insertion sites.
Saturated overnight cultures were grown in LB medium for each transposon insertion mutant, and genomic DNA was extracted from cell pellets using either the QIAamp DNA minikit (Qiagen, Valencia, CA) or the PureLink genomic DNA minikit (Life Technologies Europe, Nærum, Denmark). Tn5 insertion sites were determined by a single-primer PCR method (36) using OneTaq 2× master mix (New England BioLabs, Ipswich, MA), 50 ng of genomic DNA template, and 10 μM primer. Single primers were designed for PCR amplification outward from either the 5′ or the 3′ end of the Tn5 cassette (see Table S1 in the supplemental material, primers 1 to 6). The thermal cycling program consisted of initial denaturation (94°C for 2.5 min), followed by a specific first-strand amplification cycle (30 cycles of 94°C for 2.5 min, 94°C for 30 s, 55°C for 30 s, and 68°C for 3 min), a nonspecific priming cycle (30 cycles of 94°C for 30 s, 30°C for 30 s, and 68C° for 2 min), and another specific amplification cycle (the same as the first cycle). The PCR products were column purified and sequenced using the KAN-2 FP-1 primer provided with the EZ-Tn5 <R6Kγori/KAN-2> transposome kit. When the originally selected primer did not result in a clean product extending over the Tn5-chromosome junction, different single primers were tried until a suitable product was obtained. This is likely a result of the lack of suitable nonspecific primer binding sites 5′ to the junction. The sequence immediately downstream of the 5′ end of the Tn5 cassette was identified by a BLAST search against the full genome of the host strain. All initial determinations of Tn5 insertion sites were confirmed by colony PCR with primers designed to flank the Tn5 insert (see Table S1, primers 7 to 64).
DNA library generation for transposon insertion sequencing.
Genomic DNA was isolated from frozen cell pellets using the PureLink genomic DNA minikit (Life Technologies) according to the manufacturer's guidelines, with elution in 200 μl elution buffer. The genomic DNA was further concentrated and purified by ethanol precipitation. Two volumes of ice-cold 96% ethanol and 1/10 volume of 2.6 M sodium acetate, pH 5.2, were added, and samples were incubated for 30 min at −80°C. The samples were then centrifuged at 13,000 rpm for 30 min at 4°C, and the pellet was washed twice with 1 ml of 70% ethanol followed by centrifugation at 13,000 rpm for 5 min at 4°C. Supernatants were discarded, and the pellets were dried for 10 min at room temperature and resuspended in 25 to 100 μl of Tris-EDTA (TE) buffer depending on the concentration determined prior to precipitation. Genomic DNA concentrations used to calculate input DNA for library preparation were quantified using a Qubit broad-range double-stranded DNA (dsDNA) assay (Invitrogen).
Library preparation for transposon insertion sequencing closely followed the HITS protocol (37) with modifications allowing compatibility with current Illumina flow cells. Briefly, 3 μg of genomic DNA diluted in 55 μl TE buffer was sheared in Covaris microtubes on a Covaris E220 ultrasonicator (Woburn, MA) with 10% duty factor, 175 peak incident power, 200 cycles/burst, and 50-s duration under frequency sweeping mode at 5.5 to 6°C (Covaris recommendations for a 300-bp average fragment size). The resulting DNA fragments were end repaired with the NEBNext end repair module (New England BioLabs), dA-tailed using Klenow fragment (exo−) (Thermo Scientific), and immediately ligated to adapters using the NEBNext quick ligation module (New England BioLabs). Products were column purified following end repair and dA-tailing with the Macherey-Nagel NucleoSpin gel extraction and PCR purification kit. Indexed adapter sequences (169 to 174 in Table S1 in the supplemental material; from Illumina, Inc.) were synthesized with 5′ phosphorylation and purified by high-performance liquid chromatography (HPLC) by IDT. The portion of the universal adapter complementary to the indexed adapter (UAD_tail) was synthesized with a 3′-phosphorothioate linkage and HPLC purified by IDT. The remainder of the universal adapter is later added during the PCR enrichment step, to allow efficient PCR amplification of transposon-chromosome junctions. Following adapter ligation, products in the 200- to 400-bp size range were gel extracted from 2% low-melting-point agarose Tris-acetate-EDTA (TAE) gels containing 0.01% SYBR Gold (Invitrogen) and column purified following room-temperature gel digestion with a NucleoSpin kit. PCR enrichment was performed using 100 ng of purified adapter-ligated DNA, 1.5 μl of 10 μM Tn5-specific forward primer (primer 166 in Table S1) and 0.75 μl of 20 μM reverse primer (primer 167 in Table S1) in a 50-μl total reaction mixture using Phusion Hot Start DNA polymerase (Thermo Scientific). The Tn5-specific forward primer was synthesized with a 5′-biotinylation and a tetraethylene glycol linker and HPLC purified by IDT. The first 58 bases regenerate the universal adapter, and the remaining 23 bases are complementary to a region on the 5′ terminus of the EZ-Tn5 <R6Kγori/KAN-2> transposon. PCRs were run with the following thermal cycler program: 98°C for 30 s; 18 cycles of 98°C for 10 s, 64.5°C for 30 s, and 72°C for 30 s; 72°C for 5 min; and a hold at 4°C. The annealing temperature of 64.5°C was determined to yield the largest amount of product in preliminary optimization. PCR products were gel extracted again in the 200- to 500-bp range and column purified. To enrich in DNA containing transposon-chromosome junctions, biotinylated DNA fragments were affinity captured using Dynal MyOne streptavidin C1 beads (Invitrogen) according to the manufacturer's instructions. Single-stranded DNA complementary to the captured biotinylated strand was eluted following washing of the beads in SSC buffer (0.15 M NaCl, 0.015 M sodium citrate, adjusted to pH 7.0 with NaOH) and incubation in 0.15 M sodium hydroxide for 10 min. The supernatants from two elutions were collected (100 μl total) and neutralized by addition of 4.4 μl 10× TE buffer, pH 7.5, and 2.6 μl of 1.25 M acetic acid; column purified using the Macherey-Nagel NucleoSpin kit; and eluted in 15 μl of 10 mM Tris-Cl, pH 8.5.
Transposon-chromosome junction library sequencing and data analysis.
Single-stranded libraries were quantified using the Kapa Library Quantification kit-Illumina/Universal (Kapa Biosystems, Wilmington, MA) according to the manufacturer's directions using 1:100 and 1:1,000 dilutions of each single-stranded DNA (ssDNA) library in 10 mM Tris-Cl, pH 8.0, plus 0.05% Tween 20 as the templates. ROX low dye was also added to each quantitative PCR (qPCR) mixture as specified by the manufacturer's directions. SYBR green fluorescence was monitored on a Stratagene Mx3005P qPCR system (Agilent Technologies, Santa Clara, CA), and cycle threshold (CT) values were calculated by MxPro software. Average ssDNA library sizes, which were needed to calculate size-adjusted concentrations by qPCR, were determined using the Agilent RNA 6000 Pico kit on an Agilent 2100 Bioanalyzer. For multiplex sequencing in groups of 8, 0.855 nmol of each DNA library was directly pooled, heat denatured in a 95°C heat block for 1 min, and immediately chilled in an ice-water bath. Buffer HT1 (Illumina, San Diego, CA) was added up to a final volume of 570 μM. Due to the Tn5 libraries being low-diversity libraries due to many bases of anticipated identical sequence at the 5′ terminus, 30 μl of Phi-X control (Illumina) was added to the pooled libraries, and the entire volume was loaded onto the flow cell provided in the MiSeq Reagent kit v2, subjected to 300 cycles (Illumina), and sequenced on a MiSeq sequencing system.
Read 1 (universal adapter end) sequencing files in fastq format were trimmed to a total length of 67 bp (42 bp of Tn5-specific sequence and 25 bp of genomic sequence), with reads shorter than 67 bp being discarded. The trimmed fastq files were uploaded for analysis using ESSENTIALS software (http://bamics2.cmbi.ru.nl/websoftware/essentials/essentials_start.php) (38). Up to 3 mismatched nucleotides were tolerated in the Tn barcode sequence, and a minimum 20-nucleotide sequence match was required for alignment. Insertions were ignored near the 3′ ends of genes, and gene-level insertion counts were normalized across samples using trimmed mean of M values (TMM). P values were calculated using the quantile-adjusted conditional maximum likelihood method (qCML) and adjusted with either the Benjamini-Hochberg or Bonferroni correction as specified. Genome annotations used to identify specific loci were based on publicly available sequences (GenBank accession numbers NC_012971 and NC_017635) with some additions. Protein-coding genes annotated in the K-12 MG1655 genome (NC_000913) were first aligned against the W and BL21(DE3) genomes using Standalone BLAST. When significant similarity existed for a gene not annotated in W or BL21(DE3), the presence of an open reading frame (ORF) with approximately the same coordinates was ascertained using CLC Genomics Workbench (CLC Bio, Århus, Denmark). If an identical or very similar ORF was present, the gene was added to the annotation. This was necessary due to numerous updates to annotation of the K-12 MG1655 GenBank accession that have not subsequently been updated in the GenBank accessions of other strains.
Secondary and tertiary screening of Tn5 library isolates.
Larger colonies isolated from both nonpassaged and passaged liquid culture Tn5 libraries were first grown as single replicates under the original selective condition from which the mutant was isolated, under deconvoluted individual conditions for mutants isolated from combined stress conditions (15 g/liter sodium acetate, 0.4 M NaCl, and/or pH 5.5), and at lower concentrations than the original stressor for mutants isolated from single-stress conditions (0.4 M NaCl and/or pH 5.5) in a BioLector microbioreactor system. The total culture volume used was 1.4 ml (volume of inoculated cells plus 1× medium) in baffled FlowerPlates, with 1,000-rpm shaking at 37°C. Tertiary screening with biological triplicate cultures was then conducted for mutants with improved growth rates or reduced lag times under any condition tested during secondary screening. For tertiary screening, 2× M9 medium with different stressors was used to allow precise control of both the inoculum size and the final concentration of each component. The pH of the low-pH 2× medium was verified for each preparation to have the correct pH when diluted 2× with M9 medium. The same procedure was used to test growth of clean single, double, and triple knockout strains.
Determination of growth parameters.
To determine growth rates, lag times, and final cell densities (measured in light backscatter units) from BioLector growth curves, light backscatter intensities in all growth experiments were first background subtracted by subtracting the minimum light backscatter intensity in a particular well from all intensities for that experiment. The natural logarithm of the subtracted light backscatter intensity was plotted versus time (in hours), the linear region corresponding to the time range over which exponential growth occurred was manually selected, and a linear regression was performed. The slope was taken as the growth rate hour−1, while the x intercept was taken as the lag time in hours. Final densities were averaged over a manually selected region (typically up to a maximum of 24 h, but often for longer time periods specified in the supplemental material for single knockout mutant growth experiments) over which cell densities were saturated (approximately constant). When cell densities had an increasing or decreasing trend around the final time point, only the 2 to 3 final measurements were averaged. All calculations were facilitated by custom MATLAB scripts implementing graphical user interfaces. All calculated P values for growth parameters of mutant strains are based on a two-tailed Student t test assuming unequal variance, with growth parameters independently calculated for each biological replicate. A description of the error analysis for the growth parameters presented for characterization of background strains is provided in the supplemental material.
Construction of single- and multiple-gene deletion strains.
Single-gene deletions were constructed in strains W and BL21(DE3) using λ Red-mediated recombination with plasmids pSIM5 and pKD46, respectively (see Table S2 in the supplemental material) (39, 40). Linear DNA cassettes containing a kanamycin resistance gene flanked by FLP recombination target (FRT) sites were amplified from strains in the Keio collection (35), sometimes with modifications to avoid known mutations relative to W or BL21(DE3) or with homologous flanking regions added by PCR (see Table S1), and electroporated into strains expressing λ Red by either elevated temperature induction at 42°C or addition of 0.2% l-arabinose at an OD600 of approximately 0.2. Colonies harboring the insertion in the correct location as determined by colony PCR were cured of plasmid pSIM5 or pKD46 by 37°C incubation on plates. Kanr cassettes were subsequently removed by transformation of pCP20 (41) harboring FLP recombinase, and colonies were cured of pCP20 by 40°C incubation on plates. An exception was the nanM gene, for which BL21(DE3) nanM::kan was tested due to sequenced mutations in one FRT site in the Keio collection strain from which the cassette was amplified.
Double gene deletion strains of E. coli W (see Table S2 in the supplemental material) were generated by retransforming pSIM5 into single-deletion strains and repeating the process described above. The kan insertion was left intact except in strains targeted for triple gene deletions, where the cassette was looped out by transformation with pCP20 and subsequently cured out. Triple insertion strains were generated with the same procedure, with the final kan insertion left in the chromosome (see Table S2). All modified loci in each strain (i.e., 2 or 3 loci for each double or triple deletion strain) were confirmed to have the correct size by colony PCR amplification of colonies transformed with the linear cassette and on colonies following transformation of pCP20. All single-and multiple-gene deletion strains were tested as described for the tertiary screening of Tn5 insertion mutants above.
RESULTS
Characterization of wild-type strains.
The impact of several stresses expected to be encountered under industrial fermentation conditions on growth of six strains of E. coli [K-12 MG1655, K-12 W3110, BL21(DE3), W, C, and Crooks] was determined as described in Materials and Methods. The six selected individual stresses were high acetate concentration, high glucose concentration, high NaCl concentration (due to the need to neutralize acids produced as fermentation products or by-products), addition of H2O2, elevated temperature, and reduced pH. In addition, two combinatorial stresses were screened: high acetate and NaCl concentrations and low pH and high NaCl concentration. These combinations of conditions were chosen because E. coli produces acidic by-products (primarily acetate) during aerobic fermentation which need to be neutralized by a base such as NaOH, which can result in simultaneous acid and osmotic stress under nonideal mixing conditions (1, 2, 42). The BioLector minibioreactor system, which allows for sufficient oxygen transfer rates to support fully aerobic growth of E. coli (43), was employed for all growth measurements. This system also enables relative quantification of biomass at optical densities above the linear range achievable by most absorbance measurements, due to its use of light backscatter as a measure of cell density (43). Averaged background-subtracted growth curves between three replicate cultures for each strain and condition are provided in the supplemental material (see Fig. S1 to S8).
There were significant differences in stress tolerance between the six strains as measured by either relative change in growth rate (Fig. 2) or final cell density (Fig. 3) normalized to the nonstressed condition. Absolute growth rates and final densities for each condition are provided in the supplemental material (see Fig. S9 to S11). With increasing NaAc concentrations (Fig. 2A and 3A), the growth rate decreases in all strains except BL21(DE3), which exhibits an optimal growth rate in the presence of an additional 2.5 g/liter NaAc. K-12 MG1655 exhibits the largest reduction in growth rate with increasing acetate concentrations, while the closely related K-12 W3110 strain exhibits a smaller reduction in growth rate. When glucose is consumed, acetate can be utilized as a carbon source and reassimilated to generate more biomass. Crooks exhibits the highest efficiency of acetate assimilation to biomass, followed by BL21(DE3) and W, which exhibit modest increases in cell density in medium containing up to 7.5 g/liter NaAc. K-12 strains MG1655 and W3110, as well as strain C, do not effectively reassimilate the additional acetate to biomass. Variations in strain behavior were also observed when increasing the initial glucose concentration (Fig. 2B and 3B). While K-12 MG1655 and W maintain approximately the same growth rate between 0.4 and 6% (wt/vol) glucose, K-12 W3110 and C exhibit monotonically decreasing growth rates, while Crooks exhibits an optimal growth rate at 3% (wt/vol) glucose. K-12 MG1655, K-12 W3110, and C also poorly convert the extra glucose to biomass, whereas BL21(DE3) accumulates more biomass as a function of initial glucose concentration and Crooks accumulates the highest biomass at 2% glucose.
FIG 2.
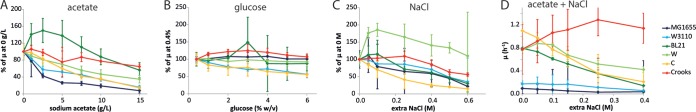
Normalized growth rates (μ) (A to C) or growth rates (D) for six strains of E. coli grown in M9 plus 0.4% glucose and exposed during mid-log phase to the different stressors indicated, with the exception of high glucose concentrations (B), which were present from inoculation. Normalized growth rates were normalized to the growth rate measured when no stressor was present. Error bars indicate propagated standard errors using measurements from three (occasionally two) biological replicates. (A) Addition of sodium acetate to final concentrations between 0 and 15 g/liter. (B) Presence of concentrations of glucose between 0.4% and 6% (wt/vol) upon inoculation. (C) Addition of extra sodium chloride (beyond that present already in M9 medium) to final concentrations between 0 and 0.6 M. (D) Addition of 5 g/liter sodium acetate and extra sodium chloride between 0 and 0.4 M.
FIG 3.
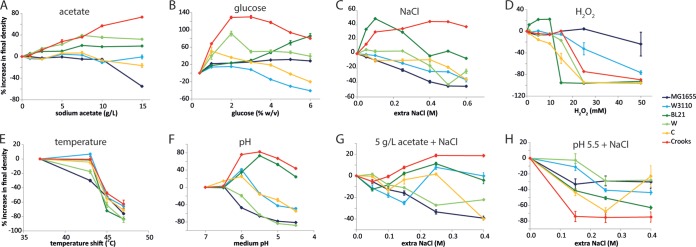
Percent increase in final cell density (as measured by light backscatter intensity) for six strains of E. coli grown in M9 plus 0.4% glucose and exposed during mid-log phase to the different stressors indicated, with the exception of high glucose concentrations (B), which were present from inoculation. Error bars indicate propagated standard errors using measurements from biological replicates. (A to C) As described in Fig. 2 legend. (D) Addition of hydrogen peroxide to final concentrations between 0 and 50 mM. (E) Shift to temperatures between 37°C (no shift) and 47°C. (F) Transfer of cells to M9 medium with pH values between 4.5 and 7. (G) Addition of 5 g/liter sodium acetate and extra sodium chloride between 0 and 0.4 M. (H) Shift to M9 acidified to pH 5.5 and with addition of extra sodium chloride between 0 and 0.4 M.
Under high-salt conditions (Fig. 2C), all strains exhibit decreased growth rates with increasing concentrations, with the exception of W, which increased in growth rate with up to 0.1 M NaCl added to the culture. While E. coli C has the largest drop in growth rate when normalized to the growth rate without extra added NaCl, its absolute growth rate is significantly higher than those of the K-12 strains and BL21(DE3) at up to 0.25 M NaCl (see Fig. S9 in the supplemental material). W maintains the highest relative growth rates at high salt concentrations, with Crooks exhibiting the second highest osmotolerance. During the entry to stationary phase, large variations in light scattering (manifested by large standard deviations about the means of the light scattering intensities) were observed in strain W grown with 0.4 to 0.6 M NaCl. These were attributed to a transient aggregation phenomenon, which was confirmed by phase-contrast microscopy (see Fig. S12).
Addition of H2O2 (Fig. 3D; see also Fig. S9 in the supplemental material) was extremely deleterious to strain BL21(DE3), which could not grow above 10 mM. While Crooks could maintain growth for a very short time after the addition of 25 mM or higher H2O2 concentrations, growth ceased thereafter, and very low final densities were reached. K-12 MG1655, after a brief lag phase, could grow with the addition of 25 mM H2O2, exceeding the threshold of other strains (Fig. 3D; see also Fig. S4). Shift to high temperature (Fig. 3E) generally induced a cessation of growth, with the final cell density reduced at higher temperatures. Interestingly, K-12 W3110 had no decrease in cell density with a 43°C shift, while the final density of the closely related K-12 MG1655 strain decreased substantially. Upon a shift to reduced pH (Fig. 3F), a similar phenomenon is observed when comparing K-12 strains MG1655 and W3110. The behavior of C was qualitatively similar to that of K-12 W3110. Under the low-pH condition, Crooks and BL21(DE3) exhibited apparent large increases in cell density that appeared to be artifacts of the light backscatter measurements or due to altered cellular morphology (see Fig. S6).
The effect of combinations of stresses generally trended as expected based on the effects of the individual stresses on each strain. In 5 g/liter NaAc with variable concentrations of NaCl (Fig. 2D and 3G), the K-12 strains exhibited the lowest absolute growth rates, with W, C, and BL21(DE3) exhibiting 4- to 6-fold-higher growth rates in nearly all NaCl concentrations (see Fig. S9 in the supplemental material), and Crooks maintained the most robust behavior under the combined stresses, with the highest absolute growth rates and no drop in growth rate with increasing NaCl. At low pH (5.5 or 4.5) with variable concentrations of NaCl, growth often ceased shortly after resuspension of the cultures, rendering it difficult to determine growth rates (Fig. 3H; see also Fig. S8). BL21(DE3) and Crooks exhibited elevated light backscatter measurements at low pH without additional NaCl as had previously been observed; however, readings returned to much lower values with additional NaCl. At both pH 5.5 and pH 4.5, W had the smallest decrease in final cell density with increasing NaCl.
Selection and screening of mutants with improved growth under high-stress conditions.
In order to isolate loss-of-function mutations with improved growth under stress conditions, Tn5 libraries were constructed in W and BL21(DE3)—two strains that exhibited elevated stress tolerance under high-salt and high-acetate conditions, respectively. The W Tn5 library was estimated to contain 86,000 insertion mutants, and the BL21(DE3) Tn5 library was estimated to contain 18,000 insertion mutants. Following either direct plating of Tn5 libraries or plating of serially passaged libraries (see Fig. S13 in the supplemental material), faster-growing colonies appeared on plates after various periods of time for each strain and condition (see Fig. S14), and in general the time for colonies to appear was reduced or remained the same after serial passaging. Various numbers of larger colonies were identified for each strain and condition either by direct plating or after serial passaging (see Table S3). For strain W, larger colonies were obtained for more conditions when serially passaged Tn libraries were plated. Interestingly, despite growth in liquid culture, no colonies appeared after 7 days of incubation for the serially passaged BL21(DE3) Tn5 library on 0.6 M NaCl, pH 4.5, and pH 5.5 plus 0.4 M NaCl plates. It is surmised that these populations became enriched in mutants that were unculturable on solid media. Single biological replicates propagated from the larger colonies identified above were screened in liquid medium under the same selection condition to verify if the plate phenotype also manifested in liquid culture. Qualitatively improved growth characteristics were observed for various numbers of mutants of each strain isolated under each condition (see Table S4). All mutants isolated from pH 4.5 plates were false positives in liquid culture screening, and it is surmised that colonial growth confers a stronger tolerance toward low pH that is not representative of conditions in liquid media.
Forty-eight Tn5 insertion mutants that passed the secondary liquid culture screening were tested for growth characteristics in biological triplicates in tertiary liquid culture screening. The results are summarized in Fig. 4, with the percent increase in growth rate or percent decrease in lag time against the background strains W or BL21(DE3) indicated. Multiple insertions were isolated in several genes and operons, including rfe, slp-dctR, evgSA, yobF, and ptsP in W. Many isolated mutants from serially passaged cultures also harbored identical insertions, including ygjI in BL21(DE3) and nagC and ygaH in W. Insertions in two mutants were located in annotated promoter regions of yobF and evgA. One insertion was located in an intergenic region between yliD and yliE in BL21(DE3), while one insertion was located in ECW_P1m0088, a gene of unknown function located on the native plasmid pRK1 in strain W. Notable trends include many insertion mutations that both improve the growth rate and reduce the lag time of W grown at pH 5.5 plus 0.4 M NaCl and many insertions that reduce the lag time of BL21(DE3) in either 15 g/liter NaAc or 5 g/liter NaAc plus 0.4 M NaCl.
FIG 4.

Identification of Tn5 insertion locations in mutant strains of W and BL21(DE3) isolated as possessing improved growth in liquid culture secondary screening over the original background strains. The percent increase in growth rate and percent decrease in lag time are displayed for biological triplicates of each mutant. Genes are grouped (gray or white shading) by the strain and selection condition from which insertion mutants were isolated. Values followed by an asterisk are significant with a P of <0.05. The color scale indicates the magnitude of the percent improvement, and a key is shown to the right of the table. Rows with bold text indicate genes which are further analyzed as clean deletion mutants.
Tn-Seq for high-throughput discovery of beneficial loss-of-function mutations.
In order to provide an alternative high-throughput genome-wide approach to rapidly discover gene deletions that improve growth under a given stress condition, we employed the Tn-Seq method as described in Materials and Methods. A new Tn5 library was prepared in BL21(DE3) to achieve a higher level of diversity than that previously described, with an estimated ∼50,000 unique insertions from plate counts. Tn5 libraries of BL21(DE3) and W were grown in M9 and M9 plus high NaCl [0.6 M for W and 0.5 M for BL21(DE3)] in biological triplicates for each condition (see Fig. S15 in the supplemental material). Genes enriched in Tn5 insertions in M9 plus NaCl compared to M9, corresponding to potential beneficial loss-of-function mutations, are shown for each strain in Table 2 (genes common to the two strains) and Table 3 (genes specific to one of the strains). Genes depleted in insertions (see Tables S5 through S7) are also of interest as they correspond to genes involved in common or divergent mechanisms that provide resistance to high salt concentrations in the two strain backgrounds. However, since this study is primarily focused on the identification of mutations that improve stress tolerance beyond the wild-type strain level, a more extensive analysis of these deleterious loss-of-function mutations is not performed here. Many of the beneficial Tn5 insertions identified above from single isolates under the high-salt condition (Fig. 4) were also identified in the Tn-Seq analysis (Tables 2 and 3). Notably, rfe exhibits the second highest enrichment of insertions of any gene in W under high-salt conditions, with an average of a 15.3-fold enrichment. The only W mutants with improved growth characteristics in M9 plus 0.6 M NaCl isolated after short-term selections on plates had insertions in this gene. Also noteworthy is that insertions in nagC and nagA are enriched 8.7-fold and 3.0-fold, respectively. Strains with insertions in these genes were isolated only after serial culture passaging and subsequent plating. In contrast, insertions in rfe, nagC, and nagA were not significantly enriched in BL21(DE3) grown in M9 plus 0.5 M NaCl. However, insertions in proV were 2.9-fold enriched, and this was the only gene with an insertion isolated with improved growth in the original screen (Fig. 4). Insertions in proW and proX, encoding the other subunits of the ProVWX glycine betaine transporter, were also enriched 3.3- and 2.2 -fold, respectively. Similarly, insertions in proV were enriched only 1.5-fold in strain W, while insertions in proW and proX were not significantly enriched (with a P of <0.05). As all genes harboring insertions in the original screen under the same condition (high NaCl; Fig. 4) were also identified as being enriched in insertions at the population-wide level, Tn-Seq appears to be a promising technique for rapidly and comprehensively determining beneficial loss-of-function mutations in a given strain background.
TABLE 2.
Genes enriched in insertions in both W and BL21(DE3) compared to M9 growth following short-term selection of Tn5 libraries in M9 plus high NaCl concentrations [0.6 M for W and 0.5 M for BL21(DE3)]a
| Locusb | Gene | Description | Fold change for strain: |
|
|---|---|---|---|---|
| W | BL21(DE3) | |||
| b0075 | leuL | leu operon leader peptide | 24.92 | 12.99 |
| b0071 | leuD | Isopropylmalate isomerase subunit | 7.55 | 5.25 |
| b3772 | ilvA | Threonine deaminase | 5.70 | 3.25 |
| b0074 | leuA | 2-Isopropylmalate synthase | 6.35 | 8.62 |
| b2320 | pdxB | Erythronate-4-phosphate dehydrogenase | 6.22 | 6.06 |
| b0073 | leuB | 3-Isopropylmalate dehydrogenase | 4.83 | 13.31 |
| b2839 | lysR | LysR DNA-binding transcriptional dual regulator | 3.89 | 10.95 |
| b0052 | pdxA | 4-Hydroxy–l-threonine phosphate dehydrogenase | 3.80 | 2.79 |
| b0008 | talB | Transaldolase B | 3.50 | 1.75 |
| b0072 | leuC | Isopropylmalate isomerase subunit | 3.03 | 10.93 |
| b0876 | ybjD | Conserved protein with nucleoside triphosphate hydrolase domain | 2.96 | 1.73 |
| b0388 | aroL | Shikimate kinase II | 2.14 | 2.14 |
| b4461 | yfjD | Predicted inner membrane protein | 1.91 | 1.78 |
| b4488 | ilvG | Acetolactate synthase II, large subunit | 1.59 | 1.42 |
| b2677 | proV | Glycine betaine/proline ABC transporter, ATP-binding subunit | 1.47 | 2.91 |
Only genes with adjusted P values of <0.05 (Benjamini-Hochberg correction) are shown. An insertion mutant within the bold gene (proV) with an improved growth phenotype in high salt was also isolated from the plate screening of the BL21(DE3) Tn5 library (Fig. 4). Complete data are available in the supplemental material.
The locus tag is given for the equivalent gene in K-12 MG1655, to facilitate cross-strain comparisons.
TABLE 3.
Genes enriched in insertions only in W or BL21(DE3) compared to M9 growth following selection of Tn5 libraries in M9 plus high NaCl concentrations [0.6 M for W and 0.5 M for BL21(DE3)]a
| Strain | Locus | Gene | Description | Fold change |
|---|---|---|---|---|
| W | b3784 | rfe | Undecaprenyl-phosphate α-N-acetylglucosaminyl transferase | 15.30 |
| b3785 | wzzE | Enterobacterial common antigen polysaccharide chain length modulation protein | 13.77 | |
| b3787 | rffD | UDP-N-acetyl-d-mannosaminuronic acid dehydrogenase | 8.80 | |
| b0676 | nagC | NagC DNA-binding transcriptional dual regulator | 8.72 | |
| b3786 | rffE | UDP-N-acetylglucosamine 2-epimerase | 8.60 | |
| b2188 | yejM | Predicted hydrolase, inner membrane | 6.76 | |
| b3912 | cpxR | CpxR transcriptional dual regulator | 6.70 | |
| ECW_m4081 | Hypothetical protein | 6.61 | ||
| b3794 | rffM | UDP-N-acetyl-d-mannosaminuronic acid transferase | 5.93 | |
| b1857 | znuA | Zn2+ ABC transporter, periplasmic binding protein | 5.38 | |
| b4484 | cpxP | Regulator of the Cpx response and possible chaperone involved in resistance to extracytoplasmic stress | 5.03 | |
| b0065 | yabI | Conserved inner membrane protein | 5.02 | |
| b2784 | relA | GDP pyrophosphokinase/GTP pyrophosphokinase | 4.55 | |
| b3920 | yiiQ | Conserved protein | 4.14 | |
| b4233 | mpl | UDP-N-acetylmuramate:l-alanyl-γ-d-glutamyl-meso-diaminoheptanedioate-d-alanine ligase (multifunctional) | 3.97 | |
| b0109 | nadC | Quinolinate phosphoribosyltransferase | 3.94 | |
| b3095 | yqjA | Conserved inner membrane protein | 3.61 | |
| b1961 | dcm | DNA-cytosine methyltransferase | 3.50 | |
| b0677 | nagA | N-Acetylglucosamine-6-phosphate deacetylase | 3.01 | |
| b3860 | dsbA | Protein disulfide oxidoreductase | 2.98 | |
| b0780 | ybhK | Predicted transferase with NAD(P)-binding Rossmann-fold domain | 2.72 | |
| b3149 | diaA | DnaA initiator-associating factor for replication initiation | 2.59 | |
| b0125 | hpt | Hypoxanthine phosphoribosyltransferase | 2.57 | |
| b3054 | ygiF | Inorganic triphosphatase | 2.45 | |
| b2144 | sanA | Inner membrane protein involved in vancomycin sensitivity | 2.37 | |
| b1987 | cbl | Cbl DNA-binding transcriptional activator | 2.34 | |
| b0435 | bolA | BolA DNA-binding transcriptional dual regulator | 2.08 | |
| b2435 | amiA | N-Acetylmuramoyl-l-alanine amidase 1 | 2.08 | |
| b4472 | yhdP | Conserved inner membrane protein, predicted transporter | 2.06 | |
| b4220 | tamA | Translocation and assembly module, TamA subunit | 2.00 | |
| b4221 | tamB | Translocation and assembly module, TamB subunit | 1.81 | |
| b3529 | yhjK | Predicted diguanylate cyclase | 1.76 | |
| BL21(DE3) | b3916 | pfkA | 6-Phosphofructokinase I | 7.64 |
| b0440 | hupB | Transcriptional dual regulator HU-β, NS1 (HU-1) | 5.88 | |
| b2808 | gcvA | GcvA DNA-binding transcriptional dual regulator | 5.79 | |
| ECD_02648 | l-Fuculose phosphate aldolase | 5.47 | ||
| b3957 | argE | Acetylornithine deacetylase | 5.35 | |
| b2735 | ygbI | Predicted DNA-binding transcriptional regulator, DEOR type | 4.73 | |
| b4113 | basR | BasR transcriptional regulator | 3.45 | |
| b2678 | proW | Glycine betaine/proline ABC transporter, membrane subunit | 3.28 | |
| b4112 | basS | BasS sensory histidine kinase | 2.88 | |
| b3336 | bfr | Bacterioferritin | 2.87 | |
| b3934 | cytR | CytR DNA-binding transcriptional repressor | 2.86 | |
| b0607 | uspG | Universal stress protein UP12 | 2.83 | |
| b3581 | yiaQ | 3-Keto-l-gulonate 6-phosphate decarboxylase | 2.74 | |
| b2601 | aroF | 2-Dehydro-3-deoxyphosphoheptonate aldolase | 2.65 | |
| b4000 | hupA | Transcriptional dual regulator HU-α (HU-2) | 2.61 | |
| b2096 | gatY | Tagatose-1,6-bisphosphate aldolase 2, GatY subunit | 2.59 | |
| b2330 | prmB | Protein-glutamine N-methyltransferase | 2.39 | |
| b2029 | gnd | 6-Phosphogluconate dehydrogenase (decarboxylating) | 2.37 | |
| b4293 | fecI | RNA polymerase, sigma 19 factor | 2.24 | |
| b2094 | gatA | Galactitol PTS permease, GatA subunit | 2.23 | |
| b2679 | proX | Glycine betaine/proline ABC transporter, periplasmic binding protein | 2.19 | |
| b0462 | acrB | AcrB RND-type permease of AcrAB-TolC multidrug efflux pump | 2.19 | |
| b2498 | upp | Uracil phosphoribosyltransferase | 2.14 | |
| b2555 | yfhG | Conserved protein | 2.13 | |
| b3403 | pck | Phosphoenolpyruvate carboxykinase | 2.09 | |
| b0463 | acrA | AcrA membrane fusion protein of AcrAB-TolC multidrug efflux pump | 2.01 | |
| b0121 | speE | Spermidine synthase | 2.00 | |
| b2095 | gatZ | Tagatose-1,6-bisphosphate aldolase 2, GatZ subunit | 1.98 | |
| b4240 | treB | Trehalose PTS permease, TreB subunit | 1.96 | |
| b3415 | gntT | Gluconate transporter GntT | 1.94 | |
| b2664 | csiR | CsiR DNA-binding transcriptional repressor | 1.93 | |
| b2943 | galP | Galactose:H+ symporter | 1.90 | |
| ECD_01942 | vioA | dTDP-N-acetylviosamine synthesis protein VioA | 1.90 | |
| b2028 | ugd | UDP-glucose 6-dehydrogenase | 1.87 | |
| b4114 | eptA | Phosphoethanolamine transferase EptA | 1.72 | |
| b2845 | yqeG | YqeG STP transporter | 1.63 | |
| b2663 | gabP | 4-Aminobutyrate:H+ symporter | 1.63 |
Only genes with fold changes greater than 1.6 and with adjusted P values of <0.05 with the Benjamini-Hochberg correction are shown. Insertion mutants within the bold genes (rfe, nagC, and nagA) with improved growth phenotypes in high NaCl concentrations were also isolated from the plate screening of the W Tn5 library (Fig. 4). Complete data are available in the supplemental material.
Construction of clean deletion strains and cross-stress analysis.
To determine if the improved growth phenotypes of Tn5 insertion mutants located within genes or promoter regions were a result of a complete loss-of-function of the gene containing the insertion(s), and to engineer strains in which multiple deletions are combined, clean deletions of 24 genes listed in Fig. 4 were constructed as described in Materials and Methods. Deletions were not constructed for mutS and mutL, which are both components of the methyl-directed mismatch repair system and would thus constitute “mutator strains” for which the phenotype is most likely due to an accumulation of point mutations as a result of defective DNA mismatch repair (44). Out of the 24 genes with beneficial Tn5 insertions (excluding mutS and mutL), 13 gene deletions exhibited a beneficial loss-of-function growth effect under the selection condition (Fig. 5). In BL21(DE3), only a deletion in proV exhibited a growth phenotype similar to that of the Tn5 mutant, whereas in W, deletions in rfe, evgS, evgA, typA, rcsB, nagC, nagA, yobF, ptsP, ackA, and yciW exhibited growth phenotypes similar to those of their respective Tn5 insertion mutants. In addition to these gene deletion strains, W ΔygaH was also included in further analysis as this strain reached a significantly higher cell density than did the parent strain during growth in 0.4 M NaCl (see Fig. S16 in the supplemental material).
FIG 5.
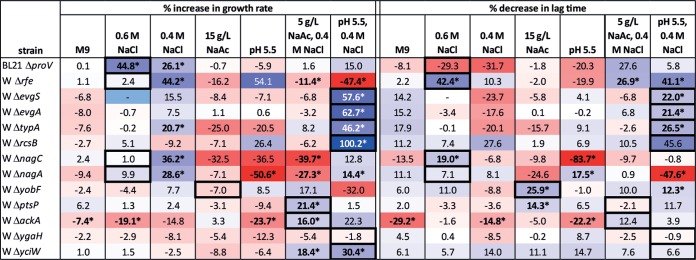
Percent increases in growth rate (left) and percent decreases in lag time (right) of single-gene deletion mutants of W and BL21(DE3) under the different single and combined stresses analyzed in this study. Values are shown in bold and followed by an asterisk if statistically significant with a P of <0.05. Boxed areas indicate the condition for which Tn5 insertions in the deleted genes were originally isolated. The color scale indicates the magnitude of the percent improvement, and a key is shown in Fig. 4.
The 13 clean deletion strains that were selected for further study were growth phenotyped under all of the six different stress conditions originally employed for Tn5 library selections to determine whether these strains possessed resistance to multiple stresses (Fig. 5). Specific observations pertaining to each of these strains are discussed below. W ΔevgS, ΔevgA, and ΔtypA strains exhibited similar behavior under combined low-pH and high-salt conditions, with both increased growth rates (146 to 163% of the growth rate of strain W) and 21 to 26% reductions in lag time. W ΔtypA also had a statistically significant increase in growth rate both under moderate-salt conditions (added 0.4 M NaCl) and in 5 g/liter NaAc plus 0.4 M NaCl and increases in final density under multiple conditions (see Fig. S16 in the supplemental material). These strains also did not exhibit significant loss of fitness under any other conditions investigated in this study. EvgS and EvgA form a two-component signal transduction system responding to an unknown environmental signal, with phosphorylated EvgA predominantly upregulating genes encoding multidrug efflux systems (45). TypA (BipA), a member of the ribosome-binding GTPase family, is suspected to play a regulatory role in numerous stress response pathways via ribosome binding and modulation of ribosome translational activity (46, 47). W ΔrcsB, although possessing an apparent increase in growth rate at pH 5.5 plus 0.4 M NaCl, was visually observed to form irregular aggregates on the bottom of the well; thus, this strain was eliminated from further study. RcsB is the response regulator of a two-component system involved in activation of capsular colanic acid biosynthesis (48); thus, its deletion likely results in an alteration of cell surface properties.
W Δrfe exhibited an increased growth rate over W in the presence of an extra 0.4 M NaCl and a greatly reduced (42%) lag time in 0.6 M NaCl. However, decreased growth rates coupled with decreased lag times were evident in pH 5.5 plus 0.4 M NaCl and 5 g/liter NaAc plus 0.4 M NaCl. A variety of impacts of this gene deletion were observed on final densities of cultures under different conditions (see Fig. S16 in the supplemental material). Rfe catalyzes the preliminary step in the biosynthesis of enterobacterial common antigen and O antigen, the addition of N-acetyl-d-glucosamine to undecaprenyl phosphate, and mutants are deficient in the associated outer membrane lipopolysaccharides (48). Surface aggregation and noisy growth curves were observed for W Δrfe in pH 5.5 plus 0.4 M NaCl, suggesting a more positive surface charge on the outer membrane of mutants. W ΔnagC and ΔnagA mutants, for which mutants were originally isolated after serial passaging under high-salt conditions, also possess higher growth rates in 0.4 M NaCl and a significantly decreased lag time for ΔnagC in 0.6 M NaCl. However, severe negative impacts on growth were observed in cross-stress testing under conditions with low pH or high acetate concentrations. NagA catalyzes the first cytoplasmic step in the catabolism of N-acetyl-d-glucosamine (GlcNac), while NagC, encoded in the same operon, acts as a repressor of its own operon and numerous other genes involved in amino sugar biosynthesis and degradation when not bound to N-acetyl-d-glucosamine-6-phosphate (GlcNac-6P) (48).
Growth rates were increased by 45% and 26% for BL21(DE3) ΔproV growing in 0.6 M NaCl and 0.4 M NaCl, respectively, compared to the BL21(DE3) wild-type strain (Fig. 5; see also Fig. S17 in the supplemental material). Final densities were also significantly increased, while lag times were not statistically significantly changed. ProV is a subunit of the glycine betaine/proline (betaine) ABC transporter (ProVWX), responsible for scavenging these osmoprotectants from the extracellular environment (48). The deletion in proV did not significantly negatively impact growth under any of the other conditions tested.
Smaller improvements in growth were observed in many clean deletion mutants of W in 15 g/liter NaAc and 5 g/liter NaAc plus 0.4 M NaCl. W ΔyobF had a reduced lag time in 15 g/liter NaAc, as previously observed (with some variability, but observed consistently in the majority of cultures over multiple experiments) in the three insertion mutants, and also a reduced final density. No statistically significant changes in growth were observed under the other tested conditions, with the exception of a 55% increase in final density at pH 5.5 plus 0.4 M NaCl. YobF is a small protein with no known function. W ΔptsP had a 21% higher growth rate than W in 5 g/liter NaAc plus 0.4 M NaCl, as well as higher final densities in both 0.6 M NaCl and pH 5.5 plus 0.4 M NaCl and a reduced lag time in 15 g/liter NaAc. PtsP (EINtr) constitutes the first enzyme of an alternative phosphotransferase system (PTS), PTSNtr (48). No statistically significant negative impacts on growth were observed under the other tested conditions. W ΔackA exhibits a 16% higher growth rate in 5 g/liter NaAc plus 0.4 M NaCl but a 30% reduction in final density and decreases in growth rates, lag times, and final densities under other conditions. Acetate kinase (AckA) is involved in acetate overflow metabolism and reassimilation through reversible conversion of acetyl phosphate to acetate. Finally, W ΔyciW possesses an increased growth rate both under the original isolation condition of pH 5.5 plus 0.4 M NaCl (30%) and in 5 g/liter NaAc plus 0.4 M NaCl (18%). Increases in final density were observed in 0.4 M NaCl and pH 5.5 plus 0.4 M NaCl. The deletion did not negatively impact growth under other conditions. YciW is a predicted oxidoreductase (48).
Stress resistance of double deletion strains.
We next sought to determine whether combinations of beneficial gene deletions could enhance growth either under a single condition or across more than one condition to achieve multiple-stress resistance. Double deletions of all combinations of single-gene deletions (44 strains total) in strain W that improved growth under the original selection condition were constructed and tested (see Fig. S18 in the supplemental material). Interestingly, a few double deletions exhibited higher growth rates and/or shorter lag times than either of the corresponding single deletions under at least one condition. W ΔevgA yobF::kan had a higher growth rate (191% higher than W) in pH 5.5 plus 0.4 M NaCl than both W ΔevgA (36% higher) and W ΔyobF (65% higher) and no significant reduction in growth rate in 15 g/liter NaAc (Fig. 6A). Lag times were also reduced over W in pH 5.5 plus 0.4 M NaCl (5% lower), and the final density of cells achieved was higher than those of both the yobF and evgA single deletions. Other strains exhibiting synergistic improvements in growth rate over both single deletions and an overall improvement over W included W ΔptsP yobF::kan and W ΔptsP yciW::kan in 5 g/liter NaAc plus 0.4 M NaCl (Fig. 6B and C), W ΔyobF ackA::kan in 15 g/liter NaAc (see Fig. S19), and W ΔyobF nagA::kan in 0.6 M NaCl. Additionally, synergistic reductions in lag time and synergistic increases in final density were also observed for several strains over both individual knockouts (Fig. 6; see also Fig. S19).
FIG 6.

Averaged growth curves for selected double deletion strains for conditions indicated. The y axis values represent light backscatter intensities as measured on a BioLector microbioreactor system. The strains shown are W ΔevgA yobF::kan (A and B), W ΔptsP yobF::kan (C and D), W ΔptsP yciW::kan (E and F), and W ΔtypA ackA::kan (G and H). Error bars indicate standard deviations of the mean for scattering intensity measurements at each time point for biological replicate cultures.
Antagonistic epistasis was also observed in some gene combinations. In particular, combinations of deletions with nagC or nagA and ackA or ygaH produced reduced growth rates compared to either single deletion and reductions in growth rates under both conditions compared to W. Other combinations with ygaH resulted in reduced growth rates in pH 5.5 plus 0.4 M NaCl, except in combination with yciW. In general, lag times and final densities were similarly negatively affected. All calculated growth parameters for double knockout mutants and associated controls are provided in the supplemental material.
Stress resistance of triple deletion strains: toward building a multistress-resistant strain.
Selected triple deletion strains in the W strain background (25 strains total) were constructed based on the predicted net improved performance of each combination of double deletion strain composing the triple knockout in order to engineer strains with even further enhanced single- and multiple-stress tolerance. In general, the gene interactions in the constructed triple deletion strains appeared to be neutral, with fewer statistically significant growth rate, lag time, and final density changes compared to each double deletion under the specific conditions where the individual genes had beneficial loss-of-function growth phenotypes (see Fig. S20 in the supplemental material). Only one triple deletion strain, W ΔevgA ΔtypA yciW::kan, exhibited a synergistic increase in one variable, final growth density, over the final density of the double deletion strains W ΔevgA typA::kan, W ΔevgA yciW::kan, and W ΔtypA ΔyciW::kan at pH 5.5 plus 0.4 M NaCl (see Fig. S20). A few other triple deletion strains exhibited improvements over at least two corresponding double deletion strains (see Fig. S20).
Comparing triple deletion strains to averaged growth parameters for W over multiple independent experiments (see Fig. S21 in the supplemental material), it is evident that a majority of strains had significant improvements in growth rate and reduced lag times over the original background strain across multiple stress conditions, even if they did not significantly improve over the corresponding double deletion strains. For example, W ΔptsP ΔyciW ackA::kan exhibited statistically significant (P < 0.05) 41%, 41%, and 37% growth rate improvements over W in 15 g/liter NaAc, 5 g/liter NaAc plus 0.4 M NaCl, and pH 5.5 plus 0.4 M NaCl, respectively, while also acquiring a 13 to 26% reduction in lag time under all three conditions. The trajectory of growth improvements for this strain for all single, double, and triple deletion mutants (Fig. 7) shows that the growth phenotypes can be consistently improved by combining loss-of-function mutations. Growth curves associated with the data in Fig. 7 are provided in Fig. S22 in the supplemental material. Calculated growth parameters for all single, double, and triple deletion mutants are provided in Data Sets S1 to S3 in the supplemental material.
FIG 7.
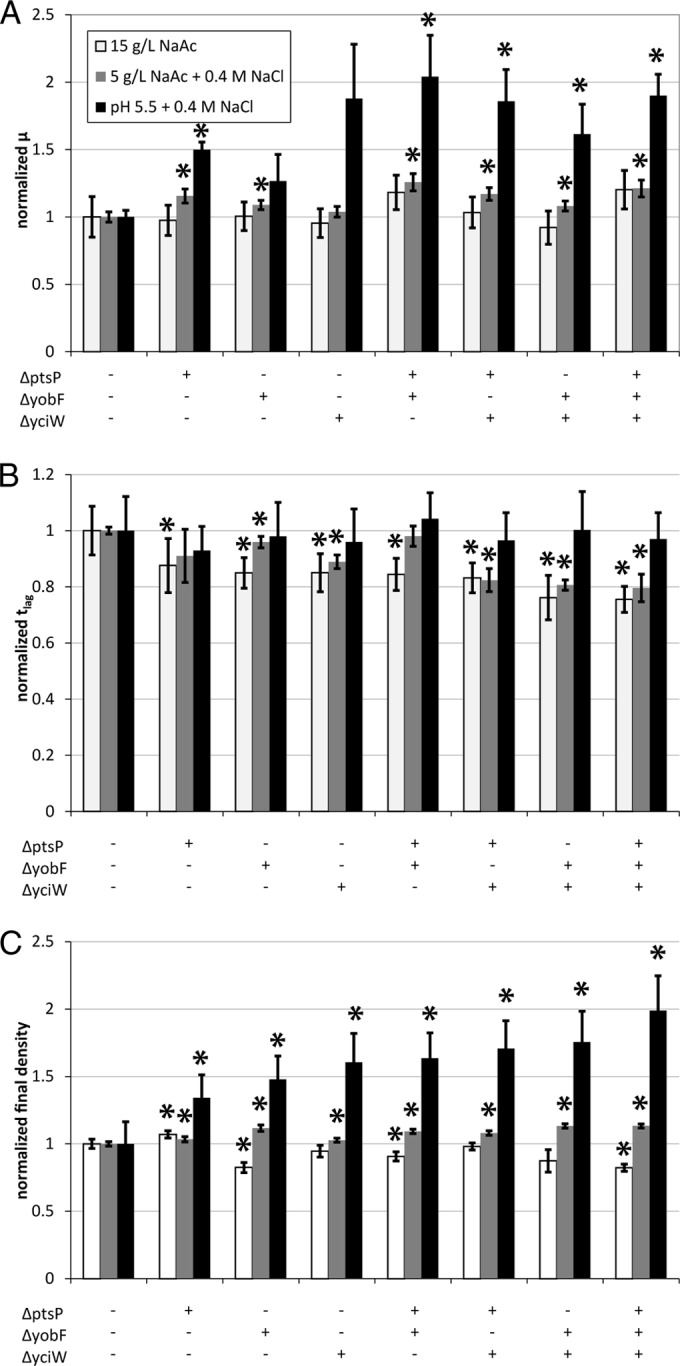
Trajectory of growth rate and lag time improvements achieved from single-gene deletions comprising a triple-gene deletion strain, W ΔptsP ΔyobF ΔyciW. (A) Growth rates normalized to the background strain W for single, double, and triple deletion strains in 15 g/liter NaAc, 5 g/liter NaAc plus 0.4 M NaCl, and pH 5.5 plus 0.4 M NaCl. (B) Lag times normalized to the background strain W under specified conditions. (C) Final cell densities normalized to the background strain W under specified conditions. Error bars represent standard deviations about the mean calculated values for three biological replicates. Asterisks indicate values for which the P value was <0.05 relative to strain W under the same medium conditions. The triple deletion strain generally combines the best features of the single and double deletion mutants.
DISCUSSION
Stress resistance phenotypes of wild-type strains vary significantly.
The E. coli strains investigated in this study [K-12 MG1655, K-12 W3110, BL21(DE3), W, C, and Crooks] were found to vary dramatically in their tolerance toward a variety of stressors that can be encountered in industrial fermentations. In media with high acetate concentrations, BL21(DE3) and Crooks outperformed other strains. The results for BL21(DE3) are consistent with prior reports of greatly reduced acetate accumulation and increased acetate assimilation in this strain (5, 49). K-12 MG1655 has been previously observed to accumulate higher levels of acetate via overflow metabolism than BL21 under identical fermentation conditions (6), which may account for its more severe reduction in growth with the extra addition of acetate. Low acetate accumulation by E. coli B strains such as BL21(DE3) has been attributed to higher flux through the glyoxylate shunt of the tricarboxylic acid (TCA) cycle and has been confirmed by 13C flux analysis comparing BL21 and JM109 (a K-12 strain) (50) and BL21(DE3) and K-12 MG1655 (51). This is despite the reduced expression of genes involved in the glyoxylate shunt (aceBAK) in a B strain (REL606) compared to K-12 MG1655 (5) and in BL21 compared to K-12 JM109 (52). Growth inhibition due to high initial glucose concentrations has been attributed to acetate overflow metabolism (1, 4); thus, it would be anticipated that K-12 strains, which accumulate more acetate than B strains, would be more negatively affected by high glucose concentrations. Indeed, these strains together with E. coli C exhibit the lowest level of biomass accumulation in response to increasing glucose concentrations. BL21(DE3) and Crooks exhibit similarities in both acetate tolerance and efficient glucose assimilation to biomass, suggesting that both strains have a higher flux through the glyoxylate shunt than the K-12 strains and W.
Strains W and Crooks were particularly tolerant to high concentrations of NaCl, which has also been previously observed for W in a study excluding common K-12 strains (7). While exhibiting poor tolerance characteristics for most stressors, K-12 MG1655 unexpectedly exhibits the highest tolerance to oxidative stress induced by H2O2. The generally steep onset of inhibited growth may correlate with the detoxification rate afforded by catalases, which may be differentially regulated between strains. For example, only the K-12 strains possess the PerR transcriptional regulator, which has been found to sense H2O2 by Fe2+-catalyzed oxidation of a histidine residue in Bacillus subtilis (53) and to regulate many genes involved in the response to peroxide (54, 55). E. coli K-12 W3110, which differs from strain MG1655 at only a few loci (56), exhibited a delay of the shift to stationary phase under most conditions compared to K-12 MG1655 (see Fig. S1, S3, and S5 to S8 in the supplemental material). This is likely a consequence of a nonfunctional rpoS allele and suggests that other strains that exhibit this same delay may also possess reduced levels of RpoS activity relative to K-12 MG1655. While RpoS plays an important role in stress survival (57), it is an unstable allele, and its activity is often lost in continuously growing cultures (58) or found to be attenuated in different laboratory and wild isolates (59, 60), suggesting a level of dispensability within the context of other stress resistance mechanisms (58, 61). Strain C, for which virtually nothing is known and no genome sequence is publicly available, qualitatively resembles the K-12 strains but with higher absolute growth rates across most stress conditions (see Fig. S9). Based on the extensive testing performed here, strains W and BL21(DE3) were found to be superior to the commonly used K-12 MG1655 strain under most stress conditions; therefore, these strains were selected as hosts to discover further improvements using Tn mutagenesis.
Novel beneficial loss-of-function mutations identified in W and BL21(DE3).
Tn mutagenesis followed by construction of clean knockout strains of the affected genes allowed identification of several gene knockouts (Fig. 5) that increased growth rates by up to 62% or decreased lag times by up to 42% under different stress conditions, including exposure to low pH, high NaCl, or high acetate concentrations and combinations thereof. A single-gene knockout in strain BL21(DE3) was identified, ΔproV, that increased the growth rate in M9 plus 0.6 M NaCl by 45% and that in M9 plus 0.4 M NaCl by 26%. While ProVWX is an ABC transporter responsible for cytosolic import of proline and glycine betaine which provides one of the primary recognized mechanisms of osmotic tolerance (62), its importance is debatable in a minimal medium due to E. coli being able to synthesize only glycine betaine from choline (abundant in the gastrointestinal tract) and proline from glutamate, another osmoprotectant. Several other individual BL21(DE3) Tn insertion mutants afforded increased tolerance to 5 g/liter NaAc plus 0.4 M NaCl and 15 g/liter NaAc, but corresponding clean gene knockout strains did not recapitulate the growth phenotype, suggesting insertion-location-specific effects. Many more gene deletions were discovered that improved resistance to single stresses in E. coli W, including knockouts in rfe, nagC, nagA, and ygaH (0.4 to 0.6 M NaCl); evgS, evgA, typA, yciW, and rcsB (pH 5.5 plus 0.4 M NaCl); ptsP and ackA (5 g/liter NaAc plus 0.4 M NaCl); and yobF (small reduction in lag time in 15 g/liter NaAc).
There was no obvious reason why more of the Tn insertion mutant phenotypes could be recapitulated in clean single-gene knockout strains in W than in BL21(DE3); however, this could be due to, for example, differing levels of diversity in the initial Tn libraries or the differing ability to perform plate selections under certain conditions for the two strains. Location-dependent effects where the Tn insertion phenotype was a result of a polar effect or attenuation of expression of downstream genes can explain some of these inconsistent cases. For example, insertions in ygaH, dgoD, and gltB were located close to the 3′ terminus of the genes (see Fig. S23 in the supplemental material); therefore, it is likely in these cases that the insertion did not produce a loss-of-function. Similarly, individual insertions in the slp-dctR operon were clustered around the 3′ terminus of slp and 5′ terminus of dctR, and clean deletions in slp and dctR individually resulted in no discernible growth phenotype. A previous study reported no loss of survival after transfer of individual slp and dctR mutants to a low-pH medium but a loss of viability upon transfer of a strain containing a deletion of the slp-dctR operon, suggesting a redundant function of Slp and DctR (63). It is therefore possible that a polar effect within the operon was responsible for a loss-of-function of both genes. While it may be of interest to further analyze these and other Tn5 insertion mutants, we decided to focus on analyzing the 13 clean deletion strains in Fig. 5 whose phenotype appeared to be due to a loss-of-function mutation.
Previous studies have found that mutations in regulators are the most common loss-of-function mutations that result in gains of fitness (23), which correlates with the observation that gene expression is suboptimal in multiple organisms exposed to conditions of industrial interest (64). Indeed, in this study 3 out of 12 beneficial gene deletions discovered in strain W encode known transcriptional regulators (NagC, EvgA, and RcsB), one encodes a sensory histidine kinase (EvgS), and at least two others may play other signaling roles (TypA and PtsP). EvgS and EvgA, which form a two-component signal transduction system that responds to an unknown environmental signal (and was very recently described to require both alkali metals and low pH for activation [65]), is also known to interact with the PhoQ/PhoP two-component system (66, 67), which regulates a large number of genes involved in diverse functions (48). Thus, deletion of this system has the potential to induce significant perturbations in the expression of many stress-associated genes. Because of the similar growth phenotypes of both nagC and nagA deletion strains, and due to NagA being involved in catabolism of GlcNac-6P and the DNA-binding activity of NagC being deactivated when bound to GlcNac-6P, the proposed mechanism of action toward improved growth at high salt concentrations lies in either the direct derepression or deactivation of an operon(s) regulated by NagC. PtsP, a component of the nitrogen phosphotransferase system, is suspected to play a broad regulatory role (68) that is still not fully understood at this time.
Remaining genes identified in the Tn5 screen (Fig. 5) represent diverse stress resistance mechanisms. Elimination of acetate kinase (AckA), which reversibly converts acetyl phosphate generated by phosphate acetyltransferase (Pta) to acetate, likely plays a metabolic or regulatory role in improving tolerance by either reducing acetate overflow metabolism or preventing reassimilation of acetate when the acetate concentration is higher than the Km of ∼0.6 to 0.8 g/liter or through elimination of acetyl phosphate production, which plays a global role in signal transduction (69, 70). However, it is not clear why fitness is improved upon deletion of ackA only under the combined condition of elevated acetate and salt concentrations. Elimination of Rfe, catalyzing a step in lipopolysaccharide (enterobacterial common antigen and O antigen) biosynthesis, and RcsB, which is the response regulator of a two-component system involved in activation of capsular colanic acid biosynthesis, likely results in an alteration of cell surface properties. RcsB is also required for EvgS/EvgA activation (71). Other gene products shown in Fig. 5, including YciW, YgaH, and YobF, have no known function, but based on our results appear to play at least an indirect role in stress response. A yobF deletion mutant was previously found to be more sensitive toward exposure to a mixture of SDS and EDTA and toward acid shock at pH 1.8 (72).
The specific gene targets identified in this study can be compared to complementary studies investigating the genetic basis of stress tolerance in K-12 strains using either knockout collections or ALE or in studies targeting specific pathways. Only a few of the beneficial gene deletions identified in this study were previously identified as improving fitness under similar conditions in a high-throughput phenotypic screen of all gene deletion mutants in the Keio collection library (35) in strain BW25113 (a K-12 MG1655 derivative) (27). For example, on LB agar plates supplemented with 0.6 M NaCl, proV, rfe, nagC, and nagA deletions all exhibited improved fitness (27). A premature stop codon in proV was one of only four mutations identified in a strain evolved from an ancestral MG1655 strain by ALE in 0.3 M NaCl (73). Probable loss-of-function mutations in proV, nagC, and nagA have recently been isolated from strain BW25113 (a K-12 derivative) subjected to ALE in 0.6 M NaCl (27), further supporting the role of these genes in osmotolerance in both W and K-12 strains. Deletions in ackA are commonly made in metabolically engineered strains to reduce acetate overflow metabolism; thus, isolating a mutant with this null mutation was not unexpected under conditions involving high acetate concentrations. The large number of other beneficial gene deletions identified in the W strain background with no known connection to stress tolerance functions highlights the potential for discovering novel functions for genes by studying their roles in different strain backgrounds. This is especially significant in E. coli as this bacterium is the primary model organism for bacterial physiology and the major source of homology-based gene annotations in most other bacteria.
The majority of the strains harboring beneficial null mutations under one condition exhibited neutral effects on growth parameters under other conditions (Fig. 5). Exceptions to this were strains W ΔnagC and W ΔnagA, which had large reductions in growth rates in media at pH 5.5 or in 5 g/liter NaAc plus 0.4 M NaCl. Additionally, W Δrfe exhibited apparent aggregation under low-pH conditions and W ΔackA had a lower growth rate and increased lag time in pH 5.5. Interestingly, null mutations identified as having positive effects on growth under conditions combining two stresses (e.g., pH 5.5 plus 0.4 M NaCl) often exhibited either negative or neutral effects on growth under individual stress conditions. Since high-density industrial fermentations most likely impose multiple simultaneous stresses on cells, these results indicate that screening mutant libraries under only one stress condition at a time may not permit the identification of genetic modification targets that improve strain robustness in industrially relevant environments.
General and strain-specific determinants of stress resistance can be identified by Tn-Seq.
Tn-Seq represents a promising high-throughput alternative to traditional plate screening of libraries for beneficial growth phenotypes. We were able to identify all genes with beneficial insertions isolated in the original screen under the high-salt condition among the genes enriched in insertions under the same condition from the Tn-Seq data. In addition, a significant number of additional genes involved in the same cellular processes as the original genes were identified as beneficial, corroborating the role of these processes in stress resistance (Tables 2 and 3). For example, proW and proX, encoding the other subunits of the glycine betaine/proline ABC transporter ProVWX, were also enriched in insertions in BL21(DE3) grown in 0.5 M NaCl. Similarly, rffD, rffE, and rffM were enriched in insertions in W grown in 0.6 M NaCl, with these genes catalyzing additional steps in the biosynthetic pathway (together with rfe) leading to the undecaprenylated GlcNac-containing constituent of lipid III (48).
Further analysis of the Tn-Seq results also provides insight into other loss-of-function mutations that would be valuable in improving growth characteristics under stress conditions. A core set of 13 genes were significantly enriched in insertions in both strains W and BL21(DE3) (Table 2 and Fig. 8), representing potential general mechanisms for osmotic stress tolerance that are independent of strain background. These include genes involved in the leucine and isoleucine biosynthetic pathways, including leuL, leuC, leuA, leuD, and ilvA. Enriched levels of insertions were also detected in leuB and ilvD in BL21(DE3). As loss-of-function of any of these genes should lead to auxotrophy in minimal medium, it is surmised that cells possessing these losses-of-function are parasitic on the majority of other cells that lack the auxotrophy. The transient fitness advantage that these null mutants have under osmotic stress conditions could be conferred by conservation of l-glutamate, an important osmoprotectant (62). This hypothesis is supported by the low absolute numbers of insertions in these genes (see Data Set S4 in the supplemental material).
FIG 8.

Pathway illustration of genes enriched in insertions (beneficial losses-of-function) common to strains W and BL21(DE3) (indicated with a black X), with some additional beneficial losses-of-function for one strain also shown (indicated with a gray X). A dashed black or gray X indicates an enzymatic activity that is only partially lost as a result of loss-of-function of an isozyme. The solid gray lines with bars indicate repressor activity (via LeuL), and the solid gray arrow indicates activator activity (via LysR). Gray dashed arrows emanating from pyridoxal 5′-phosphate (PLP) denote enzymes utilizing PLP as a cofactor. Many pathways with beneficial gene losses-of-function consume l-glutamate or phosphoenolpyruvate. Phosphoenolpyruvate is an important precursor necessary for trehalose biosynthesis, which provides osmoprotection when accumulated in the periplasm. Potassium glutamate is a compatible solute that is accumulated under osmotic stress conditions. CoA, coenzyme A.
There are a number of other genes identified by Tn-Seq whose stress-protective function is possibly related to glutamate conservation (Tables 2 and 3). These include lysR and trpE identified in both strains and trpD identified in W. LysR acts as an activator of lysA expression, which catalyzes the final decarboxylation step in lysine biosynthesis, another pathway responsible for the consumption of l-glutamate. The TrpD and TrpE genes encode the two subunits of anthranilate synthase in the tryptophan biosynthesis pathway, which reversibly catalyzes the conversion of chorismate and l-glutamine to anthranilate, pyruvate, and l-glutamate. When l-glutamate accumulates in the cell, it is possible that the reverse reaction becomes favorable, resulting in consumption of l-glutamate and possibly explaining why loss-of-function alleles of trpE and trpD are beneficial under osmotic stress conditions. Enriched insertions observed in both strains in pdxA and pdxB, involved in the production of the cofactor pyridoxal 5′-phosphate (PLP), may also be related to l-glutamate conservation due to the role of PLP as a cofactor for several amino acid transaminases, including IlvE.
Another important osmoprotectant in E. coli is trehalose (74), and genes involved in the superpathway of trehalose biosynthesis were found to be depleted in insertions under high-salt conditions (see Table S5 in the supplemental material), indicating that trehalose biosynthesis is conditionally essential for growth under these conditions. Genes depleted in insertions include ptsG (in both strains), pgm (only in W), and otsAB (in both strains) (see Tables S5 to S7). The PtsG gene encodes the phosphoenolpyruvate (PEP)-dependent glucose phosphotransferase system permease. Pgm catalyzes the conversion between α-d-glucose 6-phosphate and α-d-glucose 1-phosphate, the latter being a substrate necessary for production of UDP-glucose. UDP-glucose and α-d-glucose 6-phosphate are converted to trehalose 6-phosphate by OtsA, while OtsB generates the final product, trehalose. Related to these observations, the shikimate biosynthesis pathway to chorismate also consumes two molecules of phosphoenolpyruvate for every molecule of chorismate produced, with phosphoenolpyruvate required for glucose uptake by the PtsG glucose phosphotransferase (PTS) permease. Within the shikimate pathway, enriched insertions were observed in both strains in aroL, encoding shikimate kinase II (the higher-substrate-affinity isozyme), with aroF (encoding a tyrosine-regulated isoenzyme catalyzing the first committed step in chorismate biosynthesis) also enriched in BL21(DE3). Furthermore, talB, which encodes transaldolase B within the pentose phosphate pathway, is enriched in insertions in both strains. TalB is one isoenzyme responsible for the production of erythrose-4-phosphate (E4P), which is a precursor required both for the shikimate pathway and for PLP biosynthesis.
As insertions were relatively abundant in aroL and trpE, likely due to the existence of isoenzyme activities, their inactivation could present a viable strategy for improving salt tolerance in both strains. Other strategies that enable downregulation of biosynthetic pathways for leucine, isoleucine, valine, and lysine are also predicted to improve osmotic tolerance. Two more genes enriched in depletions in both W and BL21(DE3) are ybjD and yfjD, which are genes of unknown function. These targets and other strain-specific genes of unknown function are interesting new targets for designing salt-tolerant strains, particularly when observed to have a high abundance in insertions.
Many more candidate strain-specific loss-of-function mutants with increased osmotolerance can be identified from the Tn-Seq data. Unfortunately a complete analysis is not possible here; thus, only one example related to differences in outer membrane modifications will be discussed. In W, genes involved in enterobacterial common antigen (ECA) biosynthesis other than rfe were enriched in insertions, including rffD, rffE, and rffM. Notably, Rfe, RffD, RffE, and RffM are required for biosynthesis of the undecaprenolated constituent of lipid III, whose amino sugar moieties are derived exclusively from GlcNac (48). Genes required for synthesis of the fucosylated moiety dTDP-4N-acetyl-α-d-fucosamine (Fuc4Nac) (rffH/rfbA, rffG, rffA, and rffC) (see Table S6 in the supplemental material) and the gene encoding the final transferase for generation of lipid III (rffT) (see Table S6) appear to be essential, suggesting that a modified version of lipid III that contains only the Fuc4Nac moiety may be advantageous under high-salt conditions. The ECA biosynthesis protein complex, composed of WzxE, WzyE, and WzzE, is responsible for synthesizing chains of ECA polysaccharide from lipid III. WzxE harbors the lipid III flippase activity, and WzyE is proposed to be involved in the assembly of linear polysaccharide chains. Genes encoding these functions appear to be essential (see Table S6), and only wzzE, which is involved in both regulating the polysaccharide repeat length and synthesizing cyclic ECA (48), is enriched in insertions (Table 3), suggesting that a random distribution of polysaccharide repeat lengths and/or a lack of cyclized ECA is also beneficial toward salt tolerance in W. BL21(DE3) possesses all genes required for ECA biosynthesis, and in stark contrast to W, insertions in rfe, rffM, rffD, rffE, and wzxE are all significantly depleted in insertions upon growth under high-salt conditions (see Table S7), indicating that the GlcNac-containing substituent of lipid III is conditionally essential. Elimination of other surface modifications appears to increase fitness in BL21(DE3), as wbbC, vioA, and vioB, which are located in a divergent gene cluster located between manB and galF on the chromosome, are enriched in insertions (Table 3). These genes encode enzymes involved in dTDP-N-acetylviosamine biosynthesis (75) and a putative glycosyltransferase (48). These results highlight the diversity of outer membrane surface structures in different E. coli strains and their differential roles in stress resistance.
Compared with traditional library screening of Tn mutants, Tn-Seq offers more rapid identification of loss-of-function alleles with either positive or negative fitness effects under stressful conditions. Tn-Seq has the disadvantage of necessitating the construction of a knockout strain to validate the results obtained by the genome-wide approach; however, high-throughput secondary screening of combinatorial libraries of nonfunctional alleles could be performed for all genes enriched in insertions through techniques such as multiplex automated genome engineering (MAGE) (76). The combination of Tn-Seq and MAGE applied in production strains possessing engineered pathways could provide a rapid way to combinatorially explore the full potential of loss-of-function mutations to enhance production-related stress tolerance. It should also be noted that our results demonstrating significant strain background-dependent variation in the genetic basis of stress resistance (Table 3) indicate that some caution should be exercised when extrapolating results that have been obtained using the E. coli Keio collection of knockout mutants. The Keio collection is constructed in the background strain K-12 BW25113, which we have observed to have a poor growth phenotype under many conditions (data not shown). Tn-Seq and similar methods allow rapid identification of genetic determinants of stress resistance in strains of greater industrial interest.
Combining multiple deletions in the same strain background allows the building of multistress-resistant strains.
The potential for further enhancing tolerance toward single- and multiple-stress conditions by exploiting positive epistatic interactions (or lack of negative epistatic interactions) between single deletions in strain W was explored by constructing all possible combinations of double deletion mutants from the pool of beneficial single-gene deletions (Fig. 6; see also Fig. S18 in the supplemental material). Growth phenotyping of these combinations revealed both epistatic and noninteracting gene pairs, suggesting mechanisms of action both in distinct stress resistance pathways and in the same or interacting pathways. By constructing only triple deletion mutants composed of combinations of beneficial double knockout mutants, negative epistatic effects were greatly diminished and the majority of strains exhibited enhanced single- and multiple-stress resistance (Fig. 7; see also Fig. S21).
We were able to identify several negative genetic interactions by analyzing all double gene deletion combinations of beneficial single-gene deletions. In particular, deleterious interactions were observed between nagC and nagA or between ygaH and the majority of other genes. Positive genetic interactions were also observed between several gene pairs (Fig. 6; see also Fig. S18 and S19 in the supplemental material). Upon constructing triple deletion mutants that did not contain any negative epistatic pair, no new negative interactions were encountered. Fewer positive epistatic interactions were also uncovered among the triple deletion mutants, but these mutants usually had improved growth under a broader range of conditions (Fig. 7; see also Fig. S21). As it is extremely labor-intensive to construct and test all possible double gene deletions (∼16,000,000) (77), and it is essentially infeasible to construct and screen the full combinatorial space of all triple gene deletions (∼64,000,000,000), there is a need for strain engineering methods that identify local maxima in the fitness landscape. While the global fitness maximum may not be achieved, we show here that local fitness maxima that represent significantly improved phenotypes compared with wild-type strains can be achieved by constructing combinations of beneficial single and double gene knockouts. The growth improvements achieved by this approach, with up to 50% or more increases in growth rate, are comparable to those obtained by screening of genomic overexpression libraries for enhancing tolerance toward acetate and other chemicals (16–18), and to strains evolved by ALE for growth under 0.3 M NaCl and pH 5.5 conditions (73). Selection from Tn libraries represents an attractive complement to ALE, as these libraries can be constructed directly in the engineered production host and require only short-term selections to be performed, thus avoiding the loss of a production pathway that is likely to occur under longer-term selections.
Conclusions.
The results of this study show that common laboratory strains of E. coli vary significantly in their tolerance toward common stressors in industrial fermentations, highlighting the importance of host strain selection in metabolic engineering. In particular, the most commonly used laboratory strain, K-12 MG1655, was in general found to be the least robust strain of the six tested in this study. Even in strains with high basal tolerance levels toward stresses, such as E. coli W, an abundance of opportunities exists to discover further beneficial loss-of-function mutations for improved growth physiology under stressful conditions. These beneficial mutations can be identified either by traditional plate screening of Tn libraries or more comprehensively through the use of Tn-Seq to determine the full complement of genes whose inactivation improves fitness under a particular condition. Several novel gene deletions that led to single- and multiple-stress resistance were discovered by screening Tn libraries, and these mutations were comprehensively validated under multiple-stress conditions. Many more potentially beneficial gene deletions for osmotic stress tolerance were discovered using Tn-Seq, with results suggesting that both strain-specific (e.g., modulation of specific cell surface modifications) and general (e.g., glutamate conservation) mechanisms of tolerance exist. Finally, constructing combinatorial knockout mutants of beneficial single-gene deletions was shown to lead to synergistic improvements in single- and multiple-stress resistance that significantly exceed the benefits of single deletions. Future work will also involve testing multistress-resistant mutant strains in fed-batch fermentation with heterologous production pathways, to determine if stress resistance is also improved under more realistic processing conditions and if product titers can be improved through the use of these stress-resistant platform strains. Our study demonstrates that despite many previous efforts to understand the genetic basis of stress tolerance in E. coli and to develop robust platform strains for metabolic engineering, there is significant additional potential for further enhancements in robustness in different wild-type strains. It is likely that these results can also be generalized to other commonly used metabolic engineering hosts, such as Saccharomyces cerevisiae.
Supplementary Material
ACKNOWLEDGMENTS
This work was financially supported by The Novo Nordisk Foundation.
We acknowledge Anna Koza and Khoa Nguyen Do for assistance with next-generation sequencing and Hao Luo for helpful discussions.
Footnotes
Published ahead of print 1 August 2014
Supplemental material for this article may be found at http://dx.doi.org/10.1128/AEM.01542-14.
REFERENCES
- 1.Shiloach J, Fass R. 2005. Growing E. coli to high cell density—a historical perspective on method development. Biotechnol. Adv. 23:345–357. 10.1016/j.biotechadv.2005.04.004 [DOI] [PubMed] [Google Scholar]
- 2.Lee SY. 1996. High cell-density culture of Escherichia coli. Trends Biotechnol. 14:98–105. 10.1016/0167-7799(96)80930-9 [DOI] [PubMed] [Google Scholar]
- 3.Baumler DJ, Peplinski RG, Reed JL, Glasner JD, Perna NT. 2011. The evolution of metabolic networks of E. coli. BMC Syst. Biol. 5:182. 10.1186/1752-0509-5-182 [DOI] [PMC free article] [PubMed] [Google Scholar]
- 4.Luli GW, Strohl WR. 1990. Comparison of growth, acetate production, and acetate inhibition of Escherichia coli strains in batch and fed-batch fermentations. Appl. Environ. Microbiol. 56:1004–1011 [DOI] [PMC free article] [PubMed] [Google Scholar]
- 5.Yoon SH, Han MJ, Jeong H, Lee CH, Xia XX, Lee DH, Shim JH, Lee SY, Oh TK, Kim JF. 2012. Comparative multi-omics systems analysis of Escherichia coli strains B and K-12. Genome Biol. 13:R37. 10.1186/gb-2012-13-5-r37 [DOI] [PMC free article] [PubMed] [Google Scholar]
- 6.Son YJ, Phue JN, Trinh LB, Lee SJ, Shiloach J. 2011. The role of Cra in regulating acetate excretion and osmotic tolerance in E. coli K-12 and E. coli B at high density growth. Microb. Cell Fact. 10:52. 10.1186/1475-2859-10-52 [DOI] [PMC free article] [PubMed] [Google Scholar]
- 7.Alterthum F, Ingram LO. 1989. Efficient ethanol production from glucose, lactose, and xylose by recombinant Escherichia coli. Appl. Environ. Microbiol. 55:1943–1948 [DOI] [PMC free article] [PubMed] [Google Scholar]
- 8.Ohta K, Beall DS, Mejia JP, Shanmugam KT, Ingram LO. 1991. Genetic improvement of Escherichia coli for ethanol production: chromosomal integration of Zymomonas mobilis genes encoding pyruvate decarboxylase and alcohol dehydrogenase II. Appl. Environ. Microbiol. 57:893–900 [DOI] [PMC free article] [PubMed] [Google Scholar]
- 9.Na D, Yoo SM, Chung H, Park H, Park JH, Lee SY. 2013. Metabolic engineering of Escherichia coli using synthetic small regulatory RNAs. Nat. Biotechnol. 31:170–174. 10.1038/nbt.2461 [DOI] [PubMed] [Google Scholar]
- 10.Kim B, Park H, Na D, Lee SY. 2014. Metabolic engineering of Escherichia coli for the production of phenol from glucose. Biotechnol. J. 9. 10.1002/biot.201300263 [DOI] [PubMed] [Google Scholar]
- 11.Bond-Watts BB, Bellerose RJ, Chang MCY. 2011. Enzyme mechanism as a kinetic control element for designing biofuel pathways. Nat. Chem. Biol. 7:222–227. 10.1038/nchembio.537 [DOI] [PubMed] [Google Scholar]
- 12.Tseng HC, Martin CH, Nielsen DR, Prather KL. 2009. Metabolic engineering of Escherichia coli for enhanced production of (R)- and (S)-3-hydroxybutyrate. Appl. Environ. Microbiol. 75:3137–3145. 10.1128/AEM.02667-08 [DOI] [PMC free article] [PubMed] [Google Scholar]
- 13.Sauer U. 2001. Evolutionary engineering of industrially important microbial phenotypes. Adv. Biochem. Eng. Biotechnol. 73:129–169. 10.1007/3-540-45300-8_7 [DOI] [PubMed] [Google Scholar]
- 14.Dragosits M, Mattanovich D. 2013. Adaptive laboratory evolution—principles and applications for biotechnology. Microb. Cell Fact. 12:64. 10.1186/1475-2859-12-64 [DOI] [PMC free article] [PubMed] [Google Scholar]
- 15.Conrad TM, Lewis NE, Palsson BØ. 2011. Microbial laboratory evolution in the era of genome-scale science. Mol. Syst. Biol. 7:509. 10.1038/msb.2011.42 [DOI] [PMC free article] [PubMed] [Google Scholar]
- 16.Warnecke TE, Lynch MD, Karimpour-Fard A, Sandoval N, Gill RT. 2008. A genomics approach to improve the analysis and design of strain selections. Metab. Eng. 10:154–165. 10.1016/j.ymben.2008.04.004 [DOI] [PubMed] [Google Scholar]
- 17.Sandoval NR, Mills TY, Zhang M, Gill RT. 2011. Elucidating acetate tolerance in E. coli using a genome-wide approach. Metab. Eng. 13:214–224. 10.1016/j.ymben.2010.12.001 [DOI] [PubMed] [Google Scholar]
- 18.Reyes LH, Almario MP, Kao KC. 2011. Genomic library screens for genes involved in n-butanol tolerance in Escherichia coli. PLoS One 6:e17678. 10.1371/journal.pone.0017678 [DOI] [PMC free article] [PubMed] [Google Scholar]
- 19.Nicolaou SA, Fast AG, Nakamaru-Ogiso E, Papoutsakis ET. 2013. Overexpression of fetA (ybbL) and fetB (ybbM), encoding an iron exporter, enhances resistance to oxidative stress in Escherichia coli. Appl. Environ. Microbiol. 79:7210–7219. 10.1128/AEM.02322-13 [DOI] [PMC free article] [PubMed] [Google Scholar]
- 20.Sommer MOA, Church GM, Dantas G. 2010. A functional metagenomics approach for expanding the synthetic biology toolbox for biomass conversion. Mol. Syst. Biol. 6:360. 10.1038/msb.2010.16 [DOI] [PMC free article] [PubMed] [Google Scholar]
- 21.Alper H, Stephanopoulos G. 2007. Global transcription machinery engineering: a new approach for improving cellular phenotype. Metab. Eng. 9:258–267. 10.1016/j.ymben.2006.12.002 [DOI] [PubMed] [Google Scholar]
- 22.Zhang H, Chong H, Ching CB, Jiang R. 2012. Random mutagenesis of global transcription factor cAMP receptor protein for improved osmotolerance. Biotechnol. Bioeng. 109:1165–1172. 10.1002/bit.24411 [DOI] [PubMed] [Google Scholar]
- 23.Hottes AK, Freddolino PL, Khare A, Donnell ZN, Liu JC, Tavazoie S. 2013. Bacterial adaptation through loss of function. PLoS Genet. 9:e1003617. 10.1371/journal.pgen.1003617 [DOI] [PMC free article] [PubMed] [Google Scholar]
- 24.Andersson SGE, Kurland CG. 1998. Reductive evolution of resident genomes. Trends Microbiol. 6:263–268. 10.1016/S0966-842X(98)01312-2 [DOI] [PubMed] [Google Scholar]
- 25.Mira A, Ochman H, Moran NA. 2001. Deletional bias and the evolution of bacterial genomes. Trends Genet. 17:589–596. 10.1016/S0168-9525(01)02447-7 [DOI] [PubMed] [Google Scholar]
- 26.Winkler JD, Garcia C, Olson M, Callaway E, Kao KC. 2014. Evolved osmotolerant Escherichia coli mutants frequently exhibit defective N-acetylglucosamine catabolism and point mutations in the cell shape-regulating protein MreB. Appl. Environ. Microbiol. 80:3729–3740. 10.1128/AEM.00499-14 [DOI] [PMC free article] [PubMed] [Google Scholar]
- 27.Nichols RJ, Sen S, Choo YJ, Beltrao P, Zietek M, Chaba R, Lee S, Kazmierczak KM, Lee KJ, Wong A, Shales M, Lovett S, Winkler ME, Krogan NJ, Typas A, Gross CA. 2011. Phenotypic landscape of a bacterial cell. Cell 144:143–156. 10.1016/j.cell.2010.11.052 [DOI] [PMC free article] [PubMed] [Google Scholar]
- 28.Alper H, Miyaoku K, Stephanopoulos G. 2005. Construction of lycopene-overproducing E. coli strains by combining systematic and combinatorial gene knockout targets. Nat. Biotechnol. 23:612–616. 10.1038/nbt1083 [DOI] [PubMed] [Google Scholar]
- 29.Kim HS, Kim NR, Yang J. 2011. Identification of novel genes responsible for ethanol and/or thermotolerance by transposon mutagenesis in Saccharomyces cerevisiae. Appl. Microbiol. Biotechnol. 91:1159–1172. 10.1007/s00253-011-3298-z [DOI] [PubMed] [Google Scholar]
- 30.Skerker JM, Leon D, Price MN, Mar JS, Tarjan DR, Wetmore KM, Deutschbauer AM, Baumohl JK, Bauer S, Ibáñez AB, Mitchell VD, Wu CH, Hu P, Hazen T, Arkin AP. 2013. Dissecting a complex chemical stress: chemogenomic profiling of plant hydrolysates. Mol. Syst. Biol. 9:674. 10.1038/msb.2013.30 [DOI] [PMC free article] [PubMed] [Google Scholar]
- 31.Hoover SW, Youngquist JT, Angart PA, Withers ST, Lennen RM, Pfleger BF. 2012. Isolation of improved free fatty acid overproducing strains of Escherichia coli via Nile red based high-throughput screening. Environ. Prog. Sustain. Energy 31:17–23. 10.1002/ep.10599 [DOI] [PMC free article] [PubMed] [Google Scholar]
- 32.van Opijnen T, Camilli A. 2013. Transposon insertion sequencing: a new tool for systems-level analysis of microorganisms. Nat. Rev. Microbiol. 11:435–442. 10.1038/nrmicro3033 [DOI] [PMC free article] [PubMed] [Google Scholar]
- 33.Barquist L, Boinett CJ, Cain AK. 2013. Approaches to querying bacterial genomes with transposon-insertion sequencing. RNA Biol. 10:1161–1169. 10.4161/rna.24765 [DOI] [PMC free article] [PubMed] [Google Scholar]
- 34.van Opijnen T, Bodi K, Camilli A. 2009. Tn-seq: high-throughput parallel sequencing for fitness and genetic interaction studies in microorganisms. Nat. Methods 6:767–772. 10.1038/nmeth.1377 [DOI] [PMC free article] [PubMed] [Google Scholar]
- 35.Baba T, Ara T, Hasegawa M, Takai Y, Okumura Y, Baba M, Datsenko KA, Tomita M, Wanner BL, Mori H. 2006. Construction of Escherichia coli K-12 in-frame, single-gene knockout mutants: the Keio collection. Mol. Syst. Biol. 2:2006.0008. 10.1038/msb4100050 [DOI] [PMC free article] [PubMed] [Google Scholar]
- 36.Karlyshev AV, Pallen MJ, Wren BW. 2000. Single-primer PCR procedure for rapid identification of transposon insertion sites. Biotechniques 28:1078–1082 [DOI] [PubMed] [Google Scholar]
- 37.Wong SMS, Gawronski JD, Lapointe D, Akerley BJ. 2011. High-throughput insertion tracking by deep sequencing for the analysis of bacterial pathogens. Methods Mol. Biol. 733:209–222. 10.1007/978-1-61779-089-8_15 [DOI] [PubMed] [Google Scholar]
- 38.Zomer A, Burghout P, Bootsma HJ, Hermans PWM, van Hijum SAFT. 2012. ESSENTIALS: software for rapid analysis of high throughput transposon insertion sequencing data. PLoS One 7:e43012. 10.1371/journal.pone.0043012 [DOI] [PMC free article] [PubMed] [Google Scholar]
- 39.Datsenko KA, Wanner BL. 2000. One-step inactivation of chromosomal genes in Escherichia coli K-12 using PCR products. Proc. Natl. Acad. Sci. U. S. A. 97:6640–6645. 10.1073/pnas.120163297 [DOI] [PMC free article] [PubMed] [Google Scholar]
- 40.Datta S, Constantino N, Court DL. 2006. A set of recombineering plasmids for gram-negative bacteria. Gene 379:109–115. 10.1016/j.gene.2006.04.018 [DOI] [PubMed] [Google Scholar]
- 41.Cherepanov PP, Wackernagel W. 1995. Gene disruption in Escherichia coli: TcR and KmR cassettes with the option of Flp-catalyzed excision of the antibiotic-resistance determinant. Gene 158:9–14. 10.1016/0378-1119(95)00193-A [DOI] [PubMed] [Google Scholar]
- 42.Enfors SO, Jahic M, Rozkov A, Xu B, Hecker M, Jürgen B, Krüger E, Schweder T, Hamer G, O'Beirne D, Noisommit-Rizzi N, Reuss M, Boone L, Hewitt C, McFarlane C, Nienow A, Kovacs T, Trägårdh C, Fuchs L, Revstedt J, Friberg PC, Hjertager B, Blomsten G, Skogman H, Hjort S, Hoeks F, Lin HY, Neubauer P, van der Lans R, Luyben K, Vrabel P, Manelius Å. 2001. Physiological responses to mixing in large scale bioreactors. J. Biotechnol. 85:175–185. 10.1016/S0168-1656(00)00365-5 [DOI] [PubMed] [Google Scholar]
- 43.Kensy F, Zang E, Faulhammer C, Tan RK, Büchs J. 2009. Validation of a high-throughput fermentation system based on online monitoring of biomass and fluorescence in continuously shaken microtiter plates. Microb. Cell Fact. 8:31. 10.1186/1475-2859-8-31 [DOI] [PMC free article] [PubMed] [Google Scholar]
- 44.Glickman BW, Radman M. 1980. Escherichia coli mutator mutants deficient in methylation-instructed DNA mismatch correction. Proc. Natl. Acad. Sci. U. S. A. 77:1063–1067. 10.1073/pnas.77.2.1063 [DOI] [PMC free article] [PubMed] [Google Scholar]
- 45.Eguchi Y, Oshima T, Mori H, Aono R, Yamamoto K, Ishihama A, Utsumi R. 2003. Transcriptional regulation of drug efflux genes by EvgAS, a two-component system in Escherichia coli. Microbiology 149:2819–2828. 10.1099/mic.0.26460-0 [DOI] [PubMed] [Google Scholar]
- 46.Krishnan K, Flower AM. 2008. Suppression of ΔbipA phenotypes in Escherichia coli by abolishment of pseudouridylation at specific sites on 23S rRNA. J. Bacteriol. 190:7675–7683. 10.1128/JB.00835-08 [DOI] [PMC free article] [PubMed] [Google Scholar]
- 47.deLivron MA, Makanji HS, Lane MC, Robinson VL. 2009. A novel domain in translational GTPase BipA mediates interaction with the 70S ribosome and influences GTP hydrolysis. Biochemistry 48:10533–10541. 10.1021/bi901026z [DOI] [PubMed] [Google Scholar]
- 48.Keseler IM, Mackie A, Peralta-Gil M, Santos-Zavaleta A, Gama-Castro S, Bonavides-Martínez C, Fulcher C, Huerta AM, Kothari A, Krummenacker M, Latendresse M, Muñiz-Rascado L, Ong Q, Paley S, Schröder I, Shearer AG, Subhraveti P, Travers M, Weerasinghe D, Weiss V, Collado-Vides J, Gunsalus RP, Paulsen I, Karp PD. 2013. EcoCyc: fusing model organism databases with systems biology. Nucleic Acids Res. 41:D605–D612. 10.1093/nar/gks1027 [DOI] [PMC free article] [PubMed] [Google Scholar]
- 49.Phue JN, Shiloach J. 2004. Transcription levels of key metabolic genes are the cause for different glucose utilization pathways in E. coli B (BL21) and E. coli K (JM109). J. Biotechnol. 109:21–30. 10.1016/j.jbiotec.2003.10.038 [DOI] [PubMed] [Google Scholar]
- 50.Noronha SB, Yeh HJ, Spande TF, Shiloach J. 2000. Investigation of the TCA cycle and the glyoxylate shunt in Escherichia coli BL21 and JM109 using 13C-NMR/MS. Biotechnol. Bioeng. 68:316–327. 10.1002/(SICI)1097-0290(20000505)68:3<316::AID-BIT10>3.0.CO;2-2 [DOI] [PubMed] [Google Scholar]
- 51.Waegeman H, Beauprez J, Moens H, Maertens J, De Mey M, Foulquié-Moreno MR, Heijnen JJ, Charlier D, Soetaert W. 2011. Effect of iclR and arcA knockouts on biomass formation and metabolic fluxes in Escherichia coli K12 and its implications on understanding the metabolism of Escherichia coli BL21(DE3). BMC Microbiol. 11:70. 10.1186/1471-2180-11-70 [DOI] [PMC free article] [PubMed] [Google Scholar]
- 52.Phue JN, Noronha SB, Hattacharyya R, Wolfe AJ, Shiloach J. 2005. Glucose metabolism at high density growth of E. coli B and E. coli K: differences in metabolic pathways are responsible for efficient glucose utilization in E. coli B as determined by microarrays and Northern blot analyses. Biotechnol. Bioeng. 90:805–820. 10.1002/bit.20478 [DOI] [PubMed] [Google Scholar]
- 53.Lee JW, Helmann JD. 2006. The PerR transcription factor senses H2O2 by metal-catalysed histidine oxidation. Nature 440:363–367. 10.1038/nature04537 [DOI] [PubMed] [Google Scholar]
- 54.Chen L, Keramati L, Helmann JD. 1995. Coordinate regulation of Bacillus subtilis peroxide stress genes by hydrogen peroxide and metal ions. Proc. Natl. Acad. Sci. U. S. A. 92:8190–8194. 10.1073/pnas.92.18.8190 [DOI] [PMC free article] [PubMed] [Google Scholar]
- 55.Fuangthong M, Herbig AF, Bsat N, Helmann JD. 2002. Regulation of the Bacillus subtilis fur and perR genes by PerR: not all members of the PerR regulon are peroxide inducible. J. Bacteriol. 184:3276–3286. 10.1128/JB.184.12.3276-3286.2002 [DOI] [PMC free article] [PubMed] [Google Scholar]
- 56.Hayashi K, Morooka N, Yamamoto Y, Fujita K, Isono K, Choi S, Ohtsubo E, Baba T, Wanner BL, Mori H, Horiuchi T. 2006. Highly accurate genome sequences of Escherichia coli K-12 strains MG1655 and W3110. Mol. Syst. Biol. 2:2006.0007. 10.1038/msb4100049 [DOI] [PMC free article] [PubMed] [Google Scholar]
- 57.Battesti A, Majdalani N, Gottesman S. 2011. The RpoS-mediated general stress response in Escherichia coli. Annu. Rev. Microbiol. 65:189–213. 10.1146/annurev-micro-090110-102946 [DOI] [PMC free article] [PubMed] [Google Scholar]
- 58.Notley-McRobb L, King T, Ferenci T. 2002. rpoS mutations and loss of general stress resistance in Escherichia coli populations as a consequence of conflict between competing stress responses. J. Bacteriol. 184:806–811. 10.1128/JB.184.3.806-811.2002 [DOI] [PMC free article] [PubMed] [Google Scholar]
- 59.King T, Ishihama A, Kori A, Ferenci T. 2004. A regulatory trade-off as a source of strain variation in the species Escherichia coli. J. Bacteriol. 186:5614–5620. 10.1128/JB.186.17.5614-5620.2004 [DOI] [PMC free article] [PubMed] [Google Scholar]
- 60.Spira B, de Almeida Toledo R, Maharjan RP, Ferenci T. 2011. The uncertain consequences of transferring bacterial strains between laboratories—rpoS instability as an example. BMC Microbiol. 11:248. 10.1186/1471-2180-11-248 [DOI] [PMC free article] [PubMed] [Google Scholar]
- 61.Spira B, Hu X, Ferenci T. 2008. Strain variation in ppGpp concentration and RpoS levels in laboratory strains of Escherichia coli K-12. Microbiology 154:2887–2895. 10.1099/mic.0.2008/018457-0 [DOI] [PubMed] [Google Scholar]
- 62.Kempf B, Bremer E. 1998. Uptake and synthesis of compatible solutes as microbial stress responses to high-osmolality environments. Arch. Microbiol. 170:319–330. 10.1007/s002030050649 [DOI] [PubMed] [Google Scholar]
- 63.Mates AK, Sayed AK, Foster JW. 2007. Products of the Escherichia coli acid fitness island attenuate metabolite stress at extremely low pH and mediate a cell density-dependent acid resistance. J. Bacteriol. 189:2759–2768. 10.1128/JB.01490-06 [DOI] [PMC free article] [PubMed] [Google Scholar]
- 64.Price MN, Deutschbauer AM, Skerker JM, Wetmore KM, Ruths T, Mar JS, Kuehl JV, Shao W, Arkin AP. 2013. Indirect and suboptimal control of gene expression is widespread in bacteria. Mol. Syst. Biol. 9:660. 10.1038/msb.2013.16 [DOI] [PMC free article] [PubMed] [Google Scholar]
- 65.Eguchi Y, Utsumi R. 23 June 2014. Alkali metals in addition to acidic pH activate the EvgS histidine kinase sensor in Escherichia coli. J. Bacteriol. 10.1128/JB.01742-14 [DOI] [PMC free article] [PubMed] [Google Scholar]
- 66.Eguchi Y, Okada T, Minagawa S, Oshima T, Mori H, Yamamoto K, Ishihama A, Utsumi R. 2004. Signal transduction cascade between EvgA/EvgS and PhoP/PhoQ two-component systems of Escherichia coli. J. Bacteriol. 186:3006–3014. 10.1128/JB.186.10.3006-3014.2004 [DOI] [PMC free article] [PubMed] [Google Scholar]
- 67.Eguchi Y, Ishii E, Hata K, Utsumi R. 2011. Regulation of acid resistance by connectors of two-component signal transduction systems in Escherichia coli. J. Bacteriol. 193:1222–1228. 10.1128/JB.01124-10 [DOI] [PMC free article] [PubMed] [Google Scholar]
- 68.Jahn S, Haverkorn van Rijsewijk BR, Sauer U, Bettenbrock K. 2013. A role for EIIANtr in controlling fluxes in the central metabolism of E. coli K12. Biochim. Biophys. Acta 1833:2879–2889. 10.1016/j.bbamcr.2013.07.011 [DOI] [PubMed] [Google Scholar]
- 69.Wolfe AJ. 2005. The acetate switch. Microbiol. Mol. Biol. Rev. 69:12–50. 10.1128/MMBR.69.1.12-50.2005 [DOI] [PMC free article] [PubMed] [Google Scholar]
- 70.Klein AH, Shulla A, Reimann SA, Keating DH, Wolfe AJ. 2007. The intracellular concentration of acetyl phosphate in Escherichia coli is sufficient for direct phosphorylation of two-component response regulators. J. Bacteriol. 189:5574–5581. 10.1128/JB.00564-07 [DOI] [PMC free article] [PubMed] [Google Scholar]
- 71.Johnson MD, Burton NA, Gutiérrez B, Painter K, Lund PA. 2011. RcsB is required for inducible acid resistance in Escherichia coli and acts at gadE-dependent and –independent promoters. J. Bacteriol. 193:3653–3656. 10.1128/JB.05040-11 [DOI] [PMC free article] [PubMed] [Google Scholar]
- 72.Hobbs EC, Astarita JL, Storz G. 2010. Small RNAs and small proteins involved in resistance to cell envelope stress and acid shock in Escherichia coli: analysis of a bar-coded mutant collection. J. Bacteriol. 192:59–67. 10.1128/JB.00873-09 [DOI] [PMC free article] [PubMed] [Google Scholar]
- 73.Dragosits M, Mozhayskiy V, Quinones-Soto S, Park J, Tagkopoulos I. 2013. Evolutionary potential, cross-stress behavior and the genetic basis of acquired stress resistance in Escherichia coli. Mol. Syst. Biol. 9:643. 10.1038/msb.2012.76 [DOI] [PMC free article] [PubMed] [Google Scholar]
- 74.Strøm AR, Kaasen I. 1993. Trehalose metabolism in Escherichia coli: stress protection and stress regulation of gene expression. Mol. Microbiol. 8:205–210. 10.1111/j.1365-2958.1993.tb01564.x [DOI] [PubMed] [Google Scholar]
- 75.Wang Y, Xu Y, Perepelov AV, Qi Y, Knirel YA, Wang L, Feng L. 2007. Biochemical characterization of dTDP-d-Qui4N and dTDP-d-Qui4NAc biosynthetic pathways in Shigella dysenteriae type 7 and Escherichia coli O7. J. Bacteriol. 189:8626–8635. 10.1128/JB.00777-07 [DOI] [PMC free article] [PubMed] [Google Scholar]
- 76.Wang HH, Isaacs FJ, Carr PA, Sun ZZ, Xu G, Forest CR, Church GM. 2009. Programming cells by multiplex genome engineering and accelerated evolution. Nature 460:894–898. 10.1038/nature08187 [DOI] [PMC free article] [PubMed] [Google Scholar]
- 77.Typas A, Nichols RJ, Siegele DA, Shales M, Collins SR, Lim B, Braberg H, Yamamoto N, Takeuchi R, Wanner BL, Mori H, Weissman JS, Krogan NJ, Gross CA. 2008. High-throughput, quantitative analyses of genetic interactions in E. coli. Nat. Methods 5:781–787. 10.1038/nmeth.1240 [DOI] [PMC free article] [PubMed] [Google Scholar]
- 78.Pickard D, Kingsley RA, Hale C, Turner K, Sivaraman K, Wetter M, Langridge G, Dougan G. 2013. A genomewide mutagenesis screen identifies multiple genes contributing to Vi capsular expression in Salmonella enterica serovar Typhi. J. Bacteriol. 195:1320–1326. 10.1128/JB.01632-12 [DOI] [PMC free article] [PubMed] [Google Scholar]
Associated Data
This section collects any data citations, data availability statements, or supplementary materials included in this article.