

Abstract
Comparisons of in vivo (mouse stomach) and in vitro (laboratory culture) transcriptomes of Lactobacillus reuteri strain 100-23 were made by microarray analysis. These comparisons revealed the upregulation of genes associated with acid tolerance, including urease production, in the mouse stomach. Inactivation of the ureC gene reduced the acid tolerance of strain 100-23 in vitro, and the mutant was outcompeted by the wild type in the gut of ex-Lactobacillus-free mice. Urine analysis showed that stable isotope-labeled urea, administered by gavage, was metabolized to a greater extent in Lactobacillus-free mice than animals colonized by strain 100-23. This surprising observation was associated with higher levels of urease activity and fecal-type bacteria in the stomach digesta of Lactobacillus-free mice. Despite the modulation of urea hydrolysis in the stomach, recycling of urea nitrogen in the murine host was not affected since the essential amino acid isoleucine, labeled with a stable isotope, was detected in the livers of both Lactobacillus-free and 100-23-colonized animals. Therefore, our experiments reveal a new and unexpected impact of Lactobacillus colonization on urea hydrolysis in the murine gut.
INTRODUCTION
A wealth of information about the genetic mechanisms and physiological capacity that enable bacterial species to inhabit specific habitats has been obtained from the study of pure cultures in the laboratory. In some cases, manipulation of physical or chemical factors has been crucial in revealing critical virulence or colonization attributes of bacterial species because they are induced only under particular conditions (1). Despite the value of in vitro studies such as these, the vast majority of microbes live in complex, dynamic environments that cannot be reproduced with any ease in the laboratory. Many of the biotic and abiotic features of the habitat are often unknown. There is clearly a need to understand bacterial function in the actual environments that they inhabit (their “secret lives”), where they are exposed to a multiplicity of beneficial and potentially harmful influences (2). Outcomes of habitat studies in which the function of particular bacteria is measured therefore help to reveal the mechanisms of ecological success of bacteria, such as gut commensals (2).
Lactobacillus reuteri strains that are rodent specific colonize the epithelial surface of the mouse forestomach. Lactobacilli sloughed from the epithelium-associated biofilm are present in the digesta in the remainder of the digestive tract (3). Much knowledge of the genetic and ecological characteristics that enhance the ability of L. reuteri to colonize the murine gut has been obtained through the study of strain 100-23 (see, for example, references 4 to 6). These studies included the use of in vivo expression technology (IVET), which showed that some Lactobacillus genes are transcribed only under in vivo conditions. It is likely that genes upregulated under in vivo conditions encode factors critical to life in the gut and provide, in part, the basis for the autochthonous nature of strain 100-23 (7, 8).
Our recent study with strain 100-23 used microarray and metabolomic comparisons of the wild type (WT) and a luxS mutant derivative to determine altered gene transcriptions and the resulting metabolic consequences to the bacteria (9). We now aim to extend knowledge of the ecological effects of colonization of the mouse stomach by strain 100-23 initiated through a microarray screen of Lactobacillus gene transcription. A new and unexpected impact of Lactobacillus colonization on global urea hydrolysis in the digestive tract was revealed using a combination of microarray comparisons of bacterial gene expression, probing of urea utilization with stable isotope-labeled urea, and in vitro experiments with strain 100-23.
MATERIALS AND METHODS
Bacterial strains.
L. reuteri 100-23C, a plasmid-free derivative of strain 100-23, was used in the experiments. The annotation of the plasmid sequences in 100-23 (GenBank accession numbers GU108604.1 and U21859.1) suggests that they do not encode metabolic activities. Cultures of this strain, here referred to as 100-23 or the WT, were grown anaerobically in lactobacillus MRS medium (MRS; Difco) at 37°C.
Lactobacillus-free mouse experiments.
Animal experimentation was approved by the University of Otago Animal Ethics Committee (approval number 02/2009). Lactobacillus-free mice were bred and maintained in Trexler isolators and fed a standard rodent diet that had been sterilized by gamma irradiation. All other materials that were used to maintain the animals were sterilized by autoclave, and standard germfree procedures were used in the general care of the animals (6). Lactobacillus-free mice do not have lactobacilli as gut inhabitants but have a large bowel microbiota typical of that of conventional mice. The mice provide animal hosts that are naive with respect to lactobacilli but whose tissues have been conditioned by exposure to a complex microbiota (10).
Lactobacillus-free mice (males and females) that were 6 weeks of age were inoculated by intragastric gavage (∼1 × 10⁶ cells per mouse) as described previously (7). Mice were inoculated with pure cultures of either the wild-type or mutant strain or, in competition experiments, with 1:1 mixtures of the mutant and wild-type strains. In experiments with mice colonized by a single Lactobacillus strain, Lactobacillus populations were measured in gut samples at 7 days after inoculation by quantitative plating on Rogosa SL agar (Difco) (11). Lactobacillus counts were determined for the forestomach, jejunum, and cecum. In competition experiments, quantification of the mutant strain as a proportion of the total Lactobacillus populations in gut samples after 7 days of colonization was achieved by determining the counts on Rogosa SL agar plates with and without erythromycin, as described previously (7). For microarray experiments, the mice were sampled 14 days after inoculation. Mice were killed by carbon dioxide anesthesia followed by cervical dislocation.
RNA extraction for transcriptome analysis.
To obtain RNA for microarray experiments, forestomach epithelial scrapings and digesta from mice (pooled from two litters of eight animals each to give two biological replicates of pooled RNA) were suspended in RNAprotect Bacteria reagent (Qiagen). Samples were centrifuged at 150 × g, the supernatant was removed and centrifuged at 300 × g, and then the supernatant was removed and bacterial cells were pelleted at 5,000 × g. Bacterial cells from the scrapings and digesta of eight mice were pooled in TRIzol reagent. To obtain RNA from cultures, cells were harvested (12,000 × g, 30 s) from 5-ml cultures of L. reuteri 100-23 grown for 4 h (log-phase growth) and 8 h (stationary-phase growth). The cell pellets were washed once with RNAprotect Bacteria reagent and suspended in 1 ml of TRIzol reagent. Duplicate samples of purified RNA were extracted as previously described (9) but with the additional step of the removal of eukaryote RNA from the in vivo samples by a MICROBEnrich kit (Ambion). The RNA to be compared by microarray analysis was amplified using a MessageAmp II Bacteria kit (Ambion). Five hundred nanograms of total RNA from the in vitro and in vivo samples in a final volume of 5 μl was used as a template. During the in vitro transcription step to synthesize amplified RNA (aRNA), the modified nucleotide 5-(3-aminoallyl)-UTP (aa-UTP; Ambion) was incorporated into the aRNA in an equal proportion to unmodified UTP. The aaUTP-labeled aRNA was hybridized to a custom-designed Agilent microarray specific for L. reuteri 100-23 (GEO accession number GPL10986, series number GSE36286). Details of the microarray hybridization are as described previously (9). Microarrays were scanned at 5 μm using a GenePix 400B scanner (photomultiplier [PMT] settings, 780 for red channel and 510 for green channel; Axon Instruments) and GenePix Pro (version 6.0) software. The GenePix array list (GAL) file was used for extraction of the microarray results. Feature extraction was performed using Agilent Feature Extraction (version 9.5.3.1) software, and microarray data were processed as described by García de la Nava et al. (12) and van Hijum et al. (13). Differential gene expression was determined by a cyber t test (14). Genes with a P value of <0.001 and greater than a 2-fold difference in expression under the two conditions were considered differentially expressed. A comparison of RNA isolated from uninoculated (Lactobacillus-free) animals with RNA extracted from a laboratory culture (see “Lactobacillus-free mouse microarray control” and Table S3 in the supplemental material) of L. reuteri 100-23 revealed 155 genes that had at least one probe on the microarray that cross-hybridized to cDNA derived from uninoculated mouse material. The genes that cross-hybridized were excluded from further analysis.
Derivation of ureC mutant.
To ascertain the biological importance of the ureC gene (Fig. 1), insertional mutagenesis was achieved by site-specific integration of the plasmid pORI28 into the L. reuteri 100-23 chromosome as described previously (15). An internal region (969 bp) of the ureC gene was amplified by PCR with the primers F_2500070114 urease (GAC TGG ATC CTT TTA CGG GCC AAC TAC TGG) and R_2500070114 urease (GAC TGA ATT CAA CGT CAT CCG GAA TCT TTG) and cloned into pORI28. Integration of the plasmid into the ureC gene was confirmed by PCR with test primers flanking the target region. The stability of the mutation was determined by serial subculture in MRS medium as described previously (15). Erythromycin (5 μg/ml) was included in the culture medium used to maintain the mutant but not in cultures used to harvest cells for RNA purification.
FIG 1.
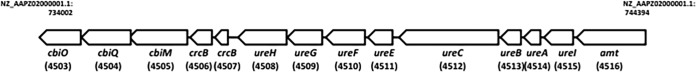
The L. reuteri 100-23 genomic region (between coordinates 734002 and 744394) containing the urease gene cluster, ammonium ion transporters, and cobalt transporters. Values in parentheses indicate the unique portion of the locus tag; for example, 4512 is locus tag Lreu23DRAFT_4512.
Acid tolerance of L. reuteri.
To test the potential benefit of ammonia production, thereby neutralizing acidity by hydrolysis of urea, the bacteria were grown in MRS broth with or without 2% (wt/vol) urea. The culture pH was measured over a 72-h period. To test the potential benefit of ammonia production on survival under acidic conditions, cultures of L. reuteri 100-23 strains were grown to an optical density (A600) of 1.0, and then the cells were harvested by centrifugation (8,000 × g, 8 min), washed three times, and suspended in 0.9% (wt/vol) sodium chloride solution (with or without 2% [wt/vol] urea) acidified to pH 2.5 using HCl. Cell viability was measured by determining the number of CFU/ml of samples collected every 2 h over 6 h at 37°C. The numbers of CFU/ml were determined by spreading aliquots of culture dilutions on plates of MRS agar medium. The plates were incubated anaerobically for 48 h at 37°C, after which the colonies were enumerated. Experiments were conducted in triplicate.
Measurement of urease activity.
To quantify urease activity in Lactobacillus cultures, bacterial cells and supernatants were collected from overnight cultures in MRS medium to which 2% (wt/vol) urea had been added. Supernatants were collected following centrifugation of the cultures for 5 min at 12,000 × g at 5°C and filtered. Deposited cells were washed twice in ultrapure water, suspended in 1 ml of 10 mM sodium phosphate buffer (pH 7.0), and then mechanically disrupted using a bead beater (40 s, 4,800 rpm). The preparation was centrifuged as described above, and the supernatant was retained as the lysate for analysis. To quantify urease activity in mouse stomach contents, digesta (100 to 200 mg) removed from mice that had been colonized for 2 weeks with strain 100-23 or that were Lactobacillus free was suspended in 1 ml of sodium phosphate buffer and then mechanically treated by bead beating (two times for 30 s each time at 4,800 rpm with cooling between treatments). The preparations were centrifuged as described above, and the supernatants were retained as the lysate. Urease activity was quantified using a urease assay kit (Abnova Corporation, Taipei, Taiwan) according to the manufacturer's protocol. Results were normalized by reference to the protein content of the preparations (Bio-Rad Quick Start Bradford protein assay). Triplicate assays of the preparations were conducted.
Genomic analysis.
The annotated genome sequence (4) of strain 100-23 was examined to reveal pathways associated with urea hydrolysis. KEGG metabolic pathway tools (www.genome.jp/kegg/) were used to identify general pathways related to urea hydrolysis, while the Integrated Microbial Genomes (IMG) system of the Joint Genome Institute (JGI) was used to assess the specific characteristics of strain 100-23 relevant to urease.
Ammonia from urea hydrolysis as potential nitrogen source for strain 100-23.
Urea present in the saliva and gastric juice of the rodent host could provide an ammonium source for urease-producing bacteria (16, 17). Therefore, experiments were conducted using defined medium to test whether ammonia generated from the hydrolysis of urea could be utilized by L. reuteri 100-23 as a nutrient source (amino acid synthesis). The JGI annotation pipeline, displayed in the IMG genome browser, suggested that strain 100-23 was prototrophic for some amino acids. Four of these (asparagine, glutamine, aspartic acid, glutamic acid) could potentially be synthesized using ammonia derived from urea hydrolysis as the nitrogen source. Experiments based on the work of Teusink et al. (18) were carried out using a basal medium (pH 6.7; Table 1) that did not contain l-glutamic acid (as an exemplar amino acid) but that was supplemented with urea or ammonium citrate as potential nitrogen sources. Basal medium and medium containing l-glutamic acid were used as controls. Two-milliliter volumes of culture medium were inoculated with 50 μl of overnight growth in MRS medium–2% urea of either the WT or ureC mutant, the cultures were incubated anaerobically for 24 h at 37°C, and the optical density (A600) of the cultures was measured. Experiments were conducted in triplicate.
TABLE 1.
Basal medium and supplements used in growth experiments
| Ingredienta | Concn/100 ml |
|---|---|
| l-Alanine | 0.024 g |
| l-Arginine | 0.012 g |
| l-Aspartic acid | 0.042 g |
| l-Cysteine-HCl | 0.013 g |
| l-Glycine | 0.017 g |
| l-Histidine | 0.015 g |
| l-Isoleucine | 0.021 g |
| l-Leucine | 0.047 g |
| l-Lysine | 0.044 g |
| l-Methionine | 0.012 g |
| l-Phenylalanine | 0.027 g |
| l-Proline | 0.067 g |
| l-Serine | 0.034 g |
| l-Threonine | 0.022 g |
| l-Tryptophan | 0.005 g |
| l-Tyrosine | 0.025 g |
| l-Valine | 0.032 g |
| Adenine | 0.001 g |
| Cytidine | 0.001 g |
| Thymine | 0.001 g |
| Xanthine | 0.001 g |
| Guanine | 0.001 g |
| Thymidine | 0.001 g |
| Uridine | 0.001 g |
| ATCC trace mineral supplementb | 1.0 ml |
| ATCC trace vitamin supplementc | 1.0 ml |
| Dipotassium phosphate | 0.1 g |
| Monopotassium phosphate | 0.5 g |
| Sodium acetate | 0.1 g |
| Glucose | 1.0 g |
| Tween 80 | 0.1 ml |
Supplements were ammonium sulfate at 0.2 g/100 ml, l-glutamic acid at 0.05 g/100 ml, and urea at 0.2 g/100 ml.
Catalogue number MD-TMS, American Type Culture Collection, Manassas, VA.
Catalogue number MD-VS, American Type Culture Collection.
Stable isotope-labeled urea probing.
To determine the fate of urea when introduced into the murine digestive tract, mice (matched for gender and age, 4 mice per group) colonized with the WT or the ureC mutant or Lactobacillus-free mice were administered 25 mg of 99 atom% [13C]urea and 98 atom% [5N]urea (catalogue number 490954; Aldrich, St. Louis, MO) by gavage. Six hours later, the mice were killed and liver and urine were collected at autopsy. The samples from each group of mice were pooled for analysis. Protein hydrolysis of these murine specimens was carried out as follows. An aliquot (200 μl) of the liver samples prepared in water (10 mg/ml) and a 10-μl aliquot of the urine were taken to provide an estimated 2 mg (dry weight) of sample for hydrolysis of the proteins. The samples were lyophilized in 5-ml long-stem Vacule cryogenic ampoules (Aldrich) in triplicate. The dried samples and a sample of bovine serum albumin (BSA; 2 mg) were suspended carefully in 200 μl of 6 M HCl containing 0.25% phenol. The tubes were placed under nitrogen and under vacuum, sealed, and incubated at 150°C for 1 h. dl-2-Aminobutyric acid (50 μg; 50 μl of a 1-mg/ml aqueous solution; catalog number 8.18855.0025; Merck) was added to the hydrolysate as an internal standard, and the mixture was transferred to a clean borosilicate, screw-top tube and dried under a stream of argon. Dry acetonitrile (500 μl) was added to the tubes and evaporated under a stream of argon. The hydrolysates were derivatized by adding dry acetonitrile (100 μl) and N-(tert-butyldimethylsilyl)-N-methyltrifluoroacetamide (MTBSTFA; 100 μl). The reaction mixture was placed under argon, and the tightly capped tubes were incubated (80°C) for 1 h. The cooled solutions were diluted in an appropriate volume of acetonitrile for analysis by gas chromatography-mass spectrometry (GC-MS). Standard amino acids (LAA-21; Sigma) and urea were made up in 50 mM HCl (1 mg/ml). A 50-μg aliquot of each stock standard solution with 50 μg of the internal standard was lyophilized and derivatized for GC-MS analysis in duplicate, as described above. The GC-MS (6890/MSD5973 system; Agilent) conditions were as follows: source temperature, 150°C; quadrupole temperature, 150°C; interface temperature, 320°C; injector temperature, 250°C; emission, 150 μA; and ionization voltage, 70 eV. The resulting tert-butyldimethylsilyl derivatives were injected (1 μl) onto an HP-5 MS capillary column (25 m, 0.25-mm inner diameter, 0.25-μm film thickness), held at 100°C for 1 min, and submitted to a 10°C/min gradient to 300°C. Helium was the carrier gas (1.2 ml/min). Selective ion monitoring of appropriate mass fragments was done to determine the difference in the ratio of stable isotopes between samples and unlabeled standards. The molecular mass of the tBDMS derivative of unlabeled urea is 288 Da, and the primary ion from fragmentation in the mass spectrometer has an m/z of 231, resulting from a loss of tert-butyl, and is designated [M-57]+. For the stable isotope-labeled urea derivatives, m/z ratios that reflect the number of isotope labels (i.e. [M-57]+ = m/z 232, 233, or 234 for singly, doubly, and triply labeled urea, respectively) were obtained. Similarly, the primary fragmentation ion from the tBDMS derivative of unlabeled iso-leucine has an m/z of 200, resulting from a loss of CO2-tBDMS, and is designated [M-159]+. The labeled derivatives have an m/z of 201, 202, or 203 for singly, doubly, and triply labeled urea, respectively. The error was measured using a Student t test with the confidence interval set at 95%.
Abundances of bacterial groups in stomach digesta.
To investigate whether the composition of the collection of commensal bacteria in stomach digesta differed among Lactobacillus-colonized and Lactobacillus-free mice, 100 mg of stomach digesta was added to a tube containing 300 mg of zirconium beads (diameter, 0.1 mm) and 1 ml of sterile TN150 buffer (10 mM Tris-HCl, 150 mM NaCl [pH 8]). The digesta was mixed by vortexing, and bacterial cells were pelleted by centrifugation (14,600 × g, 5 min, 4°C). The supernatant was discarded, and the pellet was suspended in 1 ml of TN150 buffer. The tubes were placed in a mini-bead beater (Biospec Products, Bartlesville, OK), shaken at 5,000 rpm for 3 min, cooled on ice for 1 min, and centrifuged at 14,600 × g (5 min, 5°C). Five hundred microliters of the supernatant was extracted sequentially with 500 μl of TE buffer (10 mM Tris, 1 mM EDTA [pH 8.5])-saturated phenol and with chloroform-isoamyl alcohol (24:1). The sequential phenol and chloroform extractions were repeated a further two times. The cleaned DNA was precipitated overnight by the addition of 2 volumes of cold ethanol and 0.1 volume of 3 M sodium acetate at −20°C. The preparations were centrifuged at 14,600 × g (20 min, −5°C), and the pellets were dried at room temperature and then dissolved in 50 μl of TE buffer. The DNA solution was diluted 1/20 with water prior to quantitative PCR. Real-time quantitative PCR (qPCR) was carried out using an ABI 7500 Fast system in MicroAmp Fast optical 96-well plates with optical adhesive film (Applied Biosystems, Foster City, CA). Primers targeting the 16S rRNA genes of all bacteria and selected bacterial groups commonly found in the fecal microbiota were purchased from Invitrogen (Life Technologies NZ Ltd., Auckland, New Zealand) and are listed in Table 2. The species used to derive the Lachnospiraceae-specific qPCR primers are given in Tables S1 and S2 in the supplemental material. All reactions were carried out in a final volume of 20 μl containing 1× Fast SYBR green PCR master mix (Applied Biosystems), 300 nM each primer, and 2 μl of template DNA. The thermocycling program consisted of an initial activation of the polymerase at 95°C for 30 s, followed by 40 cycles of 95°C for 10 s and 60°C for 30 s. Fluorescence levels were measured after the 60°C annealing/extension step. A melt curve was generated to analyze product specificity. Standard curves were generated using genomic DNA extracted from L. reuteri strain 100-23 and group-specific bacterial species using a Qiagen DNeasy blood and tissue kit and following the protocol for Gram-positive bacteria. The standard DNAs were quantified spectrophotometrically using a NanoDrop 1000 spectrophotometer (Thermo Scientific) and diluted in 10-fold steps from 5 × 10⁶ to 5 × 101 genomes per reaction mixture, and calculations were performed using the number of target gene copies per genome obtained from genome sequence information (NCBI). All reactions were carried out in duplicate and were run twice on separate plates. No-template controls were also included on each plate. The qPCR results were normalized according to the total 16S rRNA gene target abundance, as measured by qPCR using primers targeting all bacteria (uniF/uniR). Statistical comparisons of abundances were made by Mann-Whitney nonparametric analysis.
TABLE 2.
Primers for qPCR measurements of bacterial groups in stomach digesta
| Primer | Sequence | Target | Reference or source |
|---|---|---|---|
| UniF | ACTCCTACGGGAGGCAGCAGT | All bacteria | 19 |
| UniR | ATTACCGCGGCTGCTGGC | All bacteria | |
| LachnoF | GGGGAGTACGTTCGCAAGAA | Lachnospiraceae | This study |
| LachnoR | CAACCATGCACCACCTGTC | Lachnospiraceae | |
| F Clept | CCTTCCGTGCCGSAGTTA | Clostridial cluster IV | 20 |
| R Clept | GAATTAAACCACATACTCCACTGCTT | Clostridial cluster IV | |
| F Cocc | GACGCCGCGTGAAGGA | Clostridial cluster XIVa | 20 |
| R Cocc | AGCCCCAGCCTTTCACATC | Clostridial cluster XIVa | |
| F Bacter | GGTGTCGGCTTAAGTGCCAT | Bacteroidales | 19 |
| R Bacter | CGGAYGTAAGGGCCGTGC | Bacteroidales | |
| F Lacto | AGCAGTAGGGAATCTTCCA | Lactobacilli | 20 |
| R Lacto | CGCCACTGGTGTTCYTCCATATA | Lactobacilli |
Accession number.
Study data have been submitted in the GEO database under accession number GSE36286.
RESULTS
Comparisons of L. reuteri in vitro and in vivo transcriptomes.
Microarray results were analyzed for evidence of in vivo-induced genes that might be important in colonization of the stomach. In total, 620 genes in the transcriptome of L. reuteri 100-23 harvested from the mouse stomach were differentially expressed by at least 2-fold compared to the level of expression by log-phase cells from broth culture. Of these, 210 genes showed higher levels of expression in the in vivo samples. This compared to 431 genes that were differentially expressed in the comparison to stationary-phase cells, with 98 genes being expressed at higher levels in the in vivo samples. Sixty-five genes were consistently upregulated in both transcriptome comparisons (Table 3). Genes encoding acid tolerance mechanisms were among the most highly upregulated L. reuteri 100-23 genes in the stomach. These included the genes Lreu23DRAFT_3554 to Lreu23DRAFT_3556, which encode the gls3-gadB glutamine and glutamate decarboxylase system, and LreuDRAFT-5115 (gls2), which encodes a second glutaminase. A second upregulated locus encoded subunits of the urease enzyme, nickel transport, and accessory proteins. The glutamate decarboxylase system and some of the urease gene cluster (Lreu23DRAFT_4503, Lreu23DRAFT_4506, Lreu23DRAFT_4511) are specific to strains of L. reuteri isolated from rodents (i.e., they are not in human-associated strains, which are distinguished by production of reuterin and cobalamin) (4). A complete list of gene expression comparisons between in vivo- and in vitro-derived samples is given in Data Set S1 in the supplemental material.
TABLE 3.
Genes significantly upregulateda in vivo compared to their regulation in log- and stationary-phase in vitro cultures of L. reuteri 100-23
| Locus tag | Function | Fold change |
|
|---|---|---|---|
| In vivo vs log phase | In vivo vs stationary phase | ||
| Lreu23DRAFT_3035 | Peptidase S9 prolyl oligopeptidase active-site-domain protein | 3.00 | 2.41 |
| Lreu23DRAFT_3037 | Peptidase M20 | 2.63 | 2.31 |
| Lreu23DRAFT_3042 | Polar amino acid ABC transporter, inner membrane subunit | 2.92 | 2.24 |
| Lreu23DRAFT_3071 | Segregation and condensation protein B | 2.37 | 2.41 |
| Lreu23DRAFT_3199 | DNA-protecting protein DprA | 2.72 | 2.68 |
| Lreu23DRAFT_3317 | Hypothetical protein Lreu23DRAFT_3317 | 9.74 | 2.04 |
| Lreu23DRAFT_3361 | Conserved hypothetical protein | 45.94 | 5.10 |
| Lreu23DRAFT_3362 | Hypothetical protein Lreu23DRAFT_3362 | 34.22 | 2.88 |
| Lreu23DRAFT_3383 | Polyphosphate kinase | 2.97 | 2.14 |
| Lreu23DRAFT_3384 | Ppx/GppA phosphatase | 2.45 | 2.06 |
| Lreu23DRAFT_3392 | Nitrilase/cyanide hydratase and apolipoprotein N-acyltransferase | 7.37 | 2.79 |
| Lreu23DRAFT_3393 | Aminotransferase classes I and II | 8.06 | 5.80 |
| Lreu23DRAFT_3394 | 2-Dehydropantoate 2-reductase | 6.97 | 3.03 |
| Lreu23DRAFT_3400 | YbaK/prolyl-tRNA synthetase-associated region | 2.23 | 2.01 |
| Lreu23DRAFT_3551 | Oxalyl coenzyme A decarboxylase | 7.98 | 3.23 |
| Lreu23DRAFT_3552 | Formyl coenzyme A transferase | 5.76 | 2.95 |
| Lreu23DRAFT_3553 | Xanthine/uracil/vitamin C permease | 4.40 | 6.67 |
| Lreu23DRAFT_3554b | Glutamate decarboxylase | 121.67 | 10.96 |
| Lreu23DRAFT_3555b | Glutamate/γ-aminobutyrate antiporter | 84.44 | 11.21 |
| Lreu23DRAFT_3556b | Glutaminase | 55.36 | 3.48 |
| Lreu23DRAFT_3668 | Amidohydrolase | 10.53 | 3.06 |
| Lreu23DRAFT_3669 | Dihydrodipicolinate synthase | 9.44 | 2.48 |
| Lreu23DRAFT_3670 | Dihydrodipicolinate reductase | 9.52 | 3.15 |
| Lreu23DRAFT_3671 | Aminotransferase classes I and II | 8.34 | 2.04 |
| Lreu23DRAFT_3763 | Homocysteine S-methyltransferase | 2.14 | 2.21 |
| Lreu23DRAFT_3764 | Amino acid permease-associated region | 2.02 | 2.34 |
| Lreu23DRAFT_4046 | Transcriptional regulator, TetR family | 8.55 | 2.42 |
| Lreu23DRAFT_4170 | Dihydroorotate dehydrogenase family protein | 3.97 | 3.63 |
| Lreu23DRAFT_4171 | FAD-dependent pyridine nucleotide-disulfide oxidoreductase | 3.34 | 2.82 |
| Lreu23DRAFT_4328 | Ammonium transporter | 2.67 | 2.34 |
| Lreu23DRAFT_4434 | ABC transporter related | 2.24 | 2.40 |
| Lreu23DRAFT_4435 | Extracellular solute-binding protein family 3 | 2.06 | 2.69 |
| Lreu23DRAFT_4471 | Major facilitator superfamily MFS_1 | 2.16 | 2.42 |
| Lreu23DRAFT_4485 | Hypothetical protein Lreu23DRAFT_4485 | 2.50 | 3.81 |
| Lreu23DRAFT_4499 | Phosphate ABC transporter, inner membrane subunit PstA | 2.18 | 2.19 |
| Lreu23DRAFT_4501 | Phosphate binding protein | 4.62 | 3.98 |
| Lreu23DRAFT_4505c | Cobalamin (vitamin B12) biosynthesis CbiM protein | 60.04 | 2.16 |
| Lreu23DRAFT_4507c | Camphor resistance CrcB protein | 58.79 | 2.74 |
| Lreu23DRAFT_4508c | Urease accessory protein UreD | 132.10 | 2.38 |
| Lreu23DRAFT_4510c | Urease accessory protein UreF | 98.49 | 2.89 |
| Lreu23DRAFT_4512c | Urease, alpha subunit, UreC | 85.18 | 2.00 |
| Lreu23DRAFT_4513c | Urease, beta subunit, UreB | 96.49 | 2.54 |
| Lreu23DRAFT_4515c | AmiS/UreI transporter | 114.69 | 2.45 |
| Lreu23DRAFT_4516c | Ammonium transporter | 73.65 | 2.33 |
| Lreu23DRAFT_4526 | Integral membrane protein | 12.42 | 3.46 |
| Lreu23DRAFT_4527 | LPXTG motif cell wall anchor domain protein | 2.75 | 2.20 |
| Lreu23DRAFT_4574 | YhgE/Pip C-terminal domain protein | 2.13 | 4.97 |
| Lreu23DRAFT_4575 | Transcriptional regulator, TetR family | 3.05 | 2.09 |
| Lreu23DRAFT_4622 | Alcohol dehydrogenase GroES domain protein | 2.32 | 2.18 |
| Lreu23DRAFT_4632 | Small GTP-binding protein | 2.50 | 2.42 |
| Lreu23DRAFT_4641 | Peptidase U34 dipeptidase | 2.79 | 2.07 |
| Lreu23DRAFT_4770 | Methionine synthase, vitamin B12 independent | 4.00 | 2.19 |
| Lreu23DRAFT_4886 | Conserved hypothetical protein | 8.22 | 3.72 |
| Lreu23DRAFT_4888 | Aldehyde dehydrogenase | 4.52 | 3.16 |
| Lreu23DRAFT_4904 | d-Isomer-specific 2-hydroxyacid dehydrogenase, NAD binding | 6.53 | 3.46 |
| Lreu23DRAFT_4905 | Aminotransferase classes I and II | 5.85 | 2.86 |
| Lreu23DRAFT_4907 | ATPase AAA-2 domain protein | 5.55 | 2.96 |
| Lreu23DRAFT_4916 | Major facilitator superfamily MFS_1 | 4.55 | 13.99 |
| Lreu23DRAFT_4938 | Major facilitator superfamily MFS_1 | 3.00 | 5.74 |
| Lreu23DRAFT_4951 | Amino acid permease-associated region | 3.13 | 6.87 |
| Lreu23DRAFT_4985 | Phosphoribosylaminoimidazole carboxylase, ATPase subunit | 4.63 | 2.09 |
| Lreu23DRAFT_4990 | Phosphoribosylformylglycinamidine synthase II | 2.25 | 2.20 |
| Lreu23DRAFT_5034 | Binding-protein-dependent transport systems, inner membrane component | 2.13 | 2.69 |
| Lreu23DRAFT_5115d | Glutaminase | 61.64 | 6.27 |
| Lreu23DRAFT_5177 | l-Serine dehydratase, iron-sulfur dependent, alpha subunit | 2.83 | 2.31 |
Genes with a P value of <0.001 and greater than a 2-fold difference in expression under the two conditions were considered differentially expressed.
Genes encoding glutamate decarboxylase and a glutaminase (gls3-gadB operon).
Genes encoding urease subunits and accessory proteins.
Genes encoding a glutaminase (gls2).
Properties of ureC mutant.
Urease activity was detected in the culture supernatant of the wild type but not that of the ureC mutant (Fig. 2A and B), whereas only low background levels of activity were detected in cell lysates. The culture medium pH was raised during growth of the WT in the presence of urea but was unchanged relative to that for the nonurea controls in cultures of the mutant (Fig. 2C). Survival in acidified suspensions was enhanced by addition of urea to the preparation of WT cells but was unchanged in the case of the mutant (Fig. 2D). The mutant strain was able to colonize the digestive tract of mice when introduced as a pure culture but was almost eliminated from the gut in competition with the WT (Fig. 2E and F).
FIG 2.

(A) Urease activity in cell lysates of wild-type (WT) strain 100-23C and the ureC mutant of 100-23C. (B) Urease activity in cell-free culture supernatants of the WT and ureC mutant. (C) pH of cultures of WT and mutant (UreC−) strains with or without the addition of urea to the medium. Note the neutralization of acidity by the WT in the presence of urea. (D) Survival of WT and mutant (UreC−) strains in acidified saline over time. Note the enhanced survival of the WT in the presence of urea. (E) Colonization of Lactobacillus-free mice by the ureC mutant. (F) Proportion of total lactobacilli comprised of the ureC mutant in the gut of mice coinoculated with the wild type and mutant. FS, forestomach; JEJ, jejunum; CAEC, cecum. Means and SEMs are shown (laboratory experiments, n = 3; animal experiments, n = 5).
Growth experiments in basal medium supplemented with urea.
WT and mutant strains showed similar growth properties (Fig. 3). The basal medium (lacking l-glutamic acid) supported a minimal level of growth of the strains, which may have been aided by carryover of nutrients from the inoculum. Substantial growth occurred when l-glutamate was added to the basal medium but not when urea or ammonium citrate was provided as a potential source of nitrogen. Therefore, it was unlikely that the production of urease was a nitrogen-scavenging activity in the digestive tract for L. reuteri 100-23.
FIG 3.
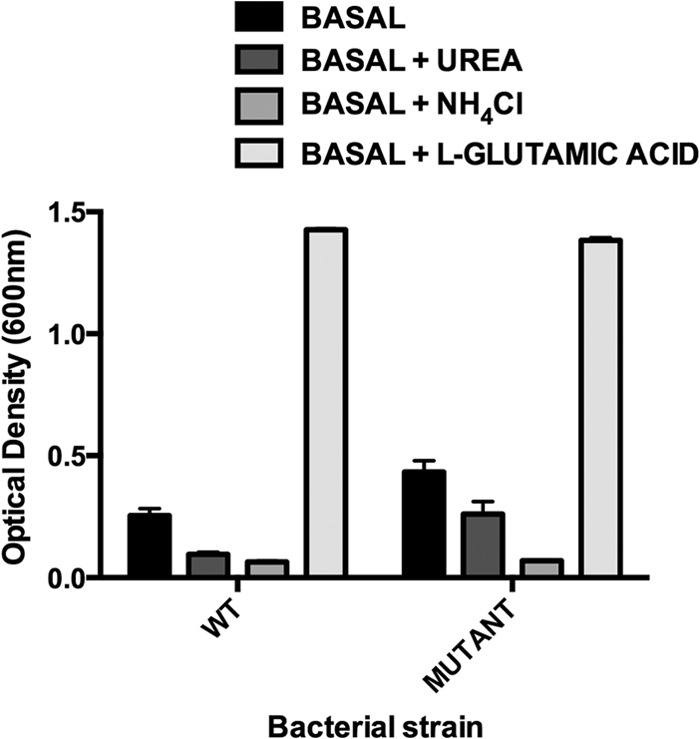
Growth of WT strain 100-23C and the ureC mutant in defined medium. Basal medium did not contain l-glutamic acid. Means and SEMs from triplicate experiments are shown. See Table 1 for further details.
Stable isotope-labeled urea probing.
Ammonia, a common by-product of the metabolism of nitrogenous compounds in mammals, is converted to urea in the liver. Urea provides a safe vehicle for the transport and excretion of excess nitrogen through the kidneys. Detection of the isotopic forms of urea in urine following introduction of [13C, 15N]urea into the gut provides a method of determining the extent of hydrolysis and resynthesis of urea from 13CO2 and 15NH3 in the animal body. Nonmetabolized urea appears in the urine triply labeled with stable isotopes (one 13C isotope, two 15N isotopes). Urea synthesized from the constituents of hydrolyzed stable isotope-labeled urea is singly or doubly labeled (13C, 15N, 13C and 15N) because of the mixing of labeled and unlabeled constituents in the body. Some of the stable isotopes enter other biosynthetic pathways. Colonization of the gut of mice with L. reuteri 100-23 affected the amount of urea hydrolysis because the greatest difference in the isotopic ratio relative to unlabeled reference urea was for triply labeled urea in the urine of these animals. This was consistent with the excretion of mostly nonmetabolized [13C, 15N]urea. More hydrolysis of urea occurred in the gut of Lactobacillus-free mice because less triply labeled urea was detected in the urine (Fig. 4A). The essential amino acid isoleucine, which was mostly labeled with 15N but which had some molecules doubly labeled (13C, 15N), was detected in the livers (Fig. 4B) of all mice, indicating that overall recycling of urea was not affected by the presence of strain 100-23 to an extent that might compromise mouse nutrition.
FIG 4.
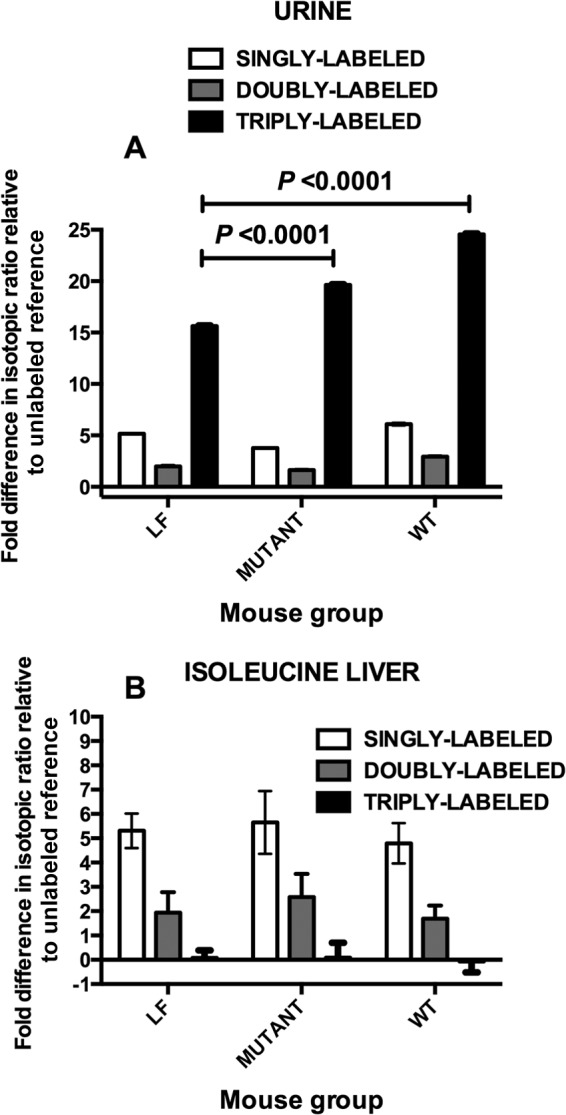
Fate of stable isotope-labeled urea in mice administered [13C, 15N]urea by gavage detected by GC-MS selective ion monitoring of MBTSTFA derivatives of urea and amino acids in triplicate hydrolysates of urine (A) and liver (B). (A) Comparison of stable isotope-labeled urea for the [M-57]+ (molecular mass less the tert-butyl) fragment detected in urine; (B) comparison of stable isotope-labeled isoleucine for the [M-159]+ (molecular mass less CO2-tBDMS) fragment detected in livers. LF, Lactobacillus-free mice; MUTANT, mice colonized by ureC mutant; WT, wild-type strain 100-23C. Means and SEMs are shown. Specimens from four mice per group were analyzed.
Abundance of bacterial groups in stomach digesta.
Sequences corresponding to Lactobacillus reuteri DNA targets predominated in the stomach of ex-Lactobacillus-free mice colonized by strain 100-23 (Fig. 5A), whereas bacterial groups characteristic of those found in feces dominated in the stomach digesta of Lactobacillus-free mice (Fig. 5B to E). The predominance of fecal-type bacteria was associated with a higher level of urease activity compared to that in Lactobacillus-colonized mice (Fig. 5F).
FIG 5.

(A to E) Abundances of bacterial groups in the stomach digesta of Lactobacillus-free (control) and Lactobacillus 100-23-colonized mice measured by qPCR. Means and SEMs are shown. (F) Urease activity in stomach contents of Lactobacillus-free (control) and Lactobacillus 100-23-colonized mice. Five mice were in each group.
DISCUSSION
A striking feature of our results obtained by microarray comparisons was the upregulation of genes associated with urea hydrolysis, glutamate decarboxylation, and glutamine metabolism in vivo relative to their regulation in vitro. These functional attributes are related to acid tolerance through the production of ammonia and amines from urea hydrolysis and from glutamate decarboxylation and glutamine metabolism, respectively, which modify habitat pH. The mouse gastric region contains two well-defined areas, the nonglandular (absence of HCl secretion) forestomach, which is lined with a keratinized, squamous epithelium, and a glandular stomach (corpus). The forestomach and glandular stomach are separated by a ridge, the margo plicatus. The forestomach is thus not just a region but is a distinct anatomical structure that serves to store food prior to digestion by murine processes. Rodent strains of L. reuteri have the capacity to adhere to and to proliferate on the epithelial surface of the forestomach, forming a biofilm (5). Although the pH of the forestomach biofilm is not known, it is likely that fermentation results in an acidic environment in which the bacteria must live. The stomach content, when food is present, has a pH of ∼3.0 (21). Mutation of the ureC gene resulted in the loss of urea hydrolysis, the loss of acid tolerance, and impaired ecological success in competition with the WT strain. In previous work, mutation of the strain 100-23 dltA gene, associated with d-alanylation of lipoteichoic acids in the bacterial cell wall, also resulted in lowered acid tolerance and poor in vivo competition with the WT (22). L. reuteri 100-23, although a rodent isolate, ferments sourdough. As demonstrated by Su et al. (23), addition of glutamate to a suspension of 100-23 cells in acidified phosphate buffer improved survival 100-fold relative to that in buffer alone. A strain mutated in the glutamate decarboxylase gene, a ΔgadB strain, did not have improved survival. Analogous to colonization experiments in mice with mutated strains of 100-23 (4, 7), the ΔgadB strain was able to grow in sourdough but was outcompeted by WT in backsloped sourdough fermentations. Recently, the protective role of glutamine deamidation, which functions independently of glutamate decarboxylation (gadB) and which is facilitated by gls3 at pH 2.5 but not pH 3.5, was demonstrated (24). This study also identified the contribution of the arginine deiminase pathway to L. reuteri 100-23 acid tolerance at pH 3.5 but not at pH 2.5. The arginine deiminase gene (Lreu23DRAFT_3505) was not upregulated in the mouse stomach (see Data Set S1 in the supplemental material), and its expression level was reduced during exponential growth in sourdough fermentation (24). Similar to the situation in the mouse stomach, gls3 and gadB were highly upregulated during 100-23 sourdough cultivation. A second glutaminase, gls2, was highly upregulated in the mouse stomach but only slightly overexpressed in the sourdough environment (24). Our comparisons of gene transcription are further supported by comparative metatranscriptomic analysis of gene expression in the conventional mouse forestomach (which contains a mixture of Lactobacillus species) relative to that in the hindgut (which contains a mixture of lactobacilli and other commensals), which also showed the upregulation of genes associated with acid tolerance mechanisms in the stomach habitat (25). Collectively, these observations demonstrate the importance of multiple acid tolerance mechanisms for strain 100-23.
Lactobacillus colonization of a similar anatomical structure, the crop, in the anterior digestive tract of birds also involves the formation of an epithelium-associated biofilm (26). The acid pH of the digesta in the crop is due to the activities of lactobacilli and prevents colonization by Escherichia coli (27). Our comparisons of the abundances of different kinds of bacteria in the stomach of mice with or without strain 100-23 showed the marked effect of colonization of the anterior gut of a mammalian host by lactobacilli. In the absence of lactobacilli, fecal-type bacteria (mice are coprophagous animals) were present in much greater abundance. Analogous to the findings for the crop, this might be detrimental to the mouse because the food might not be acidified to the same extent as it is when lactobacilli are present. An altered stomach bacteriology might alter immunological factors in the small bowel, where L. reuteri 100-23 has a downregulating effect on the immune system (28). The presence of fecal bacteria in greater abundance in the digesta might be proinflammatory (29).
We found that the biochemistry of the stomach digesta was affected in association with changes in relative bacterial abundances. The amount of urease activity in the stomachs of mice colonized or not colonized by strain 100-23 was different. With lactobacilli present, urease activity was less, presumably due to the suppression of fecal-type bacteria. More urease activity in the stomach of Lactobacillus-free animals might affect urea nitrogen recycling in the murine host. By analogy with ruminants, urea entering the stomach could be later absorbed into the blood or hydrolyzed in the gut by bacterial activity (30). Stomach bacteria, through the de novo synthesis of amino acids, could utilize the ammonia resulting from urea hydrolysis. These amino acids would become available to the animal host following subsequent digestion of bacterial cells in the small intestine. Alternatively, ammonia could be absorbed from the anterior gut and carried to the liver, where it would be detoxified by the synthesis of urea, most of which is excreted in the urine. Some blood-borne urea would diffuse into the lumen of the large bowel, where members of the microbiota hydrolyze urea and synthesize amino acids using the ammonia. This interwoven relationship between the gut microbiota and the mammalian host might be affected by the amount of urea hydrolysis in the stomach, just as it is when the rumen ecosystem is altered (31). De novo synthesis of amino acids from urea nitrogen by strain 100-23 could have been important in nitrogen salvage in the murine host. However, despite some genomic evidence that a limited number of amino acids could be synthesized by strain 100-23, a laboratory investigation using basal medium lacking l-glutamate showed that this was unlikely to occur.
Experiments with stable isotope-labeled urea showed that urea nitrogen turnover was greater when lactobacilli were absent, since there tended to be less triply labeled urea in the urine of the animals without the WT strain. Interestingly, urea nitrogen recycling occurred to the same level in both Lactobacillus-colonized and Lactobacillus-free mice, as evidenced by the de novo synthesis of isoleucine, one of the essential amino acids (32). Since this amino acid cannot be synthesized by mouse enzymes, the availability of isoleucine for the host is (apart from food) dependent on bowel, rather than stomach, bacteria.
Our series of experiments involving comparisons of the results of gene transcription, bacterial mutagenesis, and biochemical and microbiota analysis, as well as analysis of murine physiology, revealed that Lactobacillus urease activity in the stomach resulted in urea hydrolysis (stable isotope studies), the acid tolerance of L. reuteri 100-23, and a reduction in the abundance of other kinds of bacteria in the stomach when lactobacilli were present. These studies therefore improve knowledge of the commensal ecology in all of its complexity and reinforce the importance of these microbes to the welfare of their hosts.
Supplementary Material
ACKNOWLEDGMENTS
The research was supported by a grant from the Marsden Fund, administered by the Royal Society of New Zealand. The work at P.W.O.'s laboratory was supported by a principal investigator award (07/IN.1/B1780) from Science Foundation Ireland and by a center grant to the APC.
Footnotes
Published ahead of print 25 July 2014
Supplemental material for this article may be found at http://dx.doi.org/10.1128/AEM.01876-14.
REFERENCES
- 1.Angelichio MJ, Camilli A. 2002. In vivo expression technology. Infect. Immun. 70:6518–6253. 10.1128/IAI.70.12.6518-6523.2002 [DOI] [PMC free article] [PubMed] [Google Scholar]
- 2.Rediers H, Rainey PB, Vanderleyden J, de Moti R. 2005. Unraveling the secret lives of bacteria: use of in vivo expression technology and differential fluorescence induction promoter traps as tools for exploring niche-specific gene expression. Microbiol. Mol. Biol. Rev. 69:217–261. 10.1128/MMBR.69.2.217-261.2005 [DOI] [PMC free article] [PubMed] [Google Scholar]
- 3.Tannock GW. 1992. Lactic microflora of pigs, mice and rats, p 21–48 In Wood BJ. (ed), The lactic acid bacteria, vol 1 The lactic acid bacteria in health Elsevier Applied Science, London, United Kingdom [Google Scholar]
- 4.Frese SA, Benson AK, Tannock GW, Loach DM, Kim J, Zhang M, Oh PL, Heng NC, Patil PB, Juge N, Mackenzie DA, Pearson BM, Lapidus A, Dalin E, Tice H, Goltsman E, Land M, Hauser L, Ivanova N, Kyrpides NC, Walter J. 2011. The evolution of host specialization in the vertebrate gut symbiont Lactobacillus reuteri. PLoS Genet. 7:e1001314. 10.1371/journal.pgen.1001314 [DOI] [PMC free article] [PubMed] [Google Scholar]
- 5.Tannock GW, Wilson CM, Loach D, Cook GM, Eason J, O'Toole PW, Holtrop G, Lawley B. 2012. Resource partitioning in relation to cohabitation of Lactobacillus species in the mouse forestomach. ISME J. 6:927–938. 10.1038/ismej.2011.161 [DOI] [PMC free article] [PubMed] [Google Scholar]
- 6.Sims IM, Frese SA, Walter J, Loach D, Wilson M, Appleyard K, Eason J, Livingston M, Baird M, Cook G, Tannock GW. 2011. Structure and functions of exopolysaccharide produced by gut commensal Lactobacillus reuteri 100-23. ISME J. 5:1115–1124. 10.1038/ismej.2010.201 [DOI] [PMC free article] [PubMed] [Google Scholar]
- 7.Walter J, Heng NC, Hammes WP, Loach DM, Tannock GW, Hertel C. 2003. Identification of Lactobacillus reuteri genes specifically induced in the mouse gastrointestinal tract. Appl. Environ. Microbiol. 69:2044–2051. 10.1128/AEM.69.4.2044-2051.2003 [DOI] [PMC free article] [PubMed] [Google Scholar]
- 8.Tannock GW. 2004. A special fondness for lactobacilli. Appl. Environ. Microbiol. 70:3189–3194. 10.1128/AEM.70.6.3189-3194.2004 [DOI] [PMC free article] [PubMed] [Google Scholar]
- 9.Wilson CM, Aggio RB, O'Toole PW, Villas-Boas S, Tannock GW. 2012. Transcriptional and metabolomics consequences of luxS inactivation reveal a metabolic rather than quorum-sensing role for LuxS in Lactobacillus reuteri 100-23. J. Bacteriol. 194:1743–1746. 10.1128/JB.06318-11 [DOI] [PMC free article] [PubMed] [Google Scholar]
- 10.Tannock GW. 2009. Research for the 21st century: can we draw a blueprint of the bowel ecosystem? Biosci. Microflora 28:75–80. 10.12938/bifidus.28.75 [DOI] [Google Scholar]
- 11.Tannock GW, Taylor C, Lawley B, Loach D, Gould M, Dunn AC, McLellan AD, Black MA, McNoe L, Dekker J, Gopal P, Collett MA. 2014. Altered transcription of murine genes induced in the small bowel by administration of probiotic strain Lactobacillus rhamnosus HN001. Appl. Environ. Microbiol. 80:2851–2859. 10.1128/AEM.00336-14 [DOI] [PMC free article] [PubMed] [Google Scholar]
- 12.García de la Nava J, van Hijum S, Trelles O. 2003. PreP: gene expression data pre-processing. Bioinformatics 19:2328–2329. 10.1093/bioinformatics/btg318 [DOI] [PubMed] [Google Scholar]
- 13.Van Hijum SAFT, de Jong A, Baerends RJS, Karsens HA, Kramer NE, Larsen R, den Hengst CD, Albers CJ, Kok J, Kuipers OP. 2005. A generally applicable validation scheme for the assessment of factors involved in reproducibility and quality of DNA-microarray data. BMC Genomics 6:77. 10.1186/1471-2164-6-77 [DOI] [PMC free article] [PubMed] [Google Scholar]
- 14.Long AD, Mangalam HJ, Chan BY, Tolleri L, Hatfield GW, Baldi P. 2001. Improved statistical inference from DNA microarray data using analysis of variance and a Bayesian statistical framework. Analysis of global gene expression in Escherichia coli K-12. J. Biol. Chem. 276:19937–19944. 10.1074/jbc.M010192200 [DOI] [PubMed] [Google Scholar]
- 15.Tannock GW, Ghazally S, Walter J, Loach D, Brooks H, Cook G, Surette M, Simmers C, Bremer P, Dal Bello F, Hertel C. 2005. Ecological behavior of Lactobacillus reuteri 100-23 is affected by mutation of the luxS gene. Appl. Environ. Microbiol. 71:8419–8425. 10.1128/AEM.71.12.8419-8425.2005 [DOI] [PMC free article] [PubMed] [Google Scholar]
- 16.Schreiber S, Konradt M, Groll C, Scheid P, Hanauer G, Werling H-O, Joesnhans C, Suerbaum S. 2004. The spatial orientation of Helicobacter pylori in the gastric mucus. Proc. Natl. Acad. Sci. U. S. A. 101:5024–5029. 10.1073/pnas.0308386101 [DOI] [PMC free article] [PubMed] [Google Scholar]
- 17.Sachs G, Weeks DL, Wen Y, Marcus EA, Scott DR, Melchers K. 2005. Acid acclimation by Helicobacter pylori. Physiology 20:429–438. 10.1152/physiol.00032.2005 [DOI] [PubMed] [Google Scholar]
- 18.Teusink B, van Enckevort FHJ, Francke C, Wiersma A, Wegkamp A, Smid EJ, Siezen RJ. 2005. In silico reconstruction of the metabolic pathways of Lactobacillus plantarum: comparing predictions of nutrient requirements with those from growth experiments. Appl. Environ. Microbiol. 71:7253–7262. 10.1128/AEM.71.11.7253-7262.2005 [DOI] [PMC free article] [PubMed] [Google Scholar]
- 19.Hartman AL, Lough DM, Barupal DK, Fiehn O, Fishbein O, Fishbein T, Zasloff M, Eisen JA. 2009. Human gut microbiome adopts an alternative state following small bowel transplantation. Proc. Natl. Acad. Sci. U. S. A. 106:17187–17192. 10.1073/pnas.0904847106 [DOI] [PMC free article] [PubMed] [Google Scholar]
- 20.Furet JP, Firmesse O, Gourmelon M, Bridonneau C, Tap J, Mondot S, Dore J, Corthier G. 2009. Comparative assessment of human and farm animal faecal microbiota using real-time quantitative PCR. FEMS Microbiol. Ecol. 68:351–362. 10.1111/j.1574-6941.2009.00671.x [DOI] [PubMed] [Google Scholar]
- 21.McConnell EL, Basit AW, Murdan S. 2008. Measurement of rat and mouse gastrointestinal pH, fluid and lymphoid tissue, and implications for in-vivo experiments. J. Pharm. Pharmacol. 60:63–70. 10.1211/jpp.60.1.0008 [DOI] [PubMed] [Google Scholar]
- 22.Walter J, Loach DM, Alqumber M, Rockel C, Hermann C, Pfitzenmaier M, Tannock GW. 2007. d-Alanyl ester depletion of teichoic acids in Lactobacillus reuteri 100-23 results in impaired colonization of the mouse gastrointestinal tract. Environ. Microbiol. 9:1750–1760. 10.1111/j.1462-2920.2007.01292.x [DOI] [PubMed] [Google Scholar]
- 23.Su MS, Schlicht S, Ganzle MG. 2011. Contribution of glutamate decarboxylase in Lactobacillus reuteri to acid resistance and persistence in sourdough fermentation. Microb. Cell Fact. 10(Suppl 1):S8. 10.1186/1475-2859-10-S1-S8 [DOI] [PMC free article] [PubMed] [Google Scholar]
- 24.Teixeira JS, Seeras A, Sanchez-Maldonado AF, Zhang C, Su MS, Ganzle MG. 2014. Glutamine, glutamate, and arginine-based acid resistance in Lactobacillus reuteri. Food Microbiol. 42:172–180. 10.1016/j.fm.2014.03.015 [DOI] [PubMed] [Google Scholar]
- 25.Schwab C, Tvelt AT, Schleper C, Urich T. 2014. Gene expression of lactobacilli in murine forestomach biofilms. Microb. Biotechnol. 7:347–359. 10.1111/1751-7915.12126 [DOI] [PMC free article] [PubMed] [Google Scholar]
- 26.Brooker BE, Fuller R. 1975. Adhesion of lactobacilli to the chicken crop epithelium. J. Ultrastruct. Res. 52:21–31. 10.1016/S0022-5320(75)80019-0 [DOI] [PubMed] [Google Scholar]
- 27.Fuller R. 1977. The importance of lactobacilli in maintaining normal microbial balance in the crop. Br. Poult. Sci. 18:85–94. 10.1080/00071667708416332 [DOI] [PubMed] [Google Scholar]
- 28.Livingston M, Loach D, Wilson M, Tannock GW, Baird M. 2010. Gut commensal Lactobacillus reuteri 100-23 stimulates an immunoregulatory response. Immunol. Cell Biol. 88:99–102. 10.1038/icb.2009.71 [DOI] [PubMed] [Google Scholar]
- 29.Heimesaat MM, Fischer A, Siegmund B, Kupz A, Niebergall J, Fuchs D, Jahn HK, Freudenberg M, Loddenkemper C, Batra A, Lehr HA, Liesenfeld O, Blaut M, Gobel UB, Schumann RR, Bereswill S. 2007. Shift towards pro-inflammatory intestinal bacteria aggravates acute murine colitis via Toll-like receptors 2 and 4. PLoS One 2:e662. 10.1371/journal.pone.0000662 [DOI] [PMC free article] [PubMed] [Google Scholar]
- 30.Stewart GS, Smith CP. 2005. Urea nitrogen salvage mechanisms and their relevance to ruminants, non-ruminants and man. Nutr. Res. Rev. 18:49–62. 10.1079/NRR200498 [DOI] [PubMed] [Google Scholar]
- 31.Reynolds CK, Kristensen NB. 2008. Nitrogen recycling through the gut and the nitrogen economy of ruminants: an asynchronous symbiosis. J. Anim. Sci. 86:E293–E305. 10.2527/jas.2007-0475 [DOI] [PubMed] [Google Scholar]
- 32.John A-M, Bell JM. 1976. Amino acid requirements of the growing mouse. J. Nutr. 106:1361–1367 [DOI] [PubMed] [Google Scholar]
Associated Data
This section collects any data citations, data availability statements, or supplementary materials included in this article.