

ABSTRACT
Changes in protein function and other biological properties, such as RNA structure, are crucial for adaptation of organisms to novel or inhibitory environments. To investigate how mutations that do not alter amino acid sequence may be positively selected, we performed a thermal adaptation experiment using the single-stranded RNA bacteriophage Qβ in which the culture temperature was increased from 37.2°C to 41.2°C and finally to an inhibitory temperature of 43.6°C in a stepwise manner in three independent lines. Whole-genome analysis revealed 31 mutations, including 14 mutations that did not result in amino acid sequence alterations, in this thermal adaptation. Eight of the 31 mutations were observed in all three lines. Reconstruction and fitness analyses of Qβ strains containing only mutations observed in all three lines indicated that five mutations that did not result in amino acid sequence changes but increased the amplification ratio appeared in the course of adaptation to growth at 41.2°C. Moreover, these mutations provided a suitable genetic background for subsequent mutations, altering the fitness contribution from deleterious to beneficial. These results clearly showed that mutations that do not alter the amino acid sequence play important roles in adaptation of this single-stranded RNA virus to elevated temperature.
IMPORTANCE Recent studies using whole-genome analysis technology suggested the importance of mutations that do not alter the amino acid sequence for adaptation of organisms to novel environmental conditions. It is necessary to investigate how these mutations may be positively selected and to determine to what degree such mutations that do not alter amino acid sequences contribute to adaptive evolution. Here, we report the roles of these silent mutations in thermal adaptation of RNA bacteriophage Qβ based on experimental evolution during which Qβ showed adaptation to growth at an inhibitory temperature. Intriguingly, four synonymous mutations and one mutation in the untranslated region that spread widely in the Qβ population during the adaptation process at moderately high temperature provided a suitable genetic background to alter the fitness contribution of subsequent mutations from deleterious to beneficial at a higher temperature.
INTRODUCTION
Molecular evolution has been investigated by comparing the whole-genome sequences of living organisms or monitoring adaptation processes in experimental evolution. Recently, whole-genome analysis has been performed for experimental evolution using DNA and RNA viruses, Escherichia coli, Methylobacterium extorquens, Saccharomyces cerevisiae, and Drosophila melanogaster (1–16). One of the most striking findings of these evolution experiments is that “silent” mutations that do not alter amino acid sequences (synonymous mutations, cis-regulatory regions, or mutations in noncoding regions) can be fixed into populations.
The propagation processes of synonymous mutations have been investigated extensively by experimental evolution of single-stranded DNA (ssDNA) and single-stranded RNA (ssRNA) viruses, in which synonymous mutations and mutations in intergenic regions were fixed with nonsynonymous mutations during adaptation to elevated temperature (1, 4, 17), in long-term cultivation under a benign condition (3), and in coevolution with E. coli (5). Some of these synonymous mutations may be positively selected because of concurrent fitness increases in organisms, while others may be fixed by genetic drift or the selective sweeps associated with genetic hitchhiking. Further experimental investigations are required to determine the degree to which synonymous mutations contribute to adaptive evolution relative to nonsynonymous mutations.
There have been reports that synonymous mutations affect mRNA stability and protein expression levels, thus resulting in phenotypic changes (18–20). Preferred codon usage is correlated with the abundance of isoaccepting tRNAs, and the extent of this correlation is related to the level of protein production (21, 22). Redundancy in the genetic code allows preservation of mRNA folding as the degeneracy of the genetic code is used to optimize base pairing in mRNA molecules (23). Synonymous positions are important for mRNA folding and stability (18), and the mRNA folding free energy of one-third of mRNA 5′ sequences was shown to be related to the protein expression level (19). Moreover, synonymous mutations were shown to result in fitness differences in poliovirus (20), and the impact of mutations in cis-regulatory sequences on the fitness improvements of ϕX174 that was selected at high temperature has also been reported (24).
The ssRNA bacteriophage Qβ is a suitable model system in which to investigate the importance of synonymous mutations relative to nonsynonymous mutations on adaptive evolution. In addition to the four proteins covering 95.5% of the whole genome, the secondary and tertiary structures of the Qβ RNA genome are essential for its amplification (25–27). The genome is 4,217 bases in length (25) and has a high error rate of 10−3 to 10−5 per base per replication (28–30), thus facilitating genome-level experimental evolution.
Here, we report that in thermal adaptation of Qβ, mutations that did not alter the amino acid sequence contributed to increases in fitness of the phage. Temperature is one of the environmental factors that affect the fitness of living organisms (31). In addition, experimental evolution with thermal selection pressure is suitable for analyzing the process of adaptation because temperature can be precisely controlled in the laboratory. Adaptation to growth at 41.2°C was achieved by synonymous mutations or mutation in the untranslated region (UTR). Moreover, these mutations provided a genetic background for subsequent mutations to alter the fitness contribution from deleterious to beneficial.
MATERIALS AND METHODS
Strains and culture conditions.
E. coli 43BF′, the host strain used for Qβ evolution, was constructed by conjugation with a thermally adapted derivative of the DH1 strain, 43B (10), and HB2151 (32) according to a method reported previously (5). The E. coli A/λ strain (33) was used as the host strain for the titer assay. The Qβ obtained from the Qβ genome cDNA reported previously (34) was used as the ancestor phage [Anc(P1)]. Modified-M63 (mM63) medium (35) with 1 mM l-Leu and 2.3 mM MgSO4·7H2O (total, 2.5 mM MgSO4·7H2O) was used in this study. Thermal adaptation evolution experiments with Qβ were carried out using a reciprocal shaker within incubators (Eyela-FMC-1000 [Tokyo Rikakikai Co., Ltd., Tokyo, Japan], BNL-110 [ESPEC Corp., Osaka, Japan], and MIR-154 [Panasonic Corp., Osaka, Japan]). Thermal adaptation evolution experiments with Qβ were carried out at 37.2°C ± 0.1°C, 41.2°C ± 0.2°C, 43.3°C ± 0.2°C, and 43.6°C ± 0.3°C. Serial passages of Qβ consisted of infection of a host culture, followed by approximately 5 h of phage growth and extraction of the phage from the three cultures. The culture temperature was elevated when the amplification ratio at each temperature seemed to have equilibrated after an initial decrease or increase. However, the passage numbers at each temperature after equilibration was reached were arbitrary. Each serial passage was performed as follows: uninfected log phase 43BF′ cell cultures grown at each temperature at 160 rpm were transferred into new medium with dilution to an optical density at 600 nm (OD600) of 0.05 and cultured for a few hours at each temperature. When the OD600 reached 0.23 to 0.40 (approximately 1 × 10⁸ to 2 × 10⁸ CFU/ml), cells were infected with phage to approximately 1 × 10⁶ to 2 × 10⁷ PFU/ml from the previous passage. The cultures were grown for approximately 5 h and divided into two portions; one was used for separation of free phages with 0.2-μm-pore-size syringe filters (Minisart RC15; Sartorius Stedim Biotech, Göttingen, Germany), and the other was used for OD600 analysis. Free-phage solution was subjected to a titer assay and stored at 4°C. Free-phage solution stored at 4°C was used for infection in the next serial passage. To prevent adsorption of Qβ to the tube wall, 0.1% bovine serum albumin (BSA)-coated 15-ml polypropylene centrifuge tubes were used (34). The titer assay was conducted according to a standard method (36) using LB agar and LB soft agar medium. We calculated the replication generations (g) of the Qβ genome as the cumulative generations of each passage, (N5/N0) = 2g, where N5 and N0 represent 5-h postinfection and initial (0 h) free-phage density of each passage in PFU (PFU/ml), respectively, and g represents replication generation.
Phenotype analysis.
The thermal characteristics of the evolved Qβ populations and Qβ mutants with consensus mutations were determined using the amplification ratio of PFU between 0 and 5 h after infection. Strain 43BF′ was cultured at 30.6°C ± 0.5°C, 37.2°C ± 0.1°C, 40.7°C ± 0.3°C, and 43.6°C ± 0.3°C at 160 rpm and infected with approximately 4 × 10⁵ to 5 × 10⁷ PFU of Qβ. The free phage was obtained using 0.2-μm-pore-size syringe filters (Minisart RC15; Sartorius), and the amplification ratio was calculated as x = N5/N0, where N5 and N0 represent 5-h postinfection and initial (0 h) free-phage density in PFU (PFU/ml), respectively. For each assay temperature and each line, Anc(P1) was included as a control.
Genome sequencing of Qβ.
The RNA genomes of the Qβ populations derived from approximately 7 × 10⁷ to 3 × 10¹⁰ PFU particles of Anc(P1), 37_1 (where the numbers before and after the underscore represent the passage temperature and passage line, respectively), 41_1, 44_1, 37_2, 41_2, 44_2, 37_3, 41_3, 44_3 1mut (with one mutated residue), 3mut, 5mut, and 8mut were extracted using a QIAamp Viral RNA minikit (Qiagen, Hilden, Germany) according to the manufacturer's instructions. To analyze the full-length RNA genome sequence, samples were prepared according to a method described previously (5). When a double peak appeared in the sequencing chart, positions where the height of the smaller peak was over half that of the larger peak were defined as polymorphic sites.
Construction of mutant Qβ from cDNA of genomes with mutations.
Mutant Qβ phages were constructed from cDNA of Qβ genomes with mutations. First, we introduced G569A into pACYCQβ (37), because G569A was observed in Anc(P1), even though the nucleotide at position 569 in the Qβ cDNA in pACYCQβ was G. The resulting plasmid was designated pACYCQβ_G569A. Each consensus mutation detected in all three populations was introduced into the cDNA genome of pACYCQβ_G569A using an In-Fusion cloning system (TaKaRa Bio, Inc., Shiga, Japan) and standard cloning methods (38). We constructed four types of cDNA: pACYCQβ_1mut with one mutation (C2249T), pACYCQβ_5mut with five mutations (G4A, T192C, C1257T, C2201T, and C2249T), pACYCQβ_8mut with eight mutations (G4A, T192C, A1088G, C1257T, C2201T, C2249T, A2748C, and T2776C), and pACYCQβ_3mut with three mutations (A1088G, A2748C, and T2776C).
Qβ mutants were obtained from these cDNAs as follows. DH5α/pACYCQβ_1mut, -3mut, -5mut, and -8mut were each cultured in two 500-ml culture flasks in 200 ml of LB medium with 50 μg/ml kanamycin at 30°C at 122 to 127 rpm for 16 to 17.5 h. After centrifugation at 5,000 × g at 4°C for 20 min, the supernatants were filtered with 1.2-μm-pore-size syringe filters (Minisart; Sartorius) and with 0.2-μm-pore-size syringe filters (Steradisc 25; Kurabo Industries, Ltd., Osaka, Japan). The filtered supernatants were concentrated with Amicon Ultra-15 centrifugal filter units with 50,000-nominal-molecular-weight-limit membranes (EMD Millipore, Billerica, MA). The concentrated supernatants including phage particles were dialyzed with P buffer (50 mM Tris-HCl, pH 7.6, 0.1 M NaCl, 5 mM MgCl2, and 0.1 mM EDTA·2Na) (37) using Slide-A-Lyzer gamma-irradiated dialysis cassettes with 10,000-nominal-molecular-weight-limit membranes (Thermo Fisher Scientific, Waltham, MA) and then concentrated with Amicon Ultra-0.5 or Amicon Ultra-4 centrifugal filter units with 50,000-nominal-molecular-weight-limit membranes (EMD Millipore). The concentrated phage particles were filtered using 0.2-μm-pore-size syringe filters (Minisart RC15 filters; Sartorius) and stored in 40% glycerol at −20°C. These mutant phages were confirmed to have the desired mutations by genome sequencing as described in the paragraph “Genome sequencing of Qβ”above.
Secondary structure prediction.
The secondary structures of the Anc(P1), 1mut, 3mut, 5mut, and 8mut Qβ genomes were predicted with mfold (39) using full-length genome sequences with maximum distance between paired bases set as either no limit or 100 bases.
Statistical analysis.
Amplification ratios were compared by two-tailed t test and one-way analysis of variance (ANOVA) with a Tukey post hoc test or a Tukey-Kramer post hoc test (40). In all analyses, a P value of <0.01 was taken to indicate statistical significance.
Nucleotide sequence accession number.
The sequence of Anc(P1) is available from the DDBJ under accession number AB971354.
RESULTS
Experimental evolution system.
We carried out thermal adaptation experiments with three independent Qβ lines, and the Qβ acquired the capabilities of growing at the inhibitory temperature over 62 days of serial daily passage (Fig. 1). Thermal adaptive evolution started from an initial temperature of 37.2°C and was raised to 41.2°C, 43.3°C, and to the inhibitory temperature of 43.6°C in a stepwise manner. We constructed an E. coli strain (43BF′) by conjugation with strain 43B, which was obtained previously by thermal adaptation experimental evolution (10), and the HB2151 strain (32). The specific growth rates of E. coli strain 43BF′ at 37.2°C, 41.2°C, and 43.6°C were 0.59, 0.59, and 0.53 h−1, respectively. Serial daily passage was conducted as follows. Free Qβ was separated from the previous day's culture, diluted, and used to infect fresh E. coli strain 43BF′ at logarithmic growth phase. Diluted Qβ was added to an initial Qβ density of approximately 1 × 10⁶ to 2 × 10⁷ PFU/ml, which was equivalent to an effective population size (Ne) of approximately 2.5 × 10⁶ to 5 × 10⁷ PFU, determined by multiplying the free-phage density immediately after infection by the culture volume of 2.5 ml. The ancestral phage population [Anc(P1)] was divided into three and passaged as follows (replication generations are given in respective order for lines 1, 2, and 3): for 8 days at 37.2°C, equivalent to 121, 117, and 117 replication generations; for 20 days at 41.2°C, equivalent to 233, 239, and 232 replication generations; for 6 days at 43.3°C, equivalent to 40, 40, and 41 replication generations; and for 28 days at 43.6°C, equivalent to 228, 243, and 236 replication generations (Fig. 1). The replication generation number of the phage population (g) was calculated as described in the Materials and Methods section. Qβ evolved gradually to adapt to the increasing temperature (Fig. 1). Significant increases in the amplification ratio were observed in the 41.2°C adaptation (approximately 22-fold) and the 43.6°C adaptation (approximately 110-fold).
FIG 1.

Population dynamics of three independent Qβ lines in thermal adaptation. Population dynamics of free Qβ density (PFU/ml) of line 1, line 2, and line 3 are shown. The free Qβ densities (PFU/ml) immediately after (open symbols) and 5 h after (filled symbols) infection were measured every day as described in the Materials and Methods section. Data for the density immediately after infection on day 7 in line 3 are lacking because of a technical error in the titer assay. d, days.
Fitness analysis of the thermally adapted Qβ population.
Fitness analysis showed that thermally adapted Qβ populations gained the ability to grow at high temperatures at which the ancestor strain could not grow (Fig. 2). We analyzed the fitness of Qβ at 30.6°C, 37.2°C, 40.7°C, and 43.6°C by measuring the amplification ratio 5 h after infection to estimate the growth ability under the same conditions as used in the evolution experiment. The amplification ratio was calculated as described in the Materials and Methods section. The endpoint Qβ populations at each temperature were designated 37_1, 37_2, 37_3, 41_1, 41_2, 41_3, 44_1, 44_2, and 44_3, with the numbers before and after the underscore representing the passage temperature and passage line, respectively. In the 37.2°C assay, the amplification ratio of Anc(P1) and populations adapted to each temperature were almost the same (Fig. 2). In the 40.7°C and 43.6°C assays, the amplification ratios of thermally adapted populations increased with increasing adaptation temperature (Fig. 2). In the 43.6°C assay, Anc(P1) and 37.2°C- and 41.2°C-adapted populations showed decreased amplification ratios, but the reduction was recovered with increasing adaptation temperature. The amplification ratios of 43.6°C-adapted populations were approximately (1 × 10⁵)- to (7 × 10⁵)-fold compared with Anc(P1), and the amplification ratios of 44_1, 44_2, and 44_3 were significantly larger than those of the other populations in each line (line 1, one-way ANOVA, F3,8 = 810, P < 0.001; line 1, post hoc Tukey's test, P < 0.001; line 2, one-way ANOVA, F3,14 = 33, P < 0.001; line 2, post hoc Tukey-Kramer test, P < 0.001; line 3, one-way ANOVA F3,20 = 21, P < 0.001; line 3, post hoc Tukey's test, P < 0.001). These results indicated that the populations evolved adaptively by compensating for the inhibitory effect of the increasing temperature.
FIG 2.
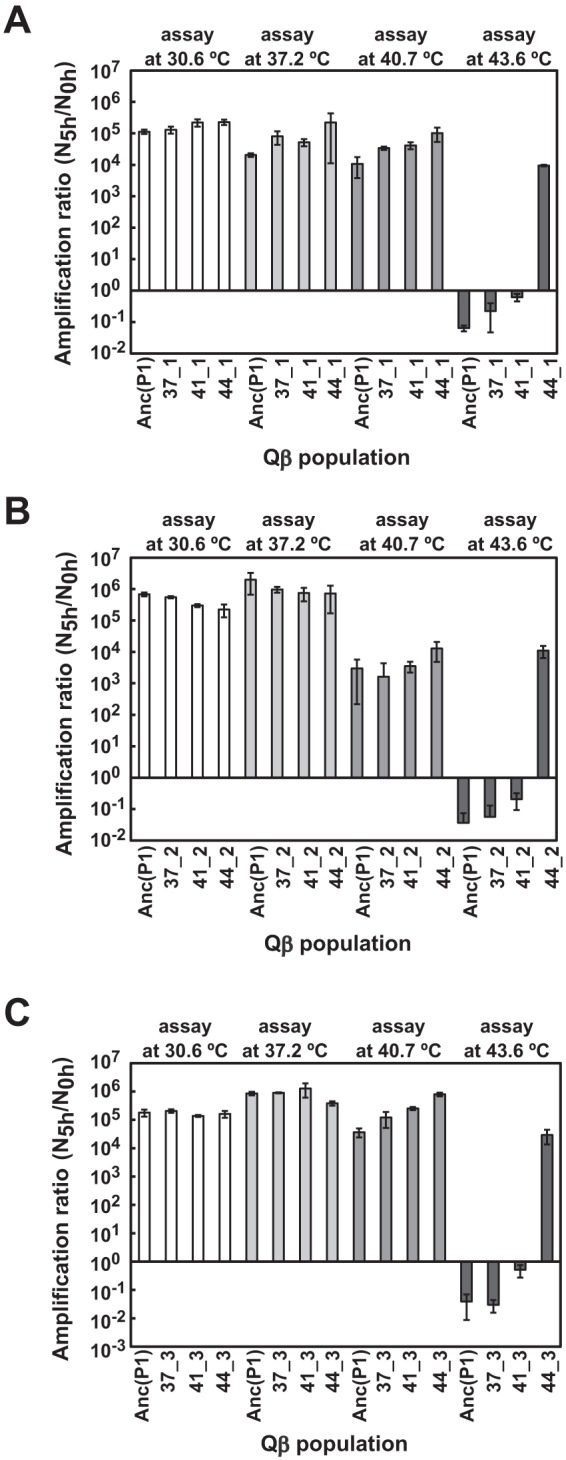
Fitness of Anc(P1) and evolved populations of each Qβ line. The amplification ratios were measured at 30.6°C, 37.2°C, 40.7°C, and 43.6°C for Anc(P1) and endpoint 37.2°C-, 41.2°C-, and 43.6°C-adapted Qβ populations, as indicated. (A) Amplification ratios of Anc(P1) and the line 1 Qβ population. (B) Amplification ratios of Anc(P1) and the line 2 Qβ population. (C) Amplification ratios of Anc(P1) and the line 3 Qβ population. The amplification ratio was calculated as described in the Materials and Methods section. For each assay temperature and each line, Anc(P1) was included as a control, and at each assay temperature, all populations of each line were measured on the same day. Data are expressed as average values ± standard deviations (n = 3 to 9).
Thermally adapted Qβ populations showed a broadened permissive temperature range for growth but were not associated with a decrease of growth ability at lower temperatures (Fig. 2). We measured the amplification ratio at 30.6°C to determine whether the increase in growth ability at 43.6°C was associated with a decrease in growth ability at lower temperature. No decreases in amplification ratio at 30.6°C were observed (Fig. 2). These observations indicated that an increasing growth ability at higher temperature was not necessarily associated with decreased amplification at lower temperatures.
Molecular evolution of thermally adapted Qβ.
We analyzed the whole-genome sequence of Anc(P1) and the endpoint Qβ populations at each temperature. Many identical mutations were detected in two or three lines (Fig. 3 and Table 1). Point mutations and single-nucleotide insertions were found throughout the thermal adaptation (Table 1). We observed mutations at a total of 31 sites; eight of these mutations were identical in three lines, and two mutations were identical in two lines. The sequence at position 2249 of Anc(P1) was polymorphic for C and U although Anc(P1) was derived from cDNA of Qβ (34). This site was changed to U in the 37.2°C adaptation (Table 1). In addition, another four mutations at positions 4, 192, 1257, and 2201 and three mutations at positions 1088, 2748, and 2776 were detected in three lines with adaptation to 41.2°C and 43.6°C, respectively (Fig. 3 and Table 1). With adaptation to 43.6°C, one mutation at position 153 in 44_1 and 44_2 and one mutation at position 1371 in 44_1 and 44_3 were detected (Fig. 3 and Table 1).
FIG 3.

Mutation positions of the evolved population of each Qβ line. Marked positions are where differences between the sequence of Anc(P1) and that of each Qβ population were observed. Positions of mutations in lines 1, 2, and 3 are indicated on the graph. Solid and dotted lines represent monomorphic and polymorphic sites, respectively. The positions of single-nucleotide insertions are indicated by +1. Vertical lines above the black horizontal lines represent synonymous mutations or mutations in the UTR, and vertical lines below the black horizontal line represent nonsynonymous mutations. The numbers above and below the vertical lines represent the mutation positions, and numbers in parentheses represent the mutations of 1mut, 3mut, 5mut, and 8mut. The mutational sites are as follows: 1mut, C2249; 3mut, A1088G, A2748C, and U2776C; 5mut, G4A, U192C, C1257U, C2201U, and C2249U; 8mut, G4A, U192C, A1088G, C1257U, C2201U, C2249U, A2748C, and U2776C. The four genes, S site, and M site are represented in the lowest part, with numbers representing the start and end positions.
TABLE 1.
Nucleotide sequences of the ancestral and evolved phage genomes
| Sequence identity in the indicated phage populationa |
Gene and/or site | Genome positionb | Nucleotide in: |
Gene positionc | Codon change | Amino acid change | ||||||||||||
|---|---|---|---|---|---|---|---|---|---|---|---|---|---|---|---|---|---|---|
| GenBank AY099114 | Anc(P1) | 37_1 | 37_2 | 37_3 | 41_1 | 41_2 | 41_3 | 44_1 | 44_2 | 44_3 | cDNA | Anc(P1) | Evolved population | |||||
| ± | + | + | + | + | + | + | UTR | 4 | G | G | A | |||||||
| + | UTR | 11 | U | U | C | |||||||||||||
| + | UTR | 14 | A + 1 insertion | |||||||||||||||
| + | UTR | 15 | G + 1 insertion | |||||||||||||||
| ± | UTR | 47 | G | G | A | |||||||||||||
| + | ± | A2 | 153 | A | A | C | 93 (31) | GAA → GAC | Glu → Asp | |||||||||
| ± | + | + | + | + | + | A2 | 192 | U | U | C | 132 (44) | CGU → CGC | ||||||
| A2 | 569 | G | A | A | 509 (170) | GGG → GAG | Gly → Glu | |||||||||||
| + | A2 | 905 | A | A | G | 845 (282) | GAA → GGA | Glu → Gly | ||||||||||
| + | A2 | 918 | U | U | C | 858 (286) | GUU → GUC | |||||||||||
| + | + | + | A2 | 1088 | A | A | G | 1028 (343) | GAU → GGU | Asp → Gly | ||||||||
| + | + | + | + | + | + | + | A2/S site | 1257 | C | C | U | 1197 (399) | ACC → ACU | |||||
| + | + | A2/S site | 1263 | U | U | C | 1203 (401) | UUU → UUC | ||||||||||
| + | A2/S site | 1281 | U | U | C | 1221 (407) | GUU → GUC | |||||||||||
| + | A2/S site | 1312 | G | G | A | 1252 (418) | GUA → AUA | Val → Ile | ||||||||||
| + | UTR/S site | 1338 | U | U | C | |||||||||||||
| + | + | Coat/A1 | 1371 | G | G | A | 28 (10) | GGU → AGU | Gly → Ser | |||||||||
| + | Coat/A1 | 1400 | U | U | C | 57 (19) | ACU → ACC | |||||||||||
| + | Coat/A1 | 1541 | G | G | U | 198 (66) | CAG → CAU | Gln → His | ||||||||||
| + | ± | ± | + | + | + | A1 | 2201 | C | C | U | 858 (286) | GCC → GCU | ||||||
| ± | A1 | 2223 | G | G | A | 880 (294) | GTT → AUU | Val → Ile | ||||||||||
| + | ± | + | + | + | + | + | + | + | + | + | A1 | 2249 | C | C/U | U | 906 (302) | AGC → AGU | |
| + | β subunit | 2452 | C | C | U | 101 (34) | GCC → GUC | Ala → Val | ||||||||||
| + | + | + | β Subunit/M site | 2748 | A | A | C | 397 (133) | AGA → CGA | |||||||||
| + | + | + | β Subunit/M site | 2776 | U | U | C | 425 (142) | GUU → GCU | Val → Ala | ||||||||
| + | β Subunit | 2972 | U | U | C | 621 (207) | AAU → AAC | |||||||||||
| + | β Subunit | 3011 | U | U | C | 660 (220) | CGU → CGC | |||||||||||
| ± | β Subunit | 3230 | A | A | G | 879 (293) | CCA → CCG | |||||||||||
| + | β subunit | 3311 | U | U | C | 960 (320) | AUU → AUC | |||||||||||
| + | β Subunit | 3402 | U | U | C | 1051 (351) | UCG → CCG | Ser → Pro | ||||||||||
| + | β Subunit | 3784 | U | U | C | 1433 (478) | AUC → ACC | Ile → Thr | ||||||||||
| + | β Subunit | 3931 | U | U | C | 1580 (527) | CUU → CCU | Leu → Pro | ||||||||||
| ± | β Subunit | 3945 | G | G | A | 1594 (532) | GGU → AGU | Gly → Ser | ||||||||||
| + | β Subunit | 4004 | G | G | A | 1653 (551) | ACG → ACA | |||||||||||
Sequence identities are indicated as follows: blank, the same sequence as Anc(P1); ±, heterogeneity between Anc(P1) and the evolved sequence; +, monomorphic site of evolved sequence.
Genome positions were counted from G of the 5[prime] terminus of the Qβ genome as position 1.
Gene position was counted from the A of the start codon (AUG) of each gene as position 1. The numbers in parentheses represent the amino acid positions of each protein. Position 2249 of Anc(P1) was heterogeneous with C and U although the Anc(P1) Qβ population was derived from cloned cDNA (sequence of the cDNA is shown in the “Nucleotide” column).
Intriguingly, 14 of the 31 mutational sites observed here did not alter the amino acid sequence although the population must have fixed adaptive mutations to increase its fitness. In particular, the five identical mutations that were observed by adaptation to 41.2°C were all synonymous or in the UTR. It should be noted that genetic drift is less likely to fix synonymous mutations in our experimental evolution setting as the total generation number of approximately 630 was much smaller than the effective population size (Ne) of 2.5 × 10⁶ to 5 × 10⁷ PFU, which was calculated by multiplying the free-phage density immediately after infection by the culture volume of 2.5 ml. The fixation of neutral mutations is known to require generations approximately as long as the Ne (41). For the mutations observed in all three lines, it was more likely that they spread widely in three populations as a result of selection because they were observed in three lines. For the mutations observed in each line, we calculated the selection coefficient of a mutant with a mutation using the following formula: t · s = log2(pt/qt) − log2(p0/q0), where t, s, pt, qt, p0, and q0 represent the replication generation number, selection coefficient, frequency of the mutant at generation t, frequency of the phage without the mutation at generation t, initial frequency of a mutant, and initial frequency of phage without the mutation, respectively. We calculated s at the case where a mutant with initial frequency of 1/107 increased to a frequency of 1/3 in at most 240 generations (e.g., 43.6°C) because we defined as polymorphic those sites in the sequencing chart where a double peak appeared such that the height of the smaller peak was over half that of the larger peak. The s value would be at least 0.09, and this value was significantly larger than the inverse of Ne (∼1/107). For a mutation to be controlled mainly by random drift, the selection coefficient of the mutation must be much smaller than the inverse of Ne (41). Therefore, most, if not all, of these synonymous mutations seemed to be positively selected to increase the fitness of the population.
Fitness analysis of the Qβ strains with identical mutations.
We constructed three mutants—1mut observed at the 37.2°C endpoint, 5mut at the 41.2°C endpoint, and 8mut at the 43.6°C endpoint—along with a mutant phage, 3mut, with only the three mutations that appeared in the adaptation to 43.6°C. These cDNAs with mutations were constructed in the order shown in Fig. 4. In the 40.7°C assay, 5mut showed a significant increase in the amplification ratio of approximately 1 order of magnitude compared to 1mut or Anc(P1) (one-way ANOVA, F2,26 = 8.33, P < 0.005; post hoc Tukey-Kramer test, P < 0.01) (Fig. 5). This approximately 1 order of magnitude increase in amplification ratio of 5mut compared with Anc(C) at 40.7°C was comparable to the evolutionary increase in the amplification ratio for the three lines from the beginning to the endpoint of 41.2°C (Fig. 1 and Fig. 5), suggesting that these five mutations explain the fitness increase in the evolution from Anc(P1) to 41.2°C. These results suggest that, indeed, all or some of these mutations were positively selected even without any changes in the amino acid sequence.
FIG 4.
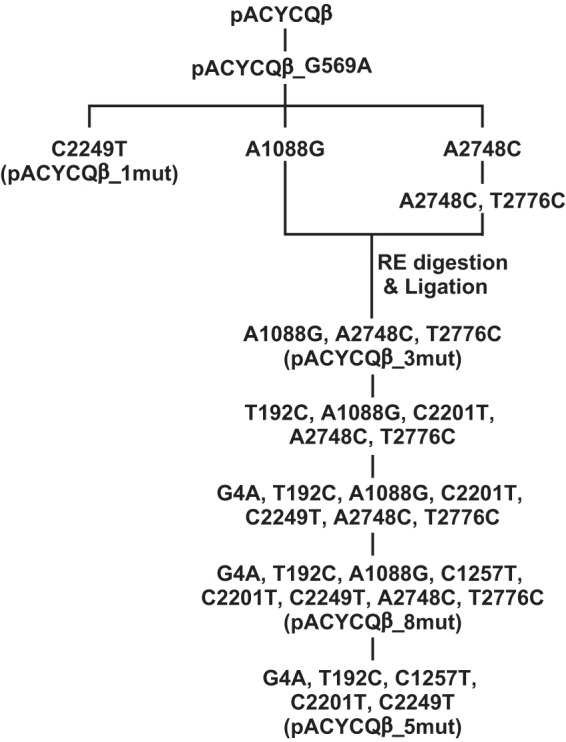
Steps for reconstructing cDNA of Qβ genomes with commonly observed mutations. We constructed cDNAs with the consensus sequence by using an In-Fusion cloning system (TaKaRa Bio, Inc., Shiga, Japan) and standard cloning methods in a step-by-step manner. All steps were performed using the In-Fusion cloning system except for the step “RE digestion & Ligation,” where we used restriction enzymes and T4 ligase. First, we introduced G569A into pACYCQβ because G569A was observed in Anc(P1), even though the nucleotide at position 569 in the Qβ cDNA in pACYCQβ was G. The resulting plasmid, pACYCQβ_G569A, was used as the starting template for site-directed mutagenesis.
FIG 5.
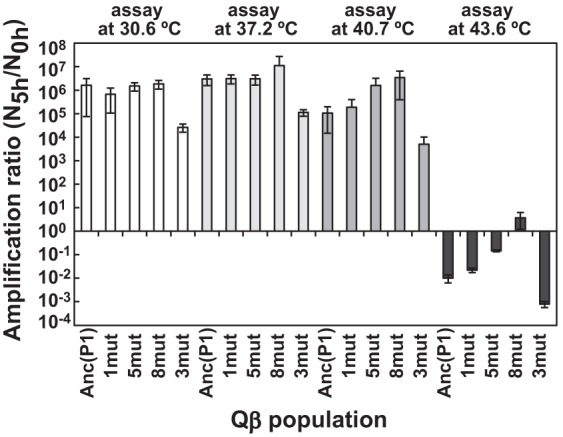
Fitness of mutant Qβ strains with consensus sequence. The amplification ratios of Anc(P1) and mutant Qβs, 1mut, 5mut, 8mut, and 3mut at 30.6°C, 37.2°C, 40.7°C, and 43.6°C, as indicated, are shown. The amplification ratio was calculated as described in the Materials and Methods section. For each assay temperature, Anc(P1) was included as a control, and at each assay temperature, all populations were measured on the same day. Data are expressed as average values ± standard deviations (n = 3 to 9).
It should be noted that at all temperatures assayed, the three mutations appearing in the last adaptation to 43.6°C, which alone were deleterious, led to significant fitness increases together with the five mutations in the previous adaptation to 41.2°C (Fig. 5). As expected, the order of the amplification ratio was 8mut > 5mut > 1mut > Anc(P1) at 43.6°C, indicating that the three mutations were beneficial in adaptation to 43.6°C. However, 3mut showed lower fitness than the other mutants or Anc(P1) [Anc(P1) versus 3mut, 37.2°C, t2,7 = 3.35, P < 0.05; 40.7°C, t2,19 = 3.30, P < 0.01; 43.6°C, t2,7 = 41.57, P < 0.001). That is, the five mutations with no amino acid sequence changes may have provided a suitable genetic background that altered the fitness contributions for the three subsequent mutations from deleterious to beneficial. The amplification ratio of 8mut was approximately 1,000-fold lower than that of the 43.6°C-adapted population, indicating that other mutations that appeared in the three lines also contributed to the adaptation to growth at 43.6°C.
DISCUSSION
In our thermal adaptation experiments with the ssRNA bacteriophage Qβ, the Qβ populations accumulated mutations in their genomes and could grow at the inhibitory temperature of 43.6°C, a temperature at which the ancestral strain could not grow. The results of whole-genome analysis indicated that four synonymous mutations and one mutation in the UTR played at least two roles in this adaptation. First, adaptation to 41.2°C can be achieved by these mutations. Second, these mutations provided a suitable genetic background to change the fitness contribution of subsequent mutations from deleterious to beneficial. While our approach restricted us to observing only segregation mutations at high frequency and fixed mutations, this was appropriate as our interest was only in beneficial mutations and not neutral or deleterious mutations.
In the course of adaptation to growth at 37.2°C, the adaptation of Qβ to the thermally adapted E. coli host, 43BF′, may have included not only adaptation of Qβ to this temperature because Qβ derived from cDNA did not grow on 43BF′ before. Therefore, Qβ could take different pathways for adaptation before selection at warmer temperatures. However, only little differences were observed in the whole-genome sequences of the three 37.2°C-adapted populations, indicating that there would not be marked differences among the three populations before adaptation to warmer temperatures. At 43.6°C, the amplification ratio of Anc(P1) was ∼0.01, indicating that the density of free Qβ that had plaque-forming ability decreased within 5 h after infection at 43.6°C. However, Anc(P1) retained plaque-forming ability after incubation at 43.8°C in a thermal cycler for 5 h without the E. coli host (data not shown). These observations suggested that the decrease in the amplification ratio at 43.6°C was due to a mechanism other than the heat inactivation of the Qβ plaque-forming ability. Similar to a previous study by Knies et al. in which the ssDNA phage G4 adapted to high temperature did not show a decrease in fitness at lower temperature (42), the thermally adapted Qβ in this study also showed no decrease in fitness at low temperature.
There are at least two plausible explanations for the fixation of many identical mutations in three lines in this study. The first is parallel evolution, where mutations occurred independently and were fixed independently in all three lines. The second is the occurrence of cross-contamination among the three independent lines somewhere during the thermal adaptation experiment, with additional mutations fixed separately in each line. In both cases, the sequences observed at the endpoint of each temperature experiment were those that had survived under the respective conditions, and so most, if not all, of the identical mutations observed in all three lines seemed to have been positively selected to increase the fitness of the population.
Changes in RNA secondary structure by mutations may explain why even synonymous mutations can become fixed in a population. The Qβ RNA genome is a multifunctional RNA that acts as mRNA-encoding proteins, the template for genome replication, and regulatory RNA for controlling the level and timing of expression of proteins in the Qβ life cycle (25). Therefore, although synonymous mutations in the Qβ RNA genome that did not change the amino acid sequences of proteins appeared to be selected through thermal adaptation, it is possible that selection pressure acted upon other functions of the RNA genome. As RNA secondary and higher-order structures play roles in the functions other than protein coding described above, we performed secondary structure prediction using mfold (39) with the whole-genome sequences of Anc(P1), 1mut, 3mut, 5mut, and 8mut. Four of the eight mutations altered the base-pair-making pattern compared to Anc(P1) (see Table S1 in the supplemental material). Their base-pair-making or base-pair-breaking pattern changed in both cases where the maximum distance between paired bases was set to “no limit” or “100 bases” in mfold. As shown in Table S1, G4A broke a base pair, while C1257U and A2748C made a base pair under both conditions of “no limit” and “100 bases.” G4A was located on the 5′ end of the Qβ genome, and this position is thought to be important for the 3′ terminus of the minus strand to produce the plus-strand RNA genome. The base pair pattern of the complementary site for G4A changed only under conditions of the maximum distance between paired bases of 100 bases but did not change under the no-limit condition when we predicted the minus-strand secondary structure of Anc(P1) and 5mut. These observations indicated that this site on the minus strand would be flexible. The C1257U and A2748C mutations were located on the S site and M site, respectively, where Qβ replicase binds (43). Next, the base-pairing patterns of C2249U were pair breaking or pair making depending on the maximum distance between paired bases (see Table S1). The results indicated that the secondary structure around C2249U would be flexible, and this was supported by the observations that Qβ with both C and U at 2249 could grow sufficiently at 37.2°C (5). Together with the fitness results, all or some of the three mutations widespread in the Qβ population by adaptation to 41.2°C, i.e., G4A, C1257U, and C2249U, may contribute to increasing the fitness by changing the secondary structure, and the additional A2748C mutation may increase the fitness at higher temperatures. Electron microscopic analysis indicated a wide-ranging interaction between the S site and M site of the genome where Qβ replicase binds the S site and M site simultaneously and forms a loop structure (43, 44). Therefore, structural changes in both the S site and M site would contribute to the increase in fitness at 43.6°C. The changes in structure of the genome associated with adaptation were consistent with previous reports indicating the importance of Qβ genome structure in translation of Qβ proteins (25, 45), template activity for Qβ replicase (26), and access of Qβ replicase located on the M site to the 3′ end of the genome (27).
Sign epistasis in fitness analysis reflected the evolutionary path in this thermal adaptation evolution (Fig. 6). The effects of three mutations on fitness were deleterious when they were introduced into the Anc(P1) genetic background but beneficial when they were introduced into the 5mut genetic background. This sign epistasis interaction was observed in both the 40.7°C and 43.6°C assays. The epistasis of mutations has been investigated extensively to elucidate the predictability and repeatability of evolutionary adaptation (13, 15, 46–53), and sign epistasis is thought to be influential in determining which of many possible evolutionary paths are evolutionarily accessible (50). In this study, if three mutations were introduced into the genome of Anc(P1) ahead of five mutations during thermal adaptation, the mutant would not survive due to the decrease in fitness. This finding suggested that the order of mutation fixation may be important for Qβ thermal adaptation. The interactions in the Qβ genome structure described above, especially the interaction between the S site and M site, may contribute to the epistasis observed here. In adaptation to the cold temperature of ssRNA bacteriophage MS2, it was reported that sign epistasis was not observed (53, 54). In the present study, sign epistasis may have been observed due to the genetic background of 5mut, which may be adaptive in terms of RNA secondary or higher-order structure as described above. In contrast, the two genetic backgrounds to test for sign epistasis in the study of MS2 were made with two single nonsynonymous mutations. Therefore, sign epistasis, such as that driven by RNA structure observed in the present study, might not be observed in the study of MS2.
FIG 6.
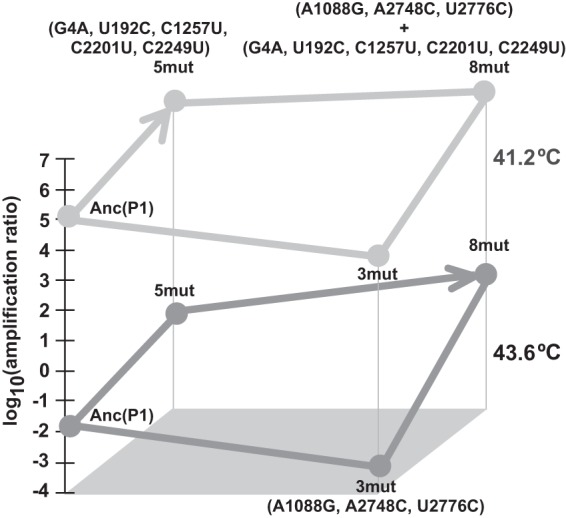
Relationship between evolutionary path and fitness. Fitness assayed at 40.7°C and 43.6°C is represented as the log10(amplification ratio) in light and dark gray points, respectively. The direction of the arrowhead represents the plausible evolutionary path in the 41.2°C and 43.6°C adaptations in this study based on the results of molecular evolution analysis, and fitness data supported the route.
This study revealed the important roles of substitutions that do not alter amino acid sequences in adaptation of ssRNA virus to inhibitory conditions. The possible effects of the interaction of distantly positioned genome sites on Qβ growth suggested that the higher-order structure of the RNA genome may be important for thermal adaptation of Qβ as well as the local secondary structure. As functional RNA and RNA conformation have been shown to have important effects on cellular processes in various organisms other than RNA viruses (55, 56), similar phenomena presumably occur when various organisms adapt to novel or inhibitory environmental conditions. Therefore, further studies regarding the importance of synonymous substitutions in adaptation are required.
Supplementary Material
ACKNOWLEDGMENTS
We thank Toshihiko Kishimoto (Toho University) for providing the E. coli strain and Kotaro Mori (Ishihara Sangyo Kaisha) for fruitful discussions. We are grateful to Takahiro Toba and members of the RNA Research Center, Hirosaki University, for their cooperation.
This work was supported in part by MEXT KAKENHI (26440194 to A.K.), Hirosaki University Grant for Exploratory Research by Young Scientists (to A.K.), Priority Research Grant for Young Scientists Designated by the President of Hirosaki University (to A.K.), and Hirosaki University Institutional Research Grant for Young Scientists (to A.K.).
Footnotes
Published ahead of print 23 July 2014
Supplemental material for this article may be found at http://dx.doi.org/10.1128/JVI.01127-14.
REFERENCES
- 1.Bull JJ, Badgett MR, Wichman HA, Huelsenbeck JP, Hillis DM, Gulati A, Ho C, Molineux IJ. 1997. Exceptional convergent evolution in a virus. Genetics 147:1497–1507 [DOI] [PMC free article] [PubMed] [Google Scholar]
- 2.Wichman HA, Badgett MR, Scott LA, Boulianne CM, Bull JJ. 1999. Different trajectories of parallel evolution during viral adaptation. Science 285:422–424. 10.1126/science.285.5426.422 [DOI] [PubMed] [Google Scholar]
- 3.Wichman HA, Millstein J, Bull JJ. 2005. Adaptive molecular evolution for 13,000 phage generations: a possible arms race. Genetics 170:19–31. 10.1534/genetics.104.034488 [DOI] [PMC free article] [PubMed] [Google Scholar]
- 4.Bollback JP, Huelsenbeck JP. 2009. Parallel genetic evolution within and between bacteriophage species of varying degrees of divergence. Genetics 181:225–234. 10.1534/genetics.107.085225 [DOI] [PMC free article] [PubMed] [Google Scholar]
- 5.Kashiwagi A, Yomo T. 2011. Ongoing phenotypic and genomic changes in experimental coevolution of RNA bacteriophage Qβ and Escherichia coli. PLoS Genet. 7:e1002188. 10.1371/journal.pgen.1002188 [DOI] [PMC free article] [PubMed] [Google Scholar]
- 6.Domingo-Calap P, Pereira-Gómez M, Sanjuán R. 2010. Selection for thermostability can lead to the emergence of mutational robustness in an RNA virus. J. Evol. Biol. 23:2453–2460. 10.1111/j.1420-9101.2010.02107.x [DOI] [PubMed] [Google Scholar]
- 7.Novella IS, Zárate S, Metzgar D, Ebendick-Corpus BE. 2004. Positive selection of synonymous mutations in vesicular stomatitis virus. J. Mol. Biol. 342:1415–1421. 10.1016/j.jmb.2004.08.003 [DOI] [PubMed] [Google Scholar]
- 8.Cuevas JM, Elena SF, Moya A. 2002. Molecular basis of adaptive convergence in experimental populations of RNA viruses. Genetics 162:533–542 [DOI] [PMC free article] [PubMed] [Google Scholar]
- 9.Herring CD, Raghunathan A, Honisch C, Patel T, Applebee MK, Joyce AR, Albert TJ, Blattner FR, van den Boom D, Cantor CR, Palsson BO. 2006. Comparative genome sequencing of Escherichia coli allows observation of bacterial evolution on a laboratory timescale. Nat. Genet. 38:1406–1412. 10.1038/ng1906 [DOI] [PubMed] [Google Scholar]
- 10.Kishimoto T, Iijima L, Tatsumi M, Ono N, Oyake A, Hashimoto T, Matsuo M, Okubo M, Suzuki S, Mori K, Kashiwagi A, Furusawa C, Ying BW, Yomo T. 2010. Transition from positive to neutral in mutation fixation along with continuing rising fitness in thermal adaptive evolution. PLoS Genet. 6:e1001164. 10.1371/journal.pgen.1001164 [DOI] [PMC free article] [PubMed] [Google Scholar]
- 11.Tenaillon O, Rodriguez-Verdugo A, Gaut RL, McDonald P, Bennett AF, Long AD, Gaut BS. 2012. The molecular diversity of adaptive convergence. Science 335:457–461. 10.1126/science.1212986 [DOI] [PubMed] [Google Scholar]
- 12.Barrick JE, Yu DS, Yoon SH, Jeong H, Oh TK, Schneider D, Lenski RE, Kim JF. 2009. Genome evolution and adaptation in a long-term experiment with Escherichia coli. Nature 461:1243–1247. 10.1038/nature08480 [DOI] [PubMed] [Google Scholar]
- 13.Chou HH, Chiu HC, Delaney NF, Segre D, Marx CJ. 2011. Diminishing returns epistasis among beneficial mutations decelerates adaptation. Science 332:1190–1192. 10.1126/science.1203799 [DOI] [PMC free article] [PubMed] [Google Scholar]
- 14.Kao KC, Sherlock G. 2008. Molecular characterization of clonal interference during adaptive evolution in asexual populations of Saccharomyces cerevisiae. Nat. Genet. 40:1499–1504. 10.1038/ng.280 [DOI] [PMC free article] [PubMed] [Google Scholar]
- 15.Kvitek DJ, Sherlock G. 2011. Reciprocal sign epistasis between frequently experimentally evolved adaptive mutations causes a rugged fitness landscape. PLoS Genet. 7:e1002056. 10.1371/journal.pgen.1002056 [DOI] [PMC free article] [PubMed] [Google Scholar]
- 16.Izutsu M, Zhou J, Sugiyama Y, Nishimura O, Aizu T, Toyoda A, Fujiyama A, Agata K, Fuse N. 2012. Genome features of “Dark-fly,” a Drosophila line reared long-term in a dark environment. PLoS One 7:e33288. 10.1371/journal.pone.0033288 [DOI] [PMC free article] [PubMed] [Google Scholar]
- 17.Holder KK, Bull JJ. 2001. Profiles of adaptation in two similar viruses. Genetics 159:1393–1404 [DOI] [PMC free article] [PubMed] [Google Scholar]
- 18.Shabalina SA, Spiridonov NA, Kashina A. 2013. Sounds of silence: synonymous nucleotides as a key to biological regulation and complexity. Nucleic Acids Res. 41:2073–2094. 10.1093/nar/gks1205 [DOI] [PMC free article] [PubMed] [Google Scholar]
- 19.Kudla G, Murray AW, Tollervey D, Plotkin JB. 2009. Coding-sequence determinants of gene expression in Escherichia coli. Science 324:255–258. 10.1126/science.1170160 [DOI] [PMC free article] [PubMed] [Google Scholar]
- 20.Lauring AS, Acevedo A, Cooper SB, Andino R. 2012. Codon usage determines the mutational robustness, evolutionary capacity, and virulence of an RNA virus. Cell Host Microbe 12:623–632. 10.1016/j.chom.2012.10.008 [DOI] [PMC free article] [PubMed] [Google Scholar]
- 21.Ikemura T. 1981. Correlation between the abundance of Escherichia coli transfer RNAs and the occurrence of the respective codons in its protein genes: a proposal for a synonymous codon choice that is optimal for the E. coli translational system. J. Mol. Biol. 151:389–409. 10.1016/0022-2836(81)90003-6 [DOI] [PubMed] [Google Scholar]
- 22.Ikemura T. 1985. Codon usage and tRNA content in unicellular and multicellular organisms. Mol. Biol. Evol. 2:13–34 [DOI] [PubMed] [Google Scholar]
- 23.Fitch WM. 1973. Is the fixation of observable mutations distributed randomly among the three nucleotide positions of the codon? J. Mol. Evol. 2:123–136. 10.1007/BF01653992 [DOI] [PubMed] [Google Scholar]
- 24.Brown CJ, Zhao L, Evans KJ, Ally D, Stancik AD. 2010. Positive selection at high temperature reduces gene transcription in the bacteriophage ϕX174. BMC Evol. Biol. 10:378. 10.1186/1471-2148-10-378 [DOI] [PMC free article] [PubMed] [Google Scholar]
- 25.Van Duin J, Tsareva N. 2006. Single-stranded RNA phages, p 175–196 In Calendar R. (ed), The bacteriophages. Oxford University Press, New York, NY [Google Scholar]
- 26.Schuppli D, Miranda G, Qiu S, Weber H. 1998. A branched stem-loop structure in the M-site of bacteriophage Qβ RNA is important for template recognition by Qβ replicase holoenzyme. J. Mol. Biol. 283:585–593. 10.1006/jmbi.1998.2123 [DOI] [PubMed] [Google Scholar]
- 27.Klovins J, van Duin J. 1999. A long-range pseudoknot in Qβ RNA is essential for replication. J. Mol. Biol. 294:875–884. 10.1006/jmbi.1999.3274 [DOI] [PubMed] [Google Scholar]
- 28.Drake JW. 1993. Rates of spontaneous mutation among RNA viruses. Proc. Natl. Acad. Sci. U. S. A. 90:4171–4175. 10.1073/pnas.90.9.4171 [DOI] [PMC free article] [PubMed] [Google Scholar]
- 29.Garcia-Villada L, Drake JW. 2012. The three faces of riboviral spontaneous mutation: spectrum, mode of genome replication, and mutation rate. PLoS Genet. 8:e1002832. 10.1371/journal.pgen.1002832 [DOI] [PMC free article] [PubMed] [Google Scholar]
- 30.Bradwell K, Combe M, Domingo-Calap P, Sanjuan R. 2013. Correlation between mutation rate and genome size in riboviruses: mutation rate of bacteriophage Qβ. Genetics 195:243–251. 10.1534/genetics.113.154963 [DOI] [PMC free article] [PubMed] [Google Scholar]
- 31.Clarke A. 2003. Costs and consequences of evolutionary temperature adaptation. Trends Ecol. Evol. 18:573–581. 10.1016/j.tree.2003.08.007 [DOI] [Google Scholar]
- 32.Carter P, Bedouelle H, Winter G. 1985. Improved oligonucleotide site-directed mutagenesis using M13 vectors. Nucleic Acids Res. 13:4431–4443. 10.1093/nar/13.12.4431 [DOI] [PMC free article] [PubMed] [Google Scholar]
- 33.Watanabe I, Sakurai T, Furuse K, Ando A. 1979. “Pseudolysogenization” by RNA phage Qβ. Microbiol. Immunol. 23:1077–1083. 10.1111/j.1348-0421.1979.tb00539.x [DOI] [PubMed] [Google Scholar]
- 34.Inomata T, Kimura H, Hayasaka H, Shiozaki A, Fujita Y, Kashiwagi A. 2012. Quantitative comparison of the RNA bacteriophage Qβ infection cycle in rich and minimal media. Arch. Virol. 157:2163–2169. 10.1007/s00705-012-1419-3 [DOI] [PubMed] [Google Scholar]
- 35.Kashiwagi A, Sakurai T, Tsuru S, Ying BW, Mori K, Yomo T. 2009. Construction of Escherichia coli gene expression level perturbation collection. Metab. Eng. 11:56–63. 10.1016/j.ymben.2008.08.002 [DOI] [PubMed] [Google Scholar]
- 36.Carlson K. 2005. Appendix: Working with bacteriophages: common techniques and methodological approaches, p 437–494 In Kutter E, Sulakvelidze A. (ed), Bacteriophages biology and applications. CRC Press, Boca Raton, FL [Google Scholar]
- 37.Tsukada K, Okazaki M, Kita H, Inokuchi Y, Urabe I, Yomo T. 2009. Quantitative analysis of the bacteriophage Qβ infection cycle. Biochim. Biophys. Acta 1790:65–70. 10.1016/j.bbagen.2008.08.007 [DOI] [PubMed] [Google Scholar]
- 38.Sambrook J, Fritsch EF, Maniatis T. 1989. Molecular cloning: a laboratory manual, 2nd ed. Cold Spring Harbor Laboratory Press, Cold Spring Harbor, NY [Google Scholar]
- 39.Zuker M. 2003. Mfold web server for nucleic acid folding and hybridization prediction. Nucleic Acids Res. 31:3406–3415. 10.1093/nar/gkg595 [DOI] [PMC free article] [PubMed] [Google Scholar]
- 40.Zar JH. 2010. Biostatistical analysis, 5th ed. Pearson Education, Inc., Upper Saddle River, NJ [Google Scholar]
- 41.Kimura M. 1983. The neutral theory of molecular evolution. Cambridge University Press, Cambridge, United Kingdom [Google Scholar]
- 42.Knies JL, Izem R, Supler KL, Kingsolver JG, Burch CL. 2006. The genetic basis of thermal reaction norm evolution in lab and natural phage populations. PLoS Biol. 4:e201. 10.1371/journal.pbio.0040201 [DOI] [PMC free article] [PubMed] [Google Scholar]
- 43.Vollenweider HJ, Koller T. 1976. Physical mapping of Q.β replicase binding sites on Qβ RNA. J. Mol. Biol. 101:367–377. 10.1016/0022-2836(76)90153-4 [DOI] [PubMed] [Google Scholar]
- 44.Barrera I, Schuppli D, Sogo JM, Weber H. 1993. Different mechanisms of recognition of bacteriophage Qβ plus and minus strand RNAs by Qβ replicase. J. Mol. Biol. 232:512–521. 10.1006/jmbi.1993.1407 [DOI] [PubMed] [Google Scholar]
- 45.Jacobson AB, Arora R, Zuker M, Priano C, Lin CH, Mills DR. 1998. Structural plasticity in RNA and its role in the regulation of protein translation in coliphage Qβ. J. Mol. Biol. 275:589–600. 10.1006/jmbi.1997.1472 [DOI] [PubMed] [Google Scholar]
- 46.Schrag SJ, Perrot V, Levin BR. 1997. Adaptation to the fitness costs of antibiotic resistance in Escherichia coli. Proc. Biol. Sci. 264:1287–1291. 10.1098/rspb.1997.0178 [DOI] [PMC free article] [PubMed] [Google Scholar]
- 47.Mammano F, Trouplin V, Zennou V, Clavel F. 2000. Retracing the evolutionary pathways of human immunodeficiency virus type 1 resistance to protease inhibitors: virus fitness in the absence and in the presence of drug. J. Virol. 74:8524–8531. 10.1128/JVI.74.18.8524-8531.2000 [DOI] [PMC free article] [PubMed] [Google Scholar]
- 48.Khan AI, Dinh DM, Schneider D, Lenski RE, Cooper TF. 2011. Negative epistasis between beneficial mutations in an evolving bacterial population. Science 332:1193–1196. 10.1126/science.1203801 [DOI] [PubMed] [Google Scholar]
- 49.Maharjan RP, Ferenci T. 2013. Epistatic interactions determine the mutational pathways and coexistence of lineages in clonal Escherichia coli populations. Evolution 67:2762–2768. 10.1111/evo.12137 [DOI] [PubMed] [Google Scholar]
- 50.Weinreich DM, Watson RA, Chao L. 2005. Perspective: sign epistasis and genetic constraint on evolutionary trajectories. Evolution 59:1165–1174. 10.1554/04-272 [DOI] [PubMed] [Google Scholar]
- 51.Weinreich DM, Delaney NF, DePristo MA, Hartl DL. 2006. Darwinian evolution can follow only very few mutational paths to fitter proteins. Science 312:111–114. 10.1126/science.1123539 [DOI] [PubMed] [Google Scholar]
- 52.Salverda ML, Dellus E, Gorter FA, Debets AJ, van der Oost J, Hoekstra RF, Tawfik DS, de Visser JA. 2011. Initial mutations direct alternative pathways of protein evolution. PLoS Genet. 7:e1001321. 10.1371/journal.pgen.1001321 [DOI] [PMC free article] [PubMed] [Google Scholar]
- 53.Betancourt AJ. 2010. Lack of evidence for sign epistasis between beneficial mutations in an RNA bacteriophage. J. Mol. Evol. 71:437–443. 10.1007/s00239-010-9397-0 [DOI] [PubMed] [Google Scholar]
- 54.Betancourt AJ. 2009. Genomewide patterns of substitution in adaptively evolving populations of the RNA bacteriophage MS2. Genetics 181:1535–1544. 10.1534/genetics.107.085837 [DOI] [PMC free article] [PubMed] [Google Scholar]
- 55.Dethoff EA, Chugh J, Mustoe AM, Al-Hashimi HM. 2012. Functional complexity and regulation through RNA dynamics. Nature 482:322–330. 10.1038/nature10885 [DOI] [PMC free article] [PubMed] [Google Scholar]
- 56.Gottesman S. 2005. Micros for microbes: non-coding regulatory RNAs in bacteria. Trends Genet. 21:399–404. 10.1016/j.tig.2005.05.008 [DOI] [PubMed] [Google Scholar]
Associated Data
This section collects any data citations, data availability statements, or supplementary materials included in this article.