

ABSTRACT
HIV transmission efficiency is greatly increased when viruses are transmitted at virological synapses formed between infected and uninfected cells. We have previously shown that virological synapses formed between HIV-pulsed mature dendritic cells (DCs) and uninfected T cells contain interdigitated membrane surfaces, with T cell filopodia extending toward virions sequestered deep inside invaginations formed on the DC membrane. To explore membrane structural changes relevant to HIV transmission across other types of intercellular conjugates, we used a combination of light and focused ion beam scanning electron microscopy (FIB-SEM) to determine the three-dimensional (3D) architectures of contact regions between HIV-1-infected CD4+ T cells and either uninfected human CD4+ T cells or human fetal astrocytes. We present evidence that in each case, membrane extensions that originate from the uninfected cells, either as membrane sheets or filopodial bridges, are present and may be involved in HIV transmission from infected to uninfected cells. We show that individual virions are distributed along the length of astrocyte filopodia, suggesting that virus transfer to the astrocytes is mediated, at least in part, by processes originating from the astrocyte itself. Mechanisms that selectively disrupt the polarization and formation of such membrane extensions could thus represent a possible target for reducing viral spread.
IMPORTANCE Our findings lead to new insights into unique aspects of HIV transmission in the brain and at T cell-T cell synapses, which are thought to be a predominant mode of rapid HIV transmission early in the infection process.
INTRODUCTION
More than 34 million people worldwide are infected with human immunodeficiency virus (HIV) (1). HIV targets primarily CD4+ T cells, binding and infecting through the CD4 cellular receptor and a chemokine coreceptor, such as CXCR4 or CCR5 (2). In addition to CD4+ T cells, other cell types, including antigen-presenting cells (APCs) (3, 4), can also become infected with HIV. Although cell-free virus readily initiates infection of susceptible target cells, HIV infection can be 10- to 1,000-fold more efficient when it occurs between cells at a virological synapse, an adhesive junction formed between an infected or virus-bearing cell and an uninfected cell, as originally described (5–11).
The virological synapse shares a number of features with the immunological synapse, a normal and necessary interaction that occurs between immune cells. Both immunological and virological synapses are three-dimensional (3D) structures; their formation is dependent on local interactions between cell surface proteins displayed on each cell (12). In immunological synapses formed between CD4+ T cells and APCs, the T cells extend long pseudopodia toward the APCs, significantly increasing the area of membrane contact (13). The formation of HIV-1 virological synapses may involve similar principles (5, 14), but with significant differences in the cell surface proteins and signaling pathways involved (reviewed in reference 15). In virological synapses formed between HIV-pulsed dendritic cells (DCs) and CD4+ T cells, membrane extensions from both cell types participating in synapse formation appear to be involved in mediating the transfer of HIV from the donor to target cells (16, 17). Moreover, studies of the virological synapse between infected and uninfected CD4+ T cells show similar actin-dependent membrane protrusions (5, 18, 19). Previous studies have observed several types of such membrane extensions, including long membrane extensions that require the presence of viral Env (19, 20) and those that appear independent of viral proteins (21). In addition, similar connections may be important, not only for viral transmission but also for retention of T cells in lymph nodes during HIV-1 infection (20).
In addition to infecting cells of the lymphoid tissues, HIV can also penetrate the blood-brain barrier to infect cells of the central nervous system (CNS), including perivascular macrophages, microglia, and astrocytes (22–24). HIV infection in the CNS is associated with cognitive, motor, and behavioral dysfunction, collectively termed HIV-associated neurocognitive disorders (HAND) (25), affecting up to 40 to 50% of HIV-infected patients, despite the use of antiretroviral drugs (26, 27). Because astrocyte endfeet surround blood vessels, these cells are particularly vulnerable to infection if they encounter HIV-carrying T cells crossing the blood-brain barrier (23, 28, 29). While the notion of “Trojan macrophages” as a possible mechanism for transport of HIV to the CNS has been discussed extensively (30), infected T cells could also play this role, especially if the blood-brain barrier is compromised by inflammation, particularly in the process of immune reconstitution (31). Determining the spatial organization of virological synapses formed at T cell-T cell and T cell-astrocyte junctions is therefore of interest for understanding potential mechanisms of HIV transmission.
To study the interactions of HIV-infected T cells with uninfected T cells or astrocytes, we used focused ion beam scanning electron microscopy (FIB-SEM), which can capture the structure of the cell-cell contact zone in its entirety at nanometer resolution (16, 17, 32–35). In this approach, epoxy resin-embedded specimens are prepared using the same method used for traditional transmission electron microscopy (TEM), but rather than being cut into thin sections, the block face is imaged with SEM. In this SEM technique, backscattered electron detection is used to specifically view heavy metal-stained cellular components. After each image is taken, a focused ion beam is used to remove thin slices of material (∼10 nm to 50 nm) from the block face, which is then imaged again. Repeating this process produces a stack of images that can be computationally combined into a 3D reconstruction.
Here, we present a structural study of virological synapses formed at the junction between HIV-infected T cells and several different types of uninfected cells, including the CD4+ T cell lines Jurkat and H9, primary human CD4+ T cells, and primary human fetal astrocytes. Our results provide new insights into the similarities and differences between virological synapses formed by different cell types. Further, they extend the generality of our hypothesis (16) that, in virological synapses, membrane processes from both uninfected target cells and cells infected with or bearing virus contribute actively to facilitate infection at zones of cell-cell contact.
MATERIALS AND METHODS
Primary human CD4+ T cells and fetal astrocytes.
Primary human CD4+ T cells were enriched from peripheral blood mononuclear cells by negative selection using the CD4+ T cell isolation kit II (Miltenyi Biotec) and stimulated with 5 μg/ml phytohemagglutinin (PHA) in RPMI complete (RPMI 1640 medium supplemented with 10% fetal bovine serum [FBS], 2 mM l-glutamine, 100 U/ml penicillin, and 100 μg/ml streptomycin) and 50 U/ml interleukin 2 (IL-2). Primary human fetal astrocytes were isolated from human fetal brain tissue as previously described (36) following approval of the Office for Human Research Protections at NIH (protocol 5831). The cells were cultured in Dulbecco's modified Eagle medium (DMEM) complete (DMEM [Invitrogen] supplemented with 10% FBS).
Coculture of HIV-1 NL4-3-infected T cells with uninfected T cells.
For Jurkat conjugates, Jurkat CL.E6-1 cells (ATCC TIB-152) were infected with HIV-1 NL4-3 and cultured in RPMI complete. At 14 days postinfection, uninfected Jurkat CL.E6-1 cells were added to the infected cells at a 1:1 ratio, gently pelleted, and incubated at 37°C for 8 h. For primary CD4+ T cell conjugates, 3 days after stimulation with 5 μg/ml PHA, primary CD4+ T cells were infected with HIV-1 NL4-3 at a multiplicity of infection (MOI) of 0.2 and maintained in RPMI complete with 50 U/ml IL-2. At 7 days postinfection, uninfected CD4+ T cells (3 days after stimulation with 5 μg/ml PHA) were added to the infected cells at a 1:1 ratio, gently pelleted, and incubated at 37°C for 8 h. After 8 h, T cells were washed, pelleted, and fixed for imaging.
Productive virus transfer.
Jurkat CL.E6-1 cells were infected with HIV-1 NL4-3 and cultured as described above. At 14 days postinfection, cells were labeled with 1.25 μM CellTrace violet (CTV; Invitrogen) in phosphate-buffered saline (PBS) for 20 min at 37°C, and uninfected Jurkat CL.E6-1 cells were labeled with 0.5 μM CFDA SE (CFSE; Invitrogen) in 0.1% bovine serum albumin in PBS for 10 min at 37°C. Labeled target and donor cells were then washed three times with RPMI complete, incubated for 30 min at 37°C, and then suspended in fresh medium. Uninfected and infected cells were mixed at a 1:1 ratio, with or without the presence of 37.5 μM emtricitabine FTC (gift from Romas Geleziunas, Gilead Biosciences), gently pelleted for 5 min, and then incubated at 37°C. Following 24 h of incubation, the mixed cell populations were sorted by fluorescence-activated cell sorting (FACS) based on their CTV or CFSE fluorescence by using a BD Biosciences FACSAria II cell sorter equipped with an aerosol management system. Resulting CTV donor and CFSE target cells were >99% pure. All infectious sorts were performed in accordance with FNLCR biosafety regulations. Total cellular DNA was extracted from cell pellets using the Qiagen DNA blood minikit (Qiagen, Valencia, CA) as described previously (37). After extraction, quantities of R-U5 (early reverse transcripts) and gag (late minus-strand synthesis products) were determined using primers (Invitrogen) and probes (Biosource International) as described previously (37). Viral DNA was normalized for cell equivalents as measured using CCR5 primers and probes as described previously (38). All quantitative PCR was performed using an Mx3000P instrument (Stratagene, Santa Clara, CA).
Coculture of HIV-infected T cells with human fetal astrocytes.
H9 cells chronically infected with HIV-1 IIIb were obtained from the NIH AIDS Research and Reference Reagent Program and maintained as described previously (39). For H9 cells acutely infected with HIV-1 NLENG1, viral stocks were prepared by transfecting HEK293T cells, using Lipofectamine 2000 (Invitrogen), with an HIV-1 NL4-3-based reporter virus clone, pNLENG1, which was constructed by inserting the enhanced green fluorescent protein (EGFP)-encoding gene with the internal ribosome entry site (IRES) between the genes env and nef of pNL4-3 as described previously (40, 41). H9 cells were infected with NLENG1 for 5 days prior to coculture. A total of 2 × 10⁵ mature human fetal astrocytes were seeded on a glass-bottom dish (MatTek) in DMEM complete. The next day, 2 × 10⁶ HIV-1 IIIb- or NLENG1-infected H9 cells were laid on the astrocytes. As a control, astrocytes were cultured with 50 μg/ml HIV-1 IIIb or NLENG1 (NL4-3) as determined by an HIV-1 p24 antigen enzyme-linked immunosorbent assay (ELISA) kit (ZeptoMetrix Corporation). The cells were cocultured for an additional 24 h. The medium was removed, and unattached cells were rinsed away in PBS prior to fixation and imaging.
Fluorescence microscopy.
For experiments involving Jurkat or primary CD4+ T cell conjugates, the cells were air dried onto glass slides and fixed in 4% paraformaldehyde (Sigma) in PBS. Cells were stained with a 1:500 dilution of gp120 antibody (Sino Biological, Inc.), followed by a 1:500 dilution of Alexa-Fluor 488 goat anti-rabbit antibody (Molecular Probes). Cells were mounted with ProLong Gold antifade reagent (Molecular Probes). For astrocyte experiments, cocultures were grown on MatTek plates as described above, fixed in 4% paraformaldehyde in PBS, and permeabilized in 0.2% Triton X-100 (Sigma) in PBS. Cells were stained with a 1:1,000 dilution of anti-glial fibrillary acidic protein (GFAP) antibody (Sigma) and a 1:500 dilution of Alexa-Fluor 594 anti-rabbit antibody (Molecular Probes) and then costained with 4′,6-diamidino-2-phenylindole (DAPI) at a 1:1,000 dilution (Sigma). Images were obtained on an Olympus IX51 microscope. Structured illumination (SI) imaging was performed on a homebuilt microscope system based around an upright microscope (Olympus BX51). SI reconstruction was performed with customized MATLAB scripts. For the astrocyte viral transfer experiment, human fetal astrocytes were cocultured with NLENG1-infected H9 cells as described above, except that coculture was maintained for 4 days. Cells were fixed and stained with DAPI and anti-GFAP as described above and visualized by fluorescence microscopy. Astrocyte cell outlines were traced from a differential inference contrast (DIC) image in Adobe Illustrator.
Quantitation of GFAP distribution.
Astrocytes alone, astrocytes with cell-free virus, or astrocytes and HIV-1-infected H9 cells were maintained in coculture for 24 h and then were stained with anti-GFAP and DAPI and imaged by fluorescence microscopy as described above. The areas of GFAP expression and DAPI stain were automatically calculated using binary masks by automatic thresholding (ImageJ). The area of GFAP expression was normalized to cell number, as indicated by DAPI-stained astrocyte nuclei (see Fig. 6 and 8). Mean and standard error were calculated, and statistical significance was tested using a one-way analysis of variance (ANOVA) followed by Bonferroni's test for multiple comparisons of astrocyte cocultures against a control culture of astrocytes alone.
FIG 6.

Human fetal astrocytes extend long membrane protrusions in the presence of HIV-1-infected T cell lines. (A to F) Fluorescence microscopic images of primary human fetal astrocytes (A), astrocytes cultured with HIV-1 IIIb (B), astrocytes cultured with NLENG1 (C), astrocytes cocultured with uninfected H9 cells (D), astrocytes cocultured with HIV-1 IIIb chronically infected H9 cells (E), and astrocytes cocultured with NLENG1 acutely infected H9 cells for 24 h (F). Intermediate filaments are labeled with glial fibrillary acidic protein (GFAP; green). Nuclei are labeled with DAPI (blue). Thin cell bodies with long, overlapping membrane protrusions are observed only in astrocytes cocultured with HIV-infected T cells. Scale bars, 50 μm. (G to H) Quantitative analysis of cells cultured under each of the conditions described for panels A to F. (G) The average area of GFAP expression per astrocyte is significantly (P < 0.0001) higher in cultures with HIV-1 or HIV-1-infected H9 cells. (H) The average number of astrocytes per field of view as calculated for panel G. (I) A long astrocyte protrusion (cocultured as described for panel E) measures 478.59 μm in length with a 33.60-μm-wide cell body. (J) Astrocytes (cocultured as described for panel E) have thin cell bodies with long, branched membrane protrusions. (K) A magnified view of one astrocyte cocultured as described for panel E shows membrane processes away from the cell body. (L) Structured illumination microscopy of a section (K; white box) of a long membrane protrusion. Individual intermediate filaments, which provide the mechanical strength and structure for the astrocyte membrane protrusions, are clearly visible. Scale bars (J to L), 10 μm.
FIG 8.

Automated image analyses reveal the number of cells and area of GFAP expression per human fetal astrocyte. Fluorescence microscopic image of astrocyte stained with DAPI (blue) and anti-GFAP (green) shows the image analysis technique used for Fig. 6. (A) DAPI stain marks distinct cell nuclei; (B) image from panel A, following application of a binary mask based on the pixel intensity profile to identify discrete cells; (C) fluorescence signal from GFAP-specific antibody (green) marks astrocyte intermediate filaments; (D) image from panel C, following application of a binary mask based on the pixel intensity profile to define area of GFAP expression; (E to F) representative images to show that astrocytes and H9 cells can be readily distinguished based on morphological differences between the long astrocytes and the spherical H9 cells. (E) Human fetal astrocytes cocultured with HIV-1 IIIb-infected H9 cells for 24 h, imaged by light microscopy. Scale bar, 100 μm. (F) Topographical SEM image of a resin-embedded block of cocultured astrocytes and HIV-1 IIIb-infected H9 cells. An astrocyte-H9 cell conjugate is highlighted. (Inset) Higher magnification shows the nuclei of two adjacent cells. One cell is ∼10 times longer than the other (128.1 μm compared to 11.8 μm), suggesting an astrocyte (“A” in panel F) and H9 cell (“T” in panel F) conjugate. FIB-SEM imaging was performed on the area denoted by the dotted white box in the direction indicated by the white arrow (Fig. 9; see also Movie S2 in the supplemental material).
Sample preparation for electron microscopy.
Astrocyte-H9 cell conjugates were first imaged by fluorescence microscopy on an alphanumeric-coded, grid-patterned glass. Jurkat-Jurkat or primary T cell-T cell conjugates were pelleted and prepared without a glass slide. For all samples, cells were prepared essentially as described previously (42). Briefly, the cells were washed in PBS and fixed in 2% glutaraldehyde in 0.1 M sodium cacodylate, pH 7.0, for 1 h at room temperature. The cells were washed 3 times in sodium cacodylate buffer and then postfixed with 1% osmium tetroxide in sodium cacodylate for 1 h at room temperature and washed with sodium cacodylate and 0.1 M sodium acetate (pH 4.2) buffer once. The cells were stained with 0.5% uranyl acetate in sodium acetate buffer for 1 h and washed in sodium acetate. The sample was dehydrated with ethanol in 35%, 50%, 70%, and 95% deionized water twice for 10 min each and 100% ethanol 3 times for 10 min, embedded in PolyBed 812 Luft Formulations embedding kit/DMP-30 (PolySciences), and rotated overnight. The next day, the resin was replaced with fresh resin and placed at 56°C for 48 h to induce polymerization. For astrocyte samples, 48 wt% hydrofluoric acid was used to remove the glass bottom. The embedded resin block was trimmed and mounted on a specimen stub by using colloidal silver paint (Electron Microscopy Sciences) and sputter coated with gold.
FIB-SEM.
A Zeiss NVision 40 Crossbeam microscope (Carl Zeiss NTS) equipped with Atlas3D (Fibics Inc., Ottawa) was used for data collection as described previously (16, 32, 35). A focused ion beam (FIB) (700 pA or 1.4 nA for T cell-T cell samples and 300 pA for astrocyte samples) iteratively removed slices (49 nm for Jurkat cell samples, 45 nm for primary T cell samples, and 16 nm for astrocyte samples). The scanning electron beam was used to record images at pixel sizes of 3 to 7 nm in the xy plane. The scanning electron microscopy (SEM) images were recorded using an energy-selective backscattered electron (ESB) detector. For the Jurkat and primary CD4+ T cell samples, we selected data volumes with the clear presence of HIV-1 virions and sufficient levels of infection. The data collected for the Jurkat data set shown here was 48 μm by 23 μm and 353 images, producing a final volume of ∼20,000 μm3 with ∼20 Jurkat cells. For the primary T cell data, the data set selected was 60 μm by 31 μm and 789 images, producing a final volume of ∼66,000 μm3 with ∼40 cells. For astrocyte samples, we selected regions of interest based on the presence of H9 cells and astrocytes as observed with wide-field microscopy. Figures in this work were derived from three data sets with a total of 4 unique astrocyte-H9 cell contact zones; each data set was approximately 20 μm by 40 μm and 400 to 600 images, with a final volume of ∼16,000 μm3.
Processing of electron microscopy images.
Individual 2D images were merged, cropped, and aligned using customized scripts based on the image processing programs IMOD (UC Boulder) and Bsoft as previously described (32). Features of interest were automatically selected with 3DSlicer (43) (www.slicer.org) or Avizo Fire (Visualization Sciences Group) using a thresholding tool. The initial automatic segmentation was refined manually using Avizo Fire or Autodesk 3D Studio Max software to produce 3D visualizations, and the volume rendering was colorized using Adobe Photoshop.
Ethics statement.
Human fetal brain tissue was acquired following approval of the Office for Human Research Protections at NIH (protocol 5831). For this protocol, consent for use of this tissue was not required. Primary human T cells were harvested as a by-product of volunteer donor blood units and were distributed in an anonymized manner. They meet the criteria for exemption from need for informed consent and IRB review as defined in 45 CFR 46, and their distribution abides by all NIH guidelines for human subject research.
RESULTS
Fluorescence microscopy of T cell synapses.
To examine synapses between HIV-1-infected and uninfected T cells, we utilized a coculture system in which T cells productively infected with HIV-1 were washed extensively to remove free virus and then cultured with uninfected T cells and examined for synapse formation and virus transfer. First, we tested the system with cells of the CD4+, CXCR4+, CCR5− T cell line Jurkat E6-1 (44). Jurkat cells infected with the X4-tropic HIV-1 NL4-3 virus formed conjugates with uninfected Jurkat cells. Evidence of Env capping, demonstrated by the presence of HIV-1 gp120, could be detected at the cell-cell contact zone but not in unconjugated cells (Fig. 1A to C, Fig. 2A to E), as has been described previously (6, 45). To evaluate potential transfer of virus leading to productive infection of uninfected target cells, we differentially labeled infected donor and uninfected target cells and then used FACS to separate the donor and target cells to >99% purity, following 24 h of coculture. Quantitative PCR analysis for accumulation of early (R-U5) and late (gag) HIV-1 reverse transcripts, indicative of virus transfer and initiation of infection of target (initially uninfected) cells, is shown in Fig. 1G. This virus transfer may include both cell-mediated and cell-free virus transfer, although extensive washes to remove free virus likely limit viral transfer to cell-cell contacts. The presence of these reverse transcripts in the target cells and the ability to inhibit their accumulation with the nucleoside reverse transcriptase inhibitor emtricitabine FTC demonstrate initiation of de novo infection of the target cells (Fig. 1G). We also evaluated conjugates between uninfected and HIV-1 NL4-3-infected primary CD4+ T cells. In 2D images, although an accumulation of HIV-1 gp120 was detected only in cell conjugates and not unconjugated cells, gp120 signal was found adjacent to the cell-cell contact zone, rather than clearly within the zone (Fig. 1D to F, Fig. 2F to I). At this resolution, it appears that the contact zones between primary CD4+ T cells are more complex than those of Jurkat cells. To elucidate exactly where HIV-1 virions lie in relation to the contact zone in these conjugates, we turned to electron microscopy.
FIG 1.

Virological synapse formation between infected and uninfected T cells by light microscopy. Cells are visualized by fluorescence microscopy (A, D), bright-field microscopy (B, E), and merged images (C, F). HIV-1 NL4-3-infected Jurkat cells were cocultured with uninfected Jurkat cells (A to C), and HIV-1 NL4-3-infected primary CD4+ T cells were cocultured with uninfected primary CD4+ T cells for 8 h (D to F). HIV-1 virions are marked by anti-gp120 antibody labeling (green). Scale bars, 10 μm. (G) HIV-1 NL4-3-infected Jurkat cells (donor) were cocultured with uninfected Jurkat cells (target) for 24 h, with or without the reverse transcriptase inhibitor emtricitabine FTC. The cells were sorted and analyzed by quantitative real-time PCR for early (R-U5) and late (gag) HIV-1 reverse transcripts, indicative of virus transfer and initiation of infection, normalized to diploid genome cell equivalents, based on quantitative PCR for a single-copy CCR5 DNA sequence (59, 60).
FIG 2.

Gp120 staining is punctate in cells that are clustered but not in single, unclustered T cells in coculture of infected and uninfected cells. HIV-1 NL4-3-infected T cells were cocultured with uninfected T cells as described for Fig. 1. Cells are visualized by fluorescence microscopy (A, F), bright-field microscopy (B, G), and merged images (C to E, H to J). (A to E) Infected Jurkat cells cocultured with uninfected Jurkat cells. Cells in panels D and E are from the image in panel C. (F to J) Infected primary CD4+ T cells cocultured with uninfected primary CD4+ T cells. Cells in panels I and J are from the image in panel H. Scale bars, 10 μm.
3D electron microscopy of T cell virological synapses.
In order to better understand the nature of T cell-T cell interactions at virological synapses, we used FIB-SEM to image complexes formed between infected and uninfected Jurkat T cells and between infected and uninfected primary human CD4+ T cells. A 3D stack of 2D SEM images provides an understanding of the overall structural organization of entire cells, including cell-cell contact zones (Fig. 3; see Movie S1 in the supplemental material) at an order-of-magnitude-higher resolution than is possible by light microscopy (Fig. 1). Once the image stack is recorded, the membranes and organelles of individual cells can be segmented to visualize contacts between infected and uninfected cells in 3D (see Movie S1). In these 3D images, the presence of budding HIV-1 virions on the cell surface is used as a marker to identify infected cells, while cells without identifiable internal or budding virus are presumptively considered uninfected.
FIG 3.

FIB-SEM imaging reveals virological synapses between infected and uninfected T cells. An 8-h coculture of uninfected and HIV-1 NL4-3-infected Jurkat cells was imaged with FIB-SEM and segmented in 3D. The image dimensions were 48 μm by 24 μm by 17 μm, resulting in a 20,000 μm3 volume. Representative transverse digital sections of the data are drawn out of the volume.
A comparison of synapses formed between Jurkat and between primary CD4+ T cells reveals that there are remarkable differences between the types of contacts formed by these cells (Fig. 4). Jurkat cells have a smooth, generally spherical shape and do not deform or wrap around neighboring cells (Fig. 4A and B). In contrast, reflecting normal shape changes observed in these cells (13), activated primary CD4+ T cells wrap tightly and extensively around neighboring cells (Fig. 4C and D), and, in some cases, apparently uninfected primary T cells can extend long filopodia toward infected cells (Fig. 4E and F) over a distance of up to 30 to 40 μm across multiple cells, similar in some respects to what has been described previously (21). The existence of these long-range contacts would be difficult to deduce using conventional 2D electron microscopy or even with electron tomography, which requires sections approximately 1-μm thick in order to be imaged by transmission electron microscopy. While there is some variation in the cell body shape observed with primary CD4+ T cells (e.g., Fig. 4C and D compared to E and F), overall, primary CD4+ T cells display increased membrane extensions compared to those of Jurkat cells (Fig. 4A and B); these differences in cell shape appear to correspond with differences in the architecture of the cell-cell contact zones.
FIG 4.

Segmentation of FIB-SEM data shows clear differences between Jurkat cell and primary CD4+ T cell synapses. (A and B) Segmentation of Jurkat cells from the data set in Fig. 3 reveals three infected (*) and two uninfected cells. (B) Zoomed-in view of the cells in panel A. Short membrane extensions cross the synapse from both infected and uninfected cells. (C to F) Uninfected and HIV-1 NL4-3-infected primary CD4+ T cells were cocultured for 8 h and imaged as described for panels A and B. (C) Zoomed-out view of the primary cell cluster reveals extensive membrane interdigitation between infected (*) and uninfected cells. Several virions (red) can be seen at the contact zones with infected cells. (D) Rotated view of the cells shown in panel C. An uninfected cell (brown) with a large membrane-enclosed extension (white arrow) stretches around another uninfected cell (purple), making direct contact with an infected cell (blue). (E) Segmentation of primary T cell cluster shows close contacts between uninfected and infected (*) T cells, as well as a long filopodial contact between the infected cell and a distant, uninfected cell. (F) Back view of the primary cell cluster shown in panel E. Cells display many long filopodia and membrane extensions, common in primary CD4+ T cells but not in Jurkat cells.
In addition to 3D reconstructions of entire cells, FIB-SEM also has sufficient resolution to visualize and identify individual virions, including those budding from the cell surface and those released from the cell (Fig. 5A to G). The ability to simultaneously visualize individual virions and the entire cell-cell contact zone thus provides an opportunity to define the spatial distribution of viruses at the virological synapse. These analyses reveal important differences in the structural features of synapses formed by Jurkat cells and primary CD4+ T cells. To further explore the architecture of the T cell virological synapses, we analyzed virus distribution at cell-cell contact zones in synapses formed between Jurkat cells and between primary T cells. In Jurkat cell virological synapses, viruses are, in most cases, distributed throughout the contact zone (Fig. 5H to O), similar in some respects to what has been reported previously (6, 18). In contrast, contact zones between infected and uninfected primary human CD4+ T cells show a region of tightly opposed membranes from which HIV-1 virions are largely excluded, being present in a ring at the periphery of the synapse (Fig. 5P to W). Furthermore, the contact zones of primary T cell synapses are more irregular (Fig. 5P to W, noted by 5.5-μm crosshair lines), suggesting much closer cell-to-cell membrane contact, consistent with the 3D views of the primary T cell contacts shown in Fig. 4C to F. This is supported by a semiquantitative analysis of the positions of virions at the Jurkat compared to primary CD4+ T cell synapses (Fig. 5X and Y). Moreover, the well-defined localization of HIV to the outer boundary of the contact zone in synapses involving primary T cells is consistent with the extensive, tight membrane contact observed in the whole-cell images (Fig. 4C to F). Together, the data shown so far support the idea that the 3D structure of the synapse, as well as the virus distribution at the synapse, is influenced by the array of cellular interactions available to the cells in the synapse. To investigate whether similar structures can be observed in virological synapses formed between HIV-1-infected cells and nonimmune cells, we turned to astrocytes, cells in the brain known to be permissive for HIV infection (46, 47).
FIG 5.

Distribution of budding and released virions in cocultures of infected and uninfected T cells. (A to E) A single SEM image slice from a 3D stack shown at progressively higher magnifications reveals virions present on the surface of a Jurkat cell. SEM slice is from the block shown in Fig. 3. (F and G) Additional examples of virions on a Jurkat cell surface of a different Jurkat cell showing both mature cores (F) and immature cores at an early stage of budding (G). (H to O) Views of the contact zones between the uninfected and infected Jurkat cells from Fig. 4A and B, through a transparent uninfected cell to a segmented infected cell. Virions (red) are found in a ring outside the contact zone. (P to W) Views of the contact zones between the uninfected and infected primary T cells from Fig. 4C to F, shown as in panels H to O. (I, K, M, O, Q, S, U, W) 2D graphical representations highlight the boundaries of the cell-cell contact zones in panels H, J, L, N, P, R, T, and V, showing distribution of HIV-1 virions. Crosshair lines are 5.5 μm. (X) Quantification of virion placement from synapses, indicating that virions in Jurkat synapses are closer to the center of the synapse than virions in primary CD4+ T cell synapses. The difference between the mean distances (in microns) of virions from the center of the crosshair and the mean distance of the synapse edge from the center of the crosshair at 45-degree increments for each cell is shown. (Y) The distance between each virion and the closest synapse edge (interior, <0; exterior, >0) for virions at Jurkat and primary CD4+ T cell synapses.
Architecture of astrocyte-T cell synapses.
As noted earlier, T cells can transfer HIV-1 to many cell types, including astrocytes, through cell-to-cell contact (36). To investigate the nature of T cell-astrocyte synapses, we first used fluorescence microscopy to assess morphological changes that occur in cultured primary astrocytes upon contact with H9 cells chronically infected with HIV-1 IIIb or acutely infected with the HIV-1 NL4-3-based reporter virus NLENG1 (Fig. 6). To verify that virus was taken up by astrocytes in this culture system, astrocytes cultured with NLENG1-infected H9 cells were imaged; the presence of green fluorescence in astrocytes that are attached to H9 cells indicates that transfer of virus occurs in this system (Fig. 7). Cultured astrocytes display compact polygonal shapes when cultured on their own (Fig. 6A) or with uninfected H9 cells (Fig. 6D). However, when exposed to H9 cells infected with either HIV-1 IIIb or NLENG1, but not to cell-free virus (Fig. 6B and C), the astrocytes show dramatic changes in cellular morphology, with a clear increase in the prevalence of membrane extensions (Fig. 6E and F). To obtain a quantitative estimate of the extent of these morphological changes, we analyzed changes in glial fibrillary acidic protein (GFAP), a protein involved in intermediate filament formation and present in astrocyte filopodial extensions. We quantified the area of GFAP expression per astrocyte using automated tools for 2D image segmentation (outlined in Fig. 8A to D). Coculture with uninfected H9 cells did not alter the overall area covered by GFAP in primary astrocytes, compared to GFAP protein distribution in astrocytes cultured alone. However, coculture with HIV-1-infected H9 cells or cell-free HIV-1 resulted in a measurable increase in the area of GFAP distribution (Fig. 6G to H). While the presence of HIV-1 can stimulate the expression of GFAP, a well-known astrocyte response to pathogens, including HIV-1 (48), it is the presence of infected H9 cells that is required for morphological changes (Fig. 6A compared to E and F) and the presence of membrane extensions. The membrane extensions that are formed in astrocyte coculture with HIV-1 IIIb-infected H9 cells can measure as long as 500 μm (Fig. 6I). These membrane extensions may also be branched, radiating outward from the cell body (Fig. 6J and K). Structured illumination microscopy demonstrates that within each membrane extension, intermediate filaments appear to twist into a ribbon (Fig. 6L) that could provide structural support to filopodial extensions (49). Together, these results show that coculture with HIV-1-infected cells resulted in significant increases in membrane extensions on the surface of primary human fetal astrocytes.
FIG 7.
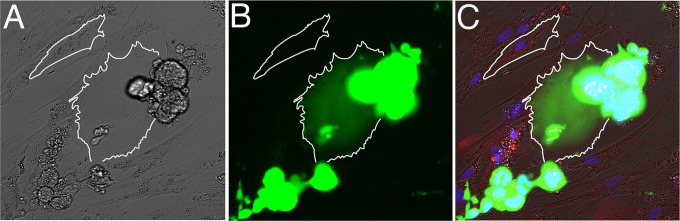
Viral transfer occurs in astrocyte-H9 coculture system. Human fetal astrocytes cocultured with NLENG1-infected H9 T cells for 4 days. Cells that are infected with the green fluorescent protein (GFP)-tagged reporter viruses have green fluorescent signal. Images shown are bright-field (A), GFP green channel (B), overlay of GFP green, DAPI blue, glial fibrillary acidic protein (GFAP) red (C). The astrocyte at the center of the image (outlined in white), which lies underneath a cluster of NLENG1-infected H9 cells, has green fluorescent signal, indicating that it is infected with NLENG1. Another astrocyte in the top left corner further away from the T cell cluster does not have green fluorescent signal, indicating that it is not infected.
To explore the potential connection between the formation of membrane extensions and HIV-1 transmission, we investigated the structures of contact zones between HIV-1 IIIb-infected H9 cells and astrocytes using FIB-SEM. Since astrocytes can be very large, it was important to use methods that could ensure that the FIB-SEM imaging was directed specifically to regions of cell-cell contact. We used light microscopy and low-dose topographical SEM (32) to identify cell-cell contact zones, taking advantage of the striking morphological differences between the elongated human fetal astrocytes and the spherical HIV-1 IIIb-infected H9 cells (Fig. 8E and F). Once the cells and the contact regions were identified, we carried out targeted FIB-SEM imaging to obtain three-dimensional reconstructions of the astrocyte-H9 cell synapse. Individual cross-sectional SEM images through the contact zone show cell boundaries, organelle distribution, and the presence of mature HIV-1 particles in the region between the two cells (Fig. 9A to C and E). Visualization of the image stack (see Movie S2 in the supplemental material) as a 3D volume (Fig. 9D) shows that the contact between infected H9 cells and astrocytes is different both from the membrane interdigitation observed between DCs and primary T cells at virological synapses (16, 17) and from the membrane spreading observed at the synapses formed by primary CD4+ T cells (Fig. 4). Instead, the central feature of the astrocyte-H9 cell contact zone is a set of filopodial extensions emanating from the astrocyte. These protrusions extend directly toward the HIV-infected H9 cell and are surrounded with HIV-1 particles. The presence of the filopodial extensions covered with HIV-1 virions is suggestive of the mechanism of virus “surfing” described previously (50–53), where extension of these long filopodia contributes to infection. The architecture of the virological synapses between the HIV-infected H9 cells and astrocytes supports the hypothesis that, in this system, morphological changes in uninfected cells influence the distribution of viruses at the contact zones and may facilitate infection.
FIG 9.

HIV virions “surf” along membrane extensions within the H9 cell-astrocyte virological synapse. (A) 2D FIBSEM image of an HIV-1 IIIb chronically infected H9 cell (left) and an uninfected astrocyte (right), cocultured for 24 h. The astrocyte adheres to the substrate while the H9 cell remains suspended in the culture medium. Scale bar, 1 μm. (B) In the synaptic region (panel A, black box), the H9 cell and astrocyte extend thin filopodia across the synapse with virions trapped at the junction. (C) Three virions (panel B, black box) have dark, conical-shaped densities in the center, indicative of viral capsids. Inset scale bars, 150 nm. (D) 3D rendering of the FIBSEM image stack containing the contact zone between the HIV-1 IIIb (red)-infected H9 cell (gold) and astrocyte (blue). The target cell extends long filopodial bridges (arrows) toward the infected cell across the intercellular gap. HIV-1 virions are found adjacent to the filopodial bridges. (E) Semitransparent visualization of the H9 cell and astrocyte reveals the dense accumulation of HIV at the cell-cell contact zone.
To further explore the variety of virological synapses that can occur between astrocytes and HIV-1-infected H9 cells, we imaged several additional variants of the filopodium-rich virological synapse described in Fig. 9. In some instances, the filopodia appear to be very thick, essentially forming a large branch emanating from the central body of the astrocyte (Fig. 10A to D). In others, thin astrocyte membrane extensions form virological synapses containing concentrated HIV-1 clusters at the contact zone between the astrocyte and infected H9 cell (Fig. 10E and F). Visualization of the entire contact zone in 3D illustrates that what may appear as a pair of noninteracting cells in a 2D image (Fig. 10C) is instead a slice through a region of extensive cell-cell contact (Fig. 10D). Further, in instances where single slices show cells that are far apart, collections of filopodial extensions emanating from different regions of the astrocyte are observed, all appearing to point toward virions emerging from the membrane of the infected T cell (Fig. 10E and F).
FIG 10.

Structural variations in membrane contact at the astrocyte-H9 cell virological synapse. 2D FIBSEM images (A, C, E) and 3D colorized reconstructions of HIV-1 IIIb (red)-infected H9 cells (gold) and human fetal astrocytes (blue) cocultured for 24 h (B, D, F). Scale bars, 1 μm. (A, B) An astrocyte extends a thick membrane protrusion (arrow) toward the HIV-infected H9 cell, forming an extensive contact zone with a T cell filopodium. (C, D) A thick astrocyte membrane protrusion (arrow) closes the intracellular gap between the astrocyte and the HIV-1-infected H9 cell. HIV-1 virions are found concentrated in the elbow and along the length of the thick astrocytic protrusion. (E, F) A cluster of astrocyte filopodia (arrow) extends toward a group of HIV-1 virions located on the H9 cell membrane.
DISCUSSION
Determining the 3D architecture of virological synapses and virus distribution at this specialized zone of cell-cell contact is central to understanding the mechanisms of cell-to-cell spread of HIV-1. Virological synapses, as originally defined by Jolly and Sattentau (54), and as structurally defined by a number of 3D structural analyses, including our present work, are cytoskeleton-dependent, stable adhesive junctions across which virus is transmitted by directed transfer (5–7, 9, 11, 14, 16, 17, 19, 21). The concentration of viruses at the synapse enables more effective infection of the target cells and, in addition, provides a potential mechanism to shield the virus, at least partially, from the immune system. In earlier studies of virological synapses formed at the junction between HIV-pulsed DCs and uninfected CD4+ T cells, we presented evidence for the involvement of membrane extensions from both cell types at the zone of cell-cell contact (16, 17). Biochemical experiments have shown that, at least in the case of immature DCs, these membrane extensions are induced following engagement of DC-SIGN by HIV-1 envelope glycoproteins in a cascade involving Src kinases, Cdc42, Pak1, and Wasp (17). In synapses formed by mature DCs, large sheet-like membrane extensions encase the T cell near the sites of cell-cell contact, enabling close access of the shorter filopodial extensions from the T cell to virion-rich channels near the surface of the DC (Fig. 11A). Interestingly, despite the general similarities in the nature of the membrane extensions observed on immature and mature DCs, the envelopment of the T cell seen with mature DCs is not observed with immature DCs (Fig. 11B). Nevertheless, in virological synapses formed by both immature and mature DCs, virus delivery appears to also involve membrane extensions from the uninfected cell. These different formations are likely a reflection of the normal cellular contacts formed by these types of cells but still represent important features for HIV cell-to-cell transmission at these synapses.
FIG 11.

Schematic illustration of the membrane architectures of four distinct types of cell-cell contact at HIV-1 virological synapses determined by 3D electron microscopy. (A) Encasement of target cell by mature dendritic cell (DC) and interaction of filopodia from target T cell with viral reservoirs in DCs (16); (B) network of filopodial extensions at the cell-cell contact zone that enable virus transfer from the surface of immature DCs to uninfected CD4+ T cells (17); (C) rearrangement and shape change of uninfected CD4+ T cell enabling extensive membrane contact with HIV-1-infected T cells; (D) membrane bridges extend from astrocytes at regions of contact with HIV-1-infected T cells, providing a mechanism for viruses to “surf” from the infected cell to the astrocyte.
Our analyses of T cell-T cell contacts presented here (Fig. 11C) demonstrate that the structural features of these virological synapses are distinct from those formed between DCs and T cells. Unlike in contacts formed with DCs, in synapses formed between infected and uninfected primary CD4+ T cells, we found that the cells extensively wrap around neighboring cells, with HIV-1 virions found clustered at the periphery of the contact zone. In other cases, long membrane extensions, some more than 30 μm in length, were also observed. Previous studies of the T cell-T cell synapse, either with primary CD4+ T cells or in a Jurkat model system, have described a number of different ultrastructural features of the synapse, including short filopodia (6), long extensions or nanotubes (19), single synapses and polysynapses (18), as well as viral transfer through “synaptic buttons” and endocytosis (55). In addition, light microscopic studies have demonstrated the presence of HIV-1 Gag proteins in Jurkat-Jurkat or Jurkat-primary T cell synapses (5, 18, 55), either at the tip of membrane extensions or in a ring around the tightly apposed synapse. In the work presented here, we clearly see clusters of both Jurkat and primary CD4+ T cells, similar to polysynapses; we also see long membrane extensions, particularly in primary cells, that resemble the nanotubes referenced above. However, a closer look at the areas of tight cell-cell contact reveals clear differences between Jurkat and primary CD4+ T cell synapses. While the Jurkat junctions in our study appear relatively “loose” (Fig. 4B), with virions present between the cells, the synapses formed between primary CD4+ T cells appear much tighter, with greater areas of cell contact and with virions present in a ring and largely excluded from the cell contact zone. Previous high-resolution studies of the synapse, both by thin-section TEM (18, 55) and by thick-section electron tomography (6), have revealed “loose” junctions with virions present between cells; however, these electron microscopic studies included at least one Jurkat cell at the synapse. Our data suggest that, as shown previously for HTLV-1 virological synapses (56), the junctions between primary cells may be much tighter than for virological synapses formed by cell lines; thus, Jurkat-Jurkat or Jurkat-primary T cell synapses may not represent the ultrastructure found between infected and uninfected primary CD4+ T cells.
Live imaging of HIV-1 virological synapses in T cells has indicated that virions can transfer either along filopodia (“virus surfing”) (19, 21) or directly across a synapse (18, 55). The latter structure (termed a “synaptic button” by Hubner et al. [55]) was observed within the first 2 h of the synapse; one possible explanation for why we did not observe these structures was that the synapses visualized in this study were later-stage synapses (8 h for T cells and 24 h for astrocytes). We observed the former structure, characterized by long filopodial extensions from both infected donor and uninfected target cells, in both primary CD4+ T cell synapses and in astrocyte-H9 synapses. Given the snapshot nature of our study, however, it is not clear whether the membrane extensions revealed in our study are formed by the same mechanism as those noted previously. Nevertheless, as reported for other virological synapses (19, 21), the long-distance membrane contacts observed in our study may likewise enable the transfer of HIV-1 to uninfected cells by virus surfing.
At the synapses formed between astrocytes and infected H9 cells, extensions from both cells form a filopodial network at the cell-cell contact zone (Fig. 11D). The extended membrane projections from the astrocytes are pointed directly at the infected H9 cell, providing a conduit for HIV-1 to “surf” along the projections toward the uninfected cell. This network is reminiscent of the filopodial bridges observed in the rat XC sarcoma cell line model system, which are stabilized by the presence of target cell receptor molecules at the tip of the membrane extension and Env proteins on the infected cell surface (19, 53) and which facilitate viral transfer via an actin-dependent process. Nevertheless, the structure of the astrocyte membrane extensions, with high levels of GFAP, a protein restricted primarily to astrocytes, is likely specific to this cell type; this suggests that while the general presence of membrane extensions is shared among many cell types, there are unique characteristics of these interactions that are cell type specific.
These observations suggest that the type of interaction between infected and uninfected cells is particular to the cell types involved in the synapse; thus, spatial architecture of zones of cell-to-cell transmission may vary significantly between different types of virological synapses. The membrane extensions from APCs, T cells, and astrocytes could be formed from close but “not-yet-touching” cells to close the gap (19) or could be “sticky” trailing pseudopodia left from previously touching cells that are beginning to move apart (20, 21). Nevertheless, the similarities between the various virological synapses shown here and elsewhere (16, 17) suggest that the common element of membrane projections may provide a useful route for exploring therapeutics aimed at blocking cell-to-cell transfer. A schematic summary of the four types of virological synapse architectures observed from our previous and current studies is presented in Fig. 11.
While light and electron microscopic studies have begun to provide insights into some of the structural themes associated with HIV transfer at virological synapses (5, 8, 9, 16, 17, 57), the chemical mechanisms leading to their formation are poorly understood. The observation of membrane extensions from the uninfected cells suggests that there may be a signal that is sensed by the uninfected cell, such as a diffusible chemical messenger or perhaps even monomeric gp120 that diffuses and initiates signaling by binding to coreceptors on target cells, as has previously been suggested (58). Indeed, it has been shown that a virus can stimulate uptake and cytoskeleton-dependent retrograde transport within filopodia (51), although this has not been directly observed in the HIV-1 virological synapse. The response of each cell type appears to be distinct, as evidenced by the clear differences between synapses formed by primary cells versus those formed by cells from immortalized cell lines, as in the case of Jurkat compared to primary CD4+ T cell synapses (Fig. 4). There is little doubt that cytoskeletal remodeling must be an essential component of the changes in cellular morphology at the synapse. Thus, actin polymerization inhibitors such as cytochalasin D disrupt HIV localization at synapses formed by mature DCs (16), and inhibiting the function of the Rho family GTPase Cdc42 dramatically reduces the number of membrane protrusions and decreases HIV-1 transfer at infectious synapses formed with immature DCs (17). Further, as shown in Fig. 6, HIV-induced membrane extensions in astrocytes appear to involve increases in expression of intermediate filaments. It seems plausible that the structural features unique to the different types of virological synapses are merely variations on the cellular repertoire of physiologically relevant membrane rearrangements necessary for cell-cell communication but subverted by HIV to achieve infection of target cells. A better understanding of the chemical mechanisms involved in virological synapse formation may thus provide valuable insights not only into strategies for preventing the spread of HIV/AIDS but also into some of the general principles involved in cell-cell communication.
Supplementary Material
ACKNOWLEDGMENTS
We thank Kunio Nagashima for assistance with preparation of EM blocks for imaging, Doug Schneider for technical assistance with T cell isolation, infection, and cultures, Brad Lowekamp for assistance with scripts for aligning and processing stacks of SEM images, and Alan Hoofring for assistance with figure preparation of astrocyte fluorescence images.
This work was supported by funds from the NIH IATAP program and Center for Cancer Research at the National Cancer Institute, NIH, Bethesda, MD (to S.S.), from the intramural program of the NIH, Bethesda, MD (to A.N.), from the National Cancer Institute, National Institutes of Health contract HHSN261200800001E (to J.D.L.), and from the National Science Foundation Graduate Research Fellowship Program (to T.D.).
Footnotes
Published ahead of print 25 June 2014
Supplemental material for this article may be found at http://dx.doi.org/10.1128/JVI.00788-14.
REFERENCES
- 1.Fauci AS. 2011. AIDS: let science inform policy. Science 333:13. 10.1126/science.1209751 [DOI] [PubMed] [Google Scholar]
- 2.Swanstrom R, Coffin J. 2012. HIV-1 pathogenesis: the virus. Cold Spring Harb. Perspect. Med. 2:a007443. 10.1101/cshperspect.a007443 [DOI] [PMC free article] [PubMed] [Google Scholar]
- 3.Sharova N, Swingler C, Sharkey M, Stevenson M. 2005. Macrophages archive HIV-1 virions for dissemination in trans. EMBO J. 24:2481–2489. 10.1038/sj.emboj.7600707 [DOI] [PMC free article] [PubMed] [Google Scholar]
- 4.Pelchen-Matthews A, Kramer B, Marsh M. 2003. Infectious HIV-1 assembles in late endosomes in primary macrophages. J. Cell Biol. 162:443–455. 10.1083/jcb.200304008 [DOI] [PMC free article] [PubMed] [Google Scholar]
- 5.Jolly C, Kashefi K, Hollinshead M, Sattentau QJ. 2004. HIV-1 cell to cell transfer across an Env-induced, actin-dependent synapse. J. Exp. Med. 199:283–293. 10.1084/jem.20030648 [DOI] [PMC free article] [PubMed] [Google Scholar]
- 6.Martin N, Welsch S, Jolly C, Briggs JA, Vaux D, Sattentau QJ. 2010. Virological synapse-mediated spread of human immunodeficiency virus type 1 between T cells is sensitive to entry inhibition. J. Virol. 84:3516–3527. 10.1128/JVI.02651-09 [DOI] [PMC free article] [PubMed] [Google Scholar]
- 7.Sattentau Q. 2008. Avoiding the void: cell-to-cell spread of human viruses. Nat. Rev. Microbiol. 6:815–826. 10.1038/nrmicro1972 [DOI] [PubMed] [Google Scholar]
- 8.Martin N, Sattentau Q. 2009. Cell-to-cell HIV-1 spread and its implications for immune evasion. Curr. Opin. HIV AIDS 4:143–149. 10.1097/COH.0b013e328322f94a [DOI] [PubMed] [Google Scholar]
- 9.Sourisseau M, Sol-Foulon N, Porrot F, Blanchet F, Schwartz O. 2007. Inefficient human immunodeficiency virus replication in mobile lymphocytes. J. Virol. 81:1000–1012. 10.1128/JVI.01629-06 [DOI] [PMC free article] [PubMed] [Google Scholar]
- 10.Dimitrov DS, Willey RL, Sato H, Chang LJ, Blumenthal R, Martin MA. 1993. Quantitation of human immunodeficiency virus type 1 infection kinetics. J. Virol. 67:2182–2190 [DOI] [PMC free article] [PubMed] [Google Scholar]
- 11.McDonald D, Wu L, Bohks SM, KewalRamani VN, Unutmaz D, Hope TJ. 2003. Recruitment of HIV and its receptors to dendritic cell-T cell junctions. Science 300:1295–1297. 10.1126/science.1084238 [DOI] [PubMed] [Google Scholar]
- 12.Fooksman DR, Vardhana S, Vasiliver-Shamis G, Liese J, Blair DA, Waite J, Sacristan C, Victora GD, Zanin-Zhorov A, Dustin ML. 2010. Functional anatomy of T cell activation and synapse formation. Annu. Rev. Immunol. 28:79–105. 10.1146/annurev-immunol-030409-101308 [DOI] [PMC free article] [PubMed] [Google Scholar]
- 13.Ueda H, Morphew MK, McIntosh JR, Davis MM. 2011. CD4+ T-cell synapses involve multiple distinct stages. Proc. Natl. Acad. Sci. U. S. A. 108:17099–17104. 10.1073/pnas.1113703108 [DOI] [PMC free article] [PubMed] [Google Scholar]
- 14.Jolly C, Welsch S, Michor S, Sattentau QJ. 2011. The regulated secretory pathway in CD4(+) T cells contributes to human immunodeficiency virus type-1 cell-to-cell spread at the virological synapse. PLoS Pathog. 7:e1002226. 10.1371/journal.ppat.1002226 [DOI] [PMC free article] [PubMed] [Google Scholar]
- 15.Vasiliver-Shamis G, Dustin ML, Hioe CE. 2010. HIV-1 virological synapse is not simply a copycat of the immunological synapse. Viruses 2:1239–1260. 10.3390/v2051239 [DOI] [PMC free article] [PubMed] [Google Scholar]
- 16.Felts RL, Narayan K, Estes JD, Shi D, Trubey CM, Fu J, Hartnell LM, Ruthel GT, Schneider DK, Nagashima K, Bess JW, Jr, Bavari S, Lowekamp BC, Bliss D, Lifson JD, Subramaniam S. 2010. 3D visualization of HIV transfer at the virological synapse between dendritic cells and T cells. Proc. Natl. Acad. Sci. U. S. A. 107:13336–13341. 10.1073/pnas.1003040107 [DOI] [PMC free article] [PubMed] [Google Scholar]
- 17.Nikolic DS, Lehmann M, Felts R, Garcia E, Blanchet FP, Subramaniam S, Piguet V. 2011. HIV-1 activates Cdc42 and induces membrane extensions in immature dendritic cells to facilitate cell-to-cell virus propagation. Blood 118:4841–4852. 10.1182/blood-2010-09-305417 [DOI] [PMC free article] [PubMed] [Google Scholar]
- 18.Rudnicka D, Feldmann J, Porrot F, Wietgrefe S, Guadagnini S, Prevost MC, Estaquier J, Haase AT, Sol-Foulon N, Schwartz O. 2009. Simultaneous cell-to-cell transmission of human immunodeficiency virus to multiple targets through polysynapses. J. Virol. 83:6234–6246. 10.1128/JVI.00282-09 [DOI] [PMC free article] [PubMed] [Google Scholar]
- 19.Sherer NM, Lehmann MJ, Jimenez-Soto LF, Horensavitz C, Pypaert M, Mothes W. 2007. Retroviruses can establish filopodial bridges for efficient cell-to-cell transmission. Nat. Cell Biol. 9:310–315. 10.1038/ncb1544 [DOI] [PMC free article] [PubMed] [Google Scholar]
- 20.Murooka TT, Deruaz M, Marangoni F, Vrbanac VD, Seung E, von Andrian UH, Tager AM, Luster AD, Mempel TR. 2012. HIV-infected T cells are migratory vehicles for viral dissemination. Nature 490:283–287. 10.1038/nature11398 [DOI] [PMC free article] [PubMed] [Google Scholar]
- 21.Sowinski S, Jolly C, Berninghausen O, Purbhoo MA, Chauveau A, Kohler K, Oddos S, Eissmann P, Brodsky FM, Hopkins C, Onfelt B, Sattentau Q, Davis DM. 2008. Membrane nanotubes physically connect T cells over long distances presenting a novel route for HIV-1 transmission. Nat. Cell Biol. 10:211–219. 10.1038/ncb1682 [DOI] [PubMed] [Google Scholar]
- 22.Rausch DM, Davis MR. 2001. HIV in the CNS: pathogenic relationships to systemic HIV disease and other CNS diseases. J. Neurovirol. 7:85–96. 10.1080/13550280152058744 [DOI] [PubMed] [Google Scholar]
- 23.Gonzalez-Scarano F, Martin-Garcia J. 2005. The neuropathogenesis of AIDS. Nat. Rev. Immunol. 5:69–81. 10.1038/nri1527 [DOI] [PubMed] [Google Scholar]
- 24.Spudich S, Gonzalez-Scarano F. 2012. HIV-1-related central nervous system disease: current issues in pathogenesis, diagnosis, and treatment. Cold Spring Harb. Perspect. Med. 2:a007120. 10.1101/cshperspect.a007120 [DOI] [PMC free article] [PubMed] [Google Scholar]
- 25.Antinori A, Arendt G, Becker JT, Brew BJ, Byrd DA, Cherner M, Clifford DB, Cinque P, Epstein LG, Goodkin K, Gisslen M, Grant I, Heaton RK, Joseph J, Marder K, Marra CM, McArthur JC, Nunn M, Price RW, Pulliam L, Robertson KR, Sacktor N, Valcour V, Wojna VE. 2007. Updated research nosology for HIV-associated neurocognitive disorders. Neurology 69:1789–1799. 10.1212/01.WNL.0000287431.88658.8b [DOI] [PMC free article] [PubMed] [Google Scholar]
- 26.Heaton RK, Franklin DR, Ellis RJ, McCutchan JA, Letendre SL, Leblanc S, Corkran SH, Duarte NA, Clifford DB, Woods SP, Collier AC, Marra CM, Morgello S, Mindt MR, Taylor MJ, Marcotte TD, Atkinson JH, Wolfson T, Gelman BB, McArthur JC, Simpson DM, Abramson I, Gamst A, Fennema-Notestine C, Jernigan TL, Wong J, Grant I. 2011. HIV-associated neurocognitive disorders before and during the era of combination antiretroviral therapy: differences in rates, nature, and predictors. J. Neurovirol. 17:3–16. 10.1007/s13365-010-0006-1 [DOI] [PMC free article] [PubMed] [Google Scholar]
- 27.Gongvatana A, Harezlak J, Buchthal S, Daar E, Schifitto G, Campbell T, Taylor M, Singer E, Algers J, Zhong J, Brown M, McMahon D, So YT, Mi D, Heaton R, Robertson K, Yiannoutsos C, Cohen RA, Navia B. 2013. Progressive cerebral injury in the setting of chronic HIV infection and antiretroviral therapy. J. Neurovirol. 19:209–218. 10.1007/s13365-013-0162-1 [DOI] [PMC free article] [PubMed] [Google Scholar]
- 28.An SF, Groves M, Gray F, Scaravilli F. 1999. Early entry and widespread cellular involvement of HIV-1 DNA in brains of HIV-1 positive asymptomatic individuals. J. Neuropathol. Exp. Neurol. 58:1156–1162. 10.1097/00005072-199911000-00005 [DOI] [PubMed] [Google Scholar]
- 29.Williams KC, Hickey WF. 1996. Traffic of lymphocytes into the CNS during inflammation and HIV infection. J. NeuroAIDS 1:31–55 [DOI] [PubMed] [Google Scholar]
- 30.Kim WK, Corey S, Alvarez X, Williams K. 2003. Monocyte/macrophage traffic in HIV and SIV encephalitis. J. Leukoc. Biol. 74:650–656. 10.1189/jlb.0503207 [DOI] [PubMed] [Google Scholar]
- 31.Johnson TP, Patel K, Johnson KR, Maric D, Calabresi PA, Hasbun R, Nath A. 2013. Induction of IL-17 and nonclassical T-cell activation by HIV-Tat protein. Proc. Natl. Acad. Sci. U. S. A. 110:13588–13593. 10.1073/pnas.1308673110 [DOI] [PMC free article] [PubMed] [Google Scholar]
- 32.Murphy GE, Narayan K, Lowekamp BC, Hartnell LM, Heymann JA, Fu J, Subramaniam S. 2011. Correlative 3D imaging of whole mammalian cells with light and electron microscopy. J. Struct. Biol. 176:268–278. 10.1016/j.jsb.2011.08.013 [DOI] [PMC free article] [PubMed] [Google Scholar]
- 33.Bennett AE, Narayan K, Shi D, Hartnell LM, Gousset K, He H, Lowekamp BC, Yoo TS, Bliss D, Freed EO, Subramaniam S. 2009. Ion-abrasion scanning electron microscopy reveals surface-connected tubular conduits in HIV-infected macrophages. PLoS Pathog. 5:e1000591. 10.1371/journal.ppat.1000591 [DOI] [PMC free article] [PubMed] [Google Scholar]
- 34.Heymann JA, Hayles M, Gestmann I, Giannuzzi LA, Lich B, Subramaniam S. 2006. Site-specific 3D imaging of cells and tissues with a dual beam microscope. J. Struct. Biol. 155:63–73. 10.1016/j.jsb.2006.03.006 [DOI] [PMC free article] [PubMed] [Google Scholar]
- 35.Heymann JA, Shi D, Kim S, Bliss D, Milne JL, Subramaniam S. 2009. 3D imaging of mammalian cells with ion-abrasion scanning electron microscopy. J. Struct. Biol. 166:1–7. 10.1016/j.jsb.2008.11.005 [DOI] [PMC free article] [PubMed] [Google Scholar]
- 36.Nath A, Hartloper V, Furer M, Fowke KR. 1995. Infection of human fetal astrocytes with HIV-1: viral tropism and the role of cell to cell contact in viral transmission. J. Neuropathol. Exp. Neurol. 54:320–330. 10.1097/00005072-199505000-00005 [DOI] [PubMed] [Google Scholar]
- 37.Buckman JS, Bosche WJ, Gorelick RJ. 2003. Human immunodeficiency virus type 1 nucleocapsid zn(2+) fingers are required for efficient reverse transcription, initial integration processes, and protection of newly synthesized viral DNA. J. Virol. 77:1469–1480. 10.1128/JVI.77.2.1469-1480.2003 [DOI] [PMC free article] [PubMed] [Google Scholar]
- 38.Thomas JA, Gagliardi TD, Alvord WG, Lubomirski M, Bosche WJ, Gorelick RJ. 2006. Human immunodeficiency virus type 1 nucleocapsid zinc-finger mutations cause defects in reverse transcription and integration. Virology 353:41–51. 10.1016/j.virol.2006.05.014 [DOI] [PubMed] [Google Scholar]
- 39.Popovic M, Sarngadharan MG, Read E, Gallo RC. 1984. Detection, isolation, and continuous production of cytopathic retroviruses (HTLV-III) from patients with AIDS and pre-AIDS. Science 224:497–500. 10.1126/science.6200935 [DOI] [PubMed] [Google Scholar]
- 40.Kutsch O, Benveniste EN, Shaw GM, Levy DN. 2002. Direct and quantitative single-cell analysis of human immunodeficiency virus type 1 reactivation from latency. J. Virol. 76:8776–8786. 10.1128/JVI.76.17.8776-8786.2002 [DOI] [PMC free article] [PubMed] [Google Scholar]
- 41.Levy DN, Aldrovandi GM, Kutsch O, Shaw GM. 2004. Dynamics of HIV-1 recombination in its natural target cells. Proc. Natl. Acad. Sci. U. S. A. 101:4204–4209. 10.1073/pnas.0306764101 [DOI] [PMC free article] [PubMed] [Google Scholar]
- 42.Narayan K, Danielson CM, Lagarec K, Lowekamp BC, Coffman P, Laquerre A, Phaneuf MW, Hope TJ, Subramaniam S. 2014. Multi-resolution correlative focused ion beam scanning electron microscopy: applications to cell biology. J. Struct. Biol. 185:278–284. 10.1016/j.jsb.2013.11.008 [DOI] [PMC free article] [PubMed] [Google Scholar]
- 43.Fedorov A, Beichel R, Kalpathy-Cramer J, Finet J, Fillion-Robin JC, Pujol S, Bauer C, Jennings D, Fennessy F, Sonka M, Buatti J, Aylward S, Miller JV, Pieper S, Kikinis R. 2012. 3D slicer as an image computing platform for the Quantitative Imaging Network. Magn. Reson. Imaging 30:1323–1341. 10.1016/j.mri.2012.05.001 [DOI] [PMC free article] [PubMed] [Google Scholar]
- 44.Wierda RJ, Kuipers HF, van Eggermond MC, Benard A, van Leeuwen JC, Carluccio S, Geutskens SB, Jukema JW, Marquez VE, Quax PH, van den Elsen PJ. 2012. Epigenetic control of CCR5 transcript levels in immune cells and modulation by small molecules inhibitors. J. Cell. Mol. Med. 16:1866–1877. 10.1111/j.1582-4934.2011.01482.x [DOI] [PMC free article] [PubMed] [Google Scholar]
- 45.Jolly C, Sattentau QJ. 2005. Human immunodeficiency virus type 1 virological synapse formation in T cells requires lipid raft integrity. J. Virol. 79:12088–12094. 10.1128/JVI.79.18.12088-12094.2005 [DOI] [PMC free article] [PubMed] [Google Scholar]
- 46.Carroll-Anzinger D, Al-Harthi L. 2006. Gamma interferon primes productive human immunodeficiency virus infection in astrocytes. J. Virol. 80:541–544. 10.1128/JVI.80.1.541-544.2006 [DOI] [PMC free article] [PubMed] [Google Scholar]
- 47.Churchill M, Nath A. 2013. Where does HIV hide? A focus on the central nervous system. Curr. Opin. HIV AIDS 8:165–169. 10.1097/COH.0b013e32835fc601 [DOI] [PMC free article] [PubMed] [Google Scholar]
- 48.Brahmachari S, Fung YK, Pahan K. 2006. Induction of glial fibrillary acidic protein expression in astrocytes by nitric oxide. J. Neurosci. 26:4930–4939. 10.1523/JNEUROSCI.5480-05.2006 [DOI] [PMC free article] [PubMed] [Google Scholar]
- 49.Pekny M, Wilhelmsson U, Bogestal YR, Pekna M. 2007. The role of astrocytes and complement system in neural plasticity. Int. Rev. Neurobiol. 82:95–111. 10.1016/S0074-7742(07)82005-8 [DOI] [PubMed] [Google Scholar]
- 50.Aggarwal A, Iemma TL, Shih I, Newsome TP, McAllery S, Cunningham AL, Turville SG. 2012. Mobilization of HIV spread by diaphanous 2 dependent filopodia in infected dendritic cells. PLoS Pathog. 8:e1002762. 10.1371/journal.ppat.1002762 [DOI] [PMC free article] [PubMed] [Google Scholar]
- 51.Smith JL, Lidke DS, Ozbun MA. 2008. Virus activated filopodia promote human papillomavirus type 31 uptake from the extracellular matrix. Virology 381:16–21. 10.1016/j.virol.2008.08.040 [DOI] [PMC free article] [PubMed] [Google Scholar]
- 52.Schelhaas M, Ewers H, Rajamaki ML, Day PM, Schiller JT, Helenius A. 2008. Human papillomavirus type 16 entry: retrograde cell surface transport along actin-rich protrusions. PLoS Path. 4:e1000148. 10.1371/journal.ppat.1000148 [DOI] [PMC free article] [PubMed] [Google Scholar]
- 53.Lehmann MJ, Sherer NM, Marks CB, Pypaert M, Mothes W. 2005. Actin- and myosin-driven movement of viruses along filopodia precedes their entry into cells. J. Cell Biol. 170:317–325. 10.1083/jcb.200503059 [DOI] [PMC free article] [PubMed] [Google Scholar]
- 54.Jolly C, Sattentau QJ. 2004. Retroviral spread by induction of virological synapses. Traffic 5:643–650. 10.1111/j.1600-0854.2004.00209.x [DOI] [PubMed] [Google Scholar]
- 55.Hubner W, McNerney GP, Chen P, Dale BM, Gordon RE, Chuang FY, Li XD, Asmuth DM, Huser T, Chen BK. 2009. Quantitative 3D video microscopy of HIV transfer across T cell virological synapses. Science 323:1743–1747. 10.1126/science.1167525 [DOI] [PMC free article] [PubMed] [Google Scholar]
- 56.Majorovits E, Nejmeddine M, Tanaka Y, Taylor GP, Fuller SD, Bangham CR. 2008. Human T-lymphotropic virus-1 visualized at the virological synapse by electron tomography. PLoS One 3:e2251. 10.1371/journal.pone.0002251 [DOI] [PMC free article] [PubMed] [Google Scholar]
- 57.Klasse PJ. 2012. The molecular basis of HIV entry. Cell. Microbiol. 14:1183–1192. 10.1111/j.1462-5822.2012.01812.x [DOI] [PMC free article] [PubMed] [Google Scholar]
- 58.Weissman D, Rabin RL, Arthos J, Rubbert A, Dybul M, Swofford R, Venkatesan S, Farber JM, Fauci AS. 1997. Macrophage-tropic HIV and SIV envelope proteins induce a signal through the CCR5 chemokine receptor. Nature 389:981–985. 10.1038/40173 [DOI] [PubMed] [Google Scholar]
- 59.Venneti S, Bonneh-Barkay D, Lopresti BJ, Bissel SJ, Wang G, Mathis CA, Piatak M, Jr, Lifson JD, Nyaundi JO, Murphey-Corb M, Wiley CA. 2008. Longitudinal in vivo positron emission tomography imaging of infected and activated brain macrophages in a macaque model of human immunodeficiency virus encephalitis correlates with central and peripheral markers of encephalitis and areas of synaptic degeneration. Am. J. Pathol. 172:1603–1616. 10.2353/ajpath.2008.070967 [DOI] [PMC free article] [PubMed] [Google Scholar]
- 60.Cline AN, Bess JW, Piatak M, Jr, Lifson JD. 2005. Highly sensitive SIV plasma viral load assay: practical considerations, realistic performance expectations, and application to reverse engineering of vaccines for AIDS. J. Med. Primatol. 34:303–312. 10.1111/j.1600-0684.2005.00128.x [DOI] [PubMed] [Google Scholar]
Associated Data
This section collects any data citations, data availability statements, or supplementary materials included in this article.