

Abstract
The aim of this study was to characterize multiexponential T2 (MET2) relaxation in a rat C6 glioblastoma tumor model. To do this, rats (n = 11) were inoculated with the C6 cells via stereotaxic injection into the brain. Ten days later, MET2 measurements were performed in vivo using a single-slice, multi-echo spin-echo sequence at 7.0 T. Tumor signal was biexponential in eight animals with a short-lived T2 component (T2 = 20.7 ± 5.4 ms across samples) representing 6.8 ± 6.2 % of the total signal and a long-lived T2 component (T2 = 76.4 ± 9.3 ms) representing the remaining signal fraction. In contrast, signal from contralateral grey matter was consistently monoexponential (T2 = 48.8 ± 2.3 ms). Additional ex vivo studies (n = 3) and Monte Carlo simulations showed that the in vivo results were not significantly corrupted by partial volume averaging or noise. The underlying physiological origin of the observed MET2 components is unknown; however, MET2 analysis may hold promise as a non-invasive tool for characterizing tumor microenvironment in vivo on a sub-voxel scale.
Keywords: MRI, multiexponential T2, relaxometry, brain, tumor
INTRODUCTION
The nuclear magnetic resonance (NMR) signal has been shown to exhibit multiexponential T2 (MET2) decay in a number of tissues (e.g., white matter (1,2), peripheral nerve (3,4), skeletal muscle (5)), arising from a combination of microanatomical water compartition (e.g., intracellular and extracellular water) and slow intercompartmental exchange. The goal of MET2 analysis is to decompose bulk NMR signal into components that represent underlying tissue compartments. In doing so, one can probe individual tissue compartments that exist on a sub-voxel scale.
Given the heterogeneous nature of tumors, one might expect to observe MET2 relaxation in tumors. In fact, MET2 relaxation has been observed in animal models (both in vivo (6) and ex vivo (7)), surgical samples ex vivo (8,9), and in humans in vivo (10), though results have been inconsistent. This inconsistency is presumably a product of differences in tumor types, models, and staging as well as differences in the data acquisition and analysis techniques used. Of these previous studies, only one (10) attempted to characterize MET2 relaxation in tumors using an imaging approach (others used non-imaging CPMG (11,12) approaches). In that particular study, T2 measurements were made in human gliomas and the resultant signal was found to decay biexponentially; however, as the authors note, these results should be interpreted carefully due to the low signal-to-noise ratio (SNR) of the data.
The goal of this study was to characterize MET2 relaxation in a rat glioblastoma tumor model. Towards this end, we performed Monte Carlo simulations as well as in vivo and ex vivo imaging experiments. The simulations were designed to see if the experimental imaging data achieved the appropriate SNR to perform region of interest (ROI) and/or voxel-based analyses. The in vivo data were acquired to characterize MET2 relaxation in a commonly used tumor model, while the ex vivo measurements were acquired to ensure that the in vivo results were not significantly corrupted due to either partial-voluming or low SNR.
EXPERIMENTAL
Simulations
Monte Carlo simulations were performed to determine the SNR requirements for MET2 analysis of tumor signal. MET2 decay curves, yi were generated according to
| [1] |
where sj is the weight of the exponential component associated with T2,j, NE is the total number of echoes, ti is the echo time (TE) of the ith echo, and εi is Gaussian noise added to the ith echo.
Two sets of simulations were generated using Eq. [1] and the mean experimental values listed in Table 1. The first set was designed to simulate the biexponential decay observed in vivo (see Table 2), while the second set was designed to simulate the triexponential decay observed ex vivo (see Table 3). The decay curve sampling for each set was designed to match its corresponding decay curve sampling during experimental studies. Within each set, decay curves were generated with SNR values logarithmically spaced between 100 and 3200, where SNR is defined as the magnitude of the first echo divided by the standard deviation of the Gaussian noise. For a given SNR, 2000 decay curves (each with a unique noise realization) were generated and the bias introduced by the magnitude operation, which converts the underlying Gaussian noise to Rician, was removed (see Data Analysis for more details) (13). MET2 analysis was then performed to determine the distribution of T2s (i.e., the T2 spectrum) in the simulated data. This was done by minimizing
Table 1.
Parameters for simulated decay curves (Eq. [1]) where sj is the weight of the exponential component associated with T2,j, NE is the total number of echoes, and Δt is the inter-echo spacing. In vivo: Biexponential decay curves were generated using the mean component values listed in Table 2 (Components I and II) and the same echo sampling parameters used for in vivo measurements. Ex vivo: Triexponential decay curves were generated using the mean component values listed in Table 3 (Components I, I, and III) and the same echo sampling parameters used for ex vivo measurements.
| Simulation | s1 | s2 | s3 | T2,1 (ms) | T2,2 (ms) | T2,3 (ms) | Δt (ms) | NE |
|---|---|---|---|---|---|---|---|---|
|
|
|
|
|
|||||
| In vivo | 0.07 | 0.93 | - | 21 | 76 | - | 8 | 32 |
| Ex vivo | 0.08 | 0.80 | 0.12 | 38 | 110 | 263 | 15 | 40 |
Table 2.
In vivo ROI-based MET2 results for tumor and normal ROIs (as defined in Fig. 1). Component relaxation times (T̄2,n) and signal fractions (pn) were tabulated for each animal using the spectra shown in Fig. 3 (panels c and d). The day post inoculation (DPI) each imaging study was performed is also given for each rat.
| Rat
|
DPI | Tumor
|
Normal
|
||||
|---|---|---|---|---|---|---|---|
| # | I
|
II
|
p (%) | T̄2 (ms) | |||
| pI (%) | T̄2,I (ms) | pII (%) | T̄2,II (ms) | ||||
| 1 | 14 | 4.5 | 25.5 | 95.5 | 68.1 | 100 | 50.7 |
| 2 | 15 | 4.6 | 21.2 | 95.4 | 85.6 | 100 | 44.6 |
| 3 | 16 | 21.2 | 28.1 | 78.8 | 80.1 | 100 | 49.2 |
| 4 | 14 | 3.0 | 14.5 | 97.0 | 67.4 | 100 | 50.3 |
| 5 | 14 | 8.5 | 24.3 | 91.5 | 70.2 | 100 | 49.6 |
| 6* | 14 | 0 | - | 100 | 83.5 | 100 | 48.3 |
| 7* | 18 | 0 | - | 100 | 80.8 | 96.8 | 50.1 |
| 8 | 18 | 2.0 | 12.6 | 98.0 | 66.2 | 100 | 49.6 |
| 9 | 21 | 3.7 | 21.9 | 96.3 | 85.3 | 100 | 49.8 |
| 10 | 18 | 7.2 | 17.7 | 92.8 | 88.2 | 96.8 | 50.1 |
| 11* | 18 | 0 | - | 100 | 57.2 | 100 | 44.2 |
|
| |||||||
| Mean | 16.4±2.4 | 6.8±6.2 | 20.7±5.4 | 93.2±6.2 | 76.4±9.3 | 99.4±1.3 | 48.8±2.3 |
Indicates animals whose tumor T2 spectra exhibited a single peak (n.b., these three animals exhibited relatively small tumors). As a result, spectra from these animals are not given in Fig. 3. For these animals, component values for the single observed peak are given in the long-lived component columns and these values were ignored in calculating the mean component values across animals for tumor results.
Table 3.
Ex vivo ROI-based MET2 results for tumor and normal ROIs (as defined in Fig. 1). Component relaxation times (T̄2,n) and signal fractions (pn) were tabulated for each animal using the spectra shown in Fig. 3 (panels e and f).
| Rat
|
Tumor
|
Normal
|
||||||
|---|---|---|---|---|---|---|---|---|
| I
|
II
|
III
|
||||||
| # | pI (%) | T̄2,I (ms) | pII (%) | T̄2,II (ms) | pIII (%) | T̄2,III (ms) | p (%) | T̄2 (ms) |
| 9 | 2.8 | 40.7 | 71.9 | 125.9 | 25.3 | 215.8 | 93.6 | 60.6 |
| 10 | 15.1 | 42.3 | 81.9 | 101.3 | 3.0 | 304.6 | 89.4 | 48.3 |
| 11 | 5.5 | 30.4 | 88.1 | 101.2 | 6.4 | 267.5 | 100 | 44.7 |
|
| ||||||||
| Mean | 7.8±6.5 | 37.8±6.5 | 80.6±8.2 | 109.5±14.2 | 11.6±12.0 | 262.6±44.6 | 94.4±5.3 | 51.2±8.4 |
| [2] |
in a non-negative least-squares (NNLS) (14) sense using J = 100 logarithmically spaced relaxation times over the interval t1/2 <T2,j < 2tNE. The first term in Eq. [2] minimizes data misfit, while the second term regularizes the solution by imposing a minimum curvature constraint (15), which smoothes the resultant spectrum according to the magnitude of the regularizer term, μ. For this study, the value of μ was determined in a two-step process. First, μ was iteratively updated to determine the value that increased the χ2 misfit by 2% relative to the unregularized fit (μ = 0) for each unique decay curve (16). Second, the median μ across data with the same SNR was determined, and was subsequently used in a final regularized fit so that all T2 spectra from data with the same SNR were smoothed to the same degree.
Each spectral peak, n, and its corresponding range of relaxation times T2,n, min <T2,j <T2,n,max, was identified using an automated peak- and valley-finding algorithm (based upon locating zero-crossings of the first-derivative of the spectrum). For all non-spurious components (defined here as any peak that was consistently observed and represented more than 1% the total signal), relaxation times and signal fractions were then calculated from
| [3] |
and
| [4] |
respectively. Spectra were deemed admissible if the expected components (two for in vivo and three for ex vivo simulations, respectively) were resolved. The percentage of admissible spectra, or admissibility, was then calculated for each SNR value to determine the SNR requirements for MET2 analysis.
Animal Preparation
All procedures were approved by our Institution’s Animal Care and Usage Committee. Male Wistar rats (n = 11) were immobilized and anesthesia was induced and maintained with a 2%/98% isofluorane/oxygen mixture (Minrad Inc., Bethlehem, PA). Rats were then inoculated with 1 × 10⁵ C6 gliosarcoma cells using a 10-μL gastight syringe approximately one mm anterior and two mm lateral to bregma on the right side of the head, at a depth of three mm relative to the dural surface. C6 is a common glioblastoma model that is widely used in experimental neuro-oncology to evaluate tumor growth, invasion, migration, and blood-brain-barrier disruptions, and has been used extensively to investigate the efficacy of various therapies including chemotherapy and radiation therapy (17). In vivo MRI was performed 14 to 21 days (see Table 2 for details) after this procedure.
After in vivo imaging, a transcardial perfusion was performed in three of the eleven animals described above. During this procedure, animals were immobilized and anesthesia was induced and maintained with a 2%/98% isofluorane/oxygen mixture. A 23-g needle was inserted into the left ventricle of the heart and phosphate-buffered saline (PBS; Mediatech Inc., Herdon, VA) was perfused to flush the blood out of the vascular system, at which point the perfusate was changed to 10% neutral buffered formalin (VWR, West Chester, PA). Following perfusion, brains were extracted and stored in 10% neutral buffered formalin overnight. Brains were then stored in PBS (to remove excess fixative) until ex vivo MRI was performed.
In vivo Magnetic Resonance
Rats (n = 11) were imaged using a 7.0-T, 16-cm bore Varian INOVA spectrometer (Varian Inc., Palo Alto, CA). A 63-mm inner diameter quadrature volume coil was used for RF transmission and reception. During imaging, animals were anesthetized with a 2%/98% isofluorane/oxygen mixture and temperature was maintained at 37 °C with a rectal thermometer and warm-air feedback system. Respiratory signals were also monitored using a small pneumatic pillow placed near the rat’s abdomen (SA Instruments, Stony Brook, NY).
For each rat, a single 1.5-mm axial slice through the center of the tumor volume was first selected from T2-weighted scout images. T2 measurements were then made using a single-slice, multi-echo spin-echo sequence (18) with an echo spacing (ΔTE) = 8 ms, TR = 4 s, number of echoes (NE) = 32, field of view = 35 × 35 mm2, acquisition matrix = 64 × 64, in-plane resolution = 547 × 547 μm2, acquisition bandwidth = 50 kHz, number of averages (NEX) = 8, and total imaging time ≈ 34 minutes. Spoiler gradients were placed about each 90x180y90x broadband composite refocusing pulse (19) in an alternating and descending fashion (18) in order to remove signal from unwanted coherence pathways. The spoiler gradients were calculated so as to cause a minimum phase dispersion of π/2 across one slice thickness, which was found to be sufficiently large to remove these unwanted signal components.
Ex vivo Magnetic Resonance
Excised brains (n = 3) were imaged at bore temperature (≈ 20 °C) using a 7.0-T, 16-cm bore Varian INOVA spectrometer and 38-mm diameter Litz RF coil (Doty Scientific, Columbia, SC). For imaging, brains were placed in a custom-built holder and bathed in fresh PBS. To minimize air bubbles, both the brain and holder were fully immersed in PBS while loading the brain into the holder.
A single 1-mm axial slice through the center of the tumor volume (representing approximately the same slice acquired in vivo) was first selected from T2-weighted scout images (Fig. 1b). Imaging was then performed using the same multiple-spin echo sequence as described for in vivo imaging, but at higher resolution and SNR. Relevant parameters for ex vivo T2 measurements included ΔTE = 15 ms, TR = 4 s, NE = 40, field of view = 19.2 × 19.2 mm2, acquisition matrix = 64 × 64, in-plane resolution = 300 × 300 μm2, acquisition bandwidth = 40 kHz, NEX = 64, and total imaging time ≈4 ½ hours. Note the echo spacing used for ex vivo acquisitions (15 ms) was longer than for in vivo acquisitions (8 ms). This was to ensure that the decay curve was adequately sampled ex vivo because: 1) the observed relaxation times ex vivo were generally longer than corresponding relaxation times in vivo and 2) an additional long-lived component was observed ex vivo (see Results).
Figure 1.
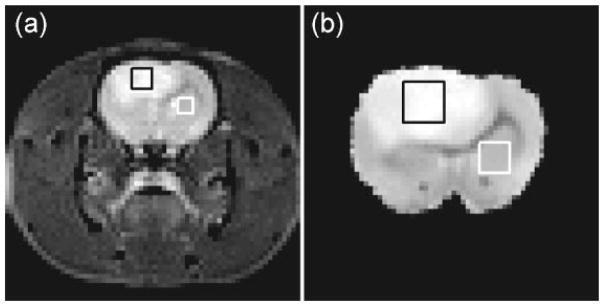
(a) Representative T2-weighted images acquired in vivo (TE = 40 ms) along with representative ROIs for tumor (black box) and normal (contralateral subcortical grey matter, white box) tissue. (b) Corresponding ex vivo image (TE = 30 ms) from the same animal (Rat #10).
Data Analysis
All data analysis was performed using routines written in-house in MATLAB (Mathworks, Natick, MA). For ROI-based analysis, tumor and contralateral subcortical grey matter ROIs were defined from T2-weighted scout images (as shown in Fig. 1). Tumor ROIs were defined to encompass as much of the tumor as possible, while avoiding the tumor margin where significant partial-voluming of tumor and normal tissue may occur. Once defined, the maximum-likelihood estimator of each Rician-distributed ROI value was determined (20). This approach has been shown to minimize bias introduced by the Rician noise present in magnitude MR images, especially for those images acquired with low SNR (i.e., at longer echo times). Data were then fitted to Eq. [2] in the same manner described for simulated data. For these fits, the regularizer parameter, μ, was iteratively updated to determine the value that increased the χ2 misfit by 2% relative to the unregularized fit for each individual ROI. The median μ across samples – 0.15 and 0.01 for in vivo and ex vivo data, respectively – was then determined and used in a final regularized fit. Component relaxation times and signal fractions were calculated for each non-spurious component in the resultant T2 spectra from Eqs. [3] and [4], respectively.
Simulations showed (see Results for details) that the SNR per voxel was insufficient to perform voxel-based MET2 analysis. Therefore, to increase SNR, in vivo and ex vivo images were spatially filtered by applying a multichannel (with each echo representing a different channel) anisotropic diffusion filter (21) prior to voxel-based MET2 analysis. This approach has been previously applied to MET2 analysis (22) and has been shown to reduce variability with minimal introduction of bias due to partial-voluming. Filtered data were then fitted to Eq. [2] with μ = 0.07 and 0.01 for in vivo and ex vivo data, respectively (determined using an analogous approach to that used for ROI-based analyses) in order to determine the T2 spectrum of each individual voxel and component relaxation times (Eq. [3]) and signal fractions (Eq. [4]) were calculated.
All values are given as mean (± SD) across samples unless otherwise reported.
RESULTS
Simulations
Fig. 2a displays the admissibility of MET2 analysis for in vivo and ex vivo simulated data as a function of SNR. For ex vivo data, the admissibility for resolving all three observed components as well as resolving the short-lived component from the two longer-lived components was determined. Once again, simulated data were generated using Eq. [1] along with the parameters listed in Table 1.
Figure 2.
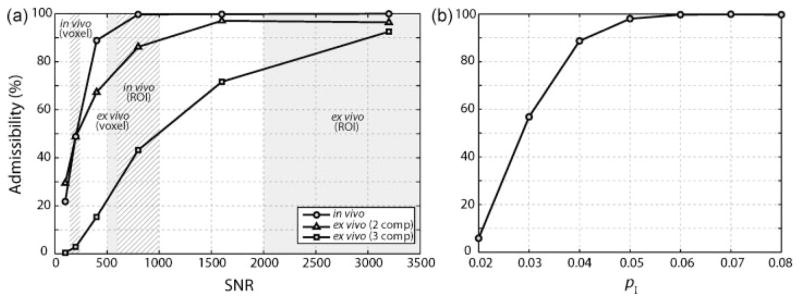
(a) Admissibility as a function of SNR for simulated in vivo and ex vivo tumor MET2 data (using Eq. [1] and the parameters listed in Table 1). For ex vivo data, the admissibility for resolving all three observed components (3 comp) as well as resolving the short-lived component from the two longer-lived components (2 comp) was tabulated. The approximate range of experimental SNRs for voxel- and ROI-based analyses in vivo (hatched boxes) and ex vivo (grey boxes) is also indicated. (b) Admissibility as a function of pI for simulated in vivo data (SNR = 800).
Assuming a minimum admissibility threshold of 90%, an SNR of approximately 500 is required for in vivo acquisition with two components. The SNR for tumor ROIs was 839 ± 381 (and 649 ± 211 for grey matter ROIs), while the SNR per voxel was 193 ± 61. Based upon the simulations shown in Fig. 2a, this SNR is sufficient to perform ROI-based MET2 analysis in vivo; however, SNR is insufficient to perform voxel-based MET2 analysis (with an admissibility of ≈ 50%). As a result, spatial smoothing with an anisotropic diffusion filter (as described in Methods) was used to increase SNR for voxel-based MET2 analysis in vivo.
Again assuming a minimum admissibility threshold of 90%, an SNR of approximately 3000 is required to resolve all three components from the ex vivo data. The SNR for tumor ROIs was 3989 ± 2265 (and 2335 ± 344 for grey matter ROIs), while the SNR per voxel was 557 ± 28. Therefore, from Fig. 2 it can be seen that the SNR is sufficient to perform ROI-based MET2 analysis and insufficient to perform voxel-based MET2 analysis ex vivo. As a result, spatial smoothing with an anisotropic filter was also used to increase SNR for voxel-based MET2 analysis ex vivo. Additional simulations showed that an SNR of approximately 1000 is required to resolve the short-lived component (component I) from the two longer-lived components (components II and III) in the ex vivo data. Thus, for comparison to the two-component in vivo spectra, ex vivo spectra that exhibited either two or three components were deemed admissible for voxel-based analysis.
An additional set of simulations was performed to assess the effect of the size of the short-lived component (pI) on admissibility. Sets of two component data were generated over a range of pI values using the same relaxation times and data sampling parameters as the in vivo simulations and an SNR of 800 (similar to ROI-based analysis in vivo). As seen in Fig, 2b, admissibility was found to increase with increasing size of the short-lived component. Using the same minimum admissibility threshold of 90% as above, these simulations suggest that we should consistently observe MET2 relaxation when the size of the short-lived component is greater than approximately 4% of the total signal.
In vivo Magnetic Resonance
Fig. 3 displays the results of the ROI-based MET2 analysis in vivo. Fig. 3a and 3b show sample T2 decay curves from normal and tumor ROIs and corresponding monoexponential fits (Eq. [2] with J = 1). It can be seen that signal from tumor ROIs showed a larger deviation from a monoexponential model than signal from normal grey matter, suggesting a multiexponential model may be more appropriate for tumor signal. The MET2 results (Fig. 3c and 3d) from normal and tumor ROIs support this. For tumor ROIs, eight of eleven animals exhibited T2 spectra with two components: I) a short-lived component (T̄2,I = 20.7 ± 5.4 ms) representing 6.8 ± 6.2% of the signal and II) a long-lived component (T̄2,II = 76.4 ± 9.3 ms) representing the remaining 93.2 ± 6.2%. In contrast, 99.4 ± 1.3% of the total signal could be described by a single component (T̄2 = 48.8 ± 2.3 ms) for normal grey matter, which is consistent with previous findings (2,23). The relaxation times (T̄2,n) and signal fractions (pn) for each individual animal measured in vivo are detailed in Table 2.
Figure 3.

(a and b) Sample decay curves from normal and tumor tissue ROIs in vivo. Data were fitted using multiexponential (grey solid line; Eq. [2] with J=100) and monoexponential (black dashed line; Eq. [2] with J=1 and μ=0) models. Note that tumor signal deviates from the monoexponential model fit, especially at shorter echo times as shown in the zoomed insets. (c and d) T2 spectra from in vivo measurements for individual animals (gray) as well as the mean spectrum across animals (black). Two components (I and II) were observed in tumor signal in eight of the eleven rats in vivo (only spectra from these eight rats are given here), while signal from normal tissue was consistently monoexponential. (e and f) T2 spectra from ex vivo measurements. Three components (I, II, and III) were in observed in tumor signal in all three rats. Once again, normal tissue was consistently monoexponential. Note, the small peaks to the far left of these spectra were deemed artifacts of the fitting process and were ignored in subsequent analysis. Component values for each rat are listed in Tables 2 and 3 for in vivo and ex vivo measurements, respectively.
Recall, images were smoothed with an anisotropic diffusion filter prior to voxel-based MET2 analysis. Fig. 4 displays the effects of this spatial smoothing on representative mean spectral T2, <T̄2> (calculated using Eq. 3 over the entire spectral range, t1/2 <T2,j < 2tNE), and pI maps. The <T̄2> maps in Fig. 4a and 4b illustrate the location of the tumor, which has a much longer <T̄2> than surrounding tissue. The pI maps in Fig. 4c and 4d illustrate that the anisotropic spatial smoothing employed results in decreased variability for MET2 results with minimal introduction of patial-voluming between tumor and normal tissue (though some information about tumor heterogeneity is likely lost after smoothing with this approach). Note, only results for voxels deemed admissible — defined here as voxels with spectra that exhibited two components in the range 8–200 ms — are shown. Additional contributions from white matter, which exhibited two components in this range consistent with previous findings (1,2), were removed. These contributions were removed based upon the fact that the long-lived component in white matter has a T2 ≈ 50 ms (similar to the single component observed in grey matter shown in Fig. 3d), while the long-lived component in tumor tissue exhibited a T2 ≈ 75 ms (Component II in Fig. 3c). Thus, only spectra whose long-lived component exhibited a T2 > 60 ms are displayed in Fig. 4c and 4d (and in the pI maps in Fig. 5).
Figure 4.

<T̄2> (a and b) and pI (c and d) maps calculated from raw and filtered images overlaid onto an anatomical image from one animal (Rat #3). For pI, only voxels whose T2 spectra were deemed admissible — defined as spectra that exhibited two components in the range 8–200 ms — are shown. Additional contributions from white matter were also removed (see Methods). Observe that there exists significant intra-tumoral heterogeneity.
Figure 5.
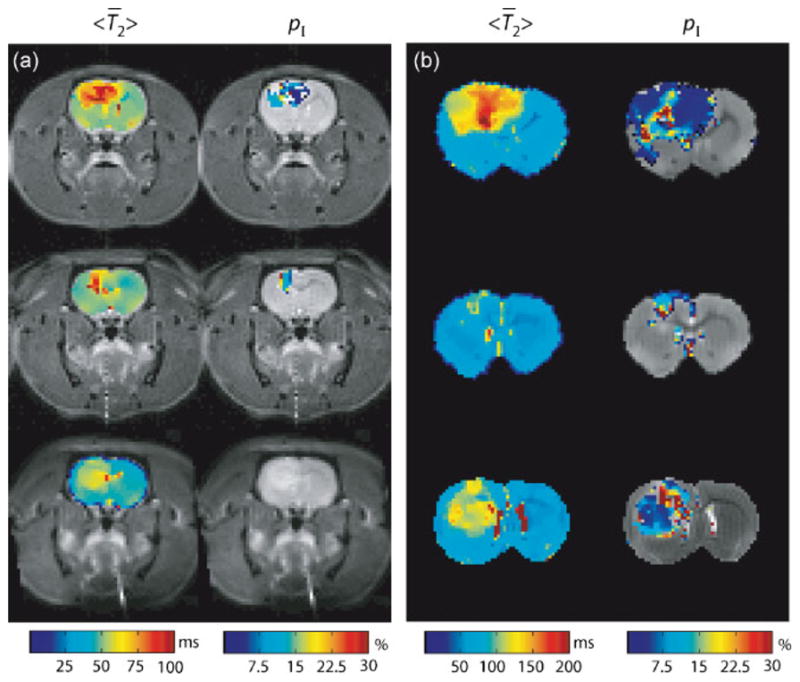
(a) In vivo <T̄2> and pI maps overlaid onto anatomical images (Rats #9–11). (b) Corresponding ex vivo results from the same three rats. For pI, only voxels whose T2 spectra were deemed admissible — defined as spectra that exhibited two components in the range 8–200 ms or 15–300 ms for in vivo and ex vivo acquisition, respectively — are shown. Additional contributions from white matter were also removed (see Methods).
Additional representative <T̄2> and pI maps acquired in vivo are displayed in Fig. 5a (Rats #9–11). Note that tumor voxels consistently exhibited biexponential decay, while normal grey matter voxels did not, which is consistent with the ROI-based results shown in Fig. 3. Mean ROI component values for the voxel-based MET2 results are summarized in Table 4 for all eleven animals. Only voxels deemed admissible within each ROI were used for these calculations. These results suggest that voxel-based MET2 analysis might be possible in vivo because: 1) the voxel-based results (Table 4) were similar to those obtained from ROI-based analysis (Table 2) for most animals and 2) 86.1 ± 22.0% percent of voxels were deemed admissible. It should be noted that the ROI-based tumor signal was monoexponential in Rats #6 and 7, while the voxel-based signal was multiexponential (for 30.0 and 69.2 % of the voxels, respectively). This discrepancy can most likely be explained by partial-voluming of normal and tumor tissue within the chosen tumor ROIs.
Table 4.
Voxel-based MET2 results acquired in vivo (Rats #1–11) and ex vivo (Rats #9–11). For each rat, mean (± SD) ROI component relaxation times (T̄2n) and signal fractions (pn) were tabulated using voxel-based MET2 analysis. Only voxels deemed admissible were used in these calculations. The total percentage of admissible voxels within tumor ROIs, or admissibility (admiss), was also tabulated.
| Rat |
In Vivo
|
Ex Vivo
|
|||||
|---|---|---|---|---|---|---|---|
| # | pI (%) | T̄2,I (ms) | admiss (%) | pI (%) | T̄2,I (ms) | admiss (%) | |
| 1 | 7.1 ± 2.8 | 28.7 ± 2.3 | 100 | ||||
| 2 | 10.8 ± 10.8 | 28.7 ± 10.6 | 88.9 | ||||
| 3 | 21.3 ± 3.3 | 29.4 ± 3.4 | 97.0 | ||||
| 4 | 4.6 ± 1.1 | 20.4 ± 3.2 | 100 | ||||
| 5 | 12.1 ± 1.6 | 28.4 ± 1.5 | 100 | ||||
| 6 | 6.9 ± 3.2 | 33.0 ± 5.6 | 30.0 | ||||
| 7 | 11.1 ± 9.6 | 29.9 ± 17.9 | 69.2 | ||||
| 8 | 2.7 ± 0.4 | 22.3 ± 4.3 | 90.0 | ||||
| 9 | 8.1 ± 10.2 | 26.6 ± 12.6 | 85.7 | 9.0 ± 10.1 | 48.9 ± 25.7 | 92.9 | |
| 10 | 11.0 ± 1.5 | 22.5 ± 1.3 | 100 | 11.3 ± 3.0 | 34.9 ± 4.3 | 100 | |
| 11* | 0 | - | 0 | 5.3 ± 1.3 | 30.3 ± 4.3 | 100 | |
|
| |||||||
| Mean | 9.6 ± 4.5 | 22.1 ± 5.5 | 86.1 ± 22.0 | 8.5 ± 4.8 | 38.1 ± 11.4 | 97.6 ± 4.1 | |
Indicates animal was ignored in calculating the mean values across animals for in vivo measurements.
Ex vivo Magnetic Resonance
Fig. 3e and 3f displays the results of the ROI-based MET2 analysis ex vivo. For tumor ROIs, all three animals exhibited T2 spectra with three components: I) a short-lived component (T̄2,I = 37.8 ± 6.5 ms) representing 7.8 ± 6.5 % of the signal, II) an intermediated-lived component (T̄2,II = 109.5 ± 14.2 ms) representing 80.6 ± 8.2% of the signal, and III) a long-lived component (T̄2,III = 262.6 ± 44.6 ms) representing the remaining 11.6 ± 12.0% of the signal. Consistent with the in vivo findings, 94.5 ± 5.3% of the total signal could be described by a single component (T̄2 = 51.2 ± 8.4 ms) for normal grey matter ex vivo. It should be noted that relaxation times for components observed both in vivo and ex vivo (components I and II) were increased following fixation and washing in PBS, which is consistent with previous findings (24) in fixed primate grey matter. The relaxation times (T̄2,n) and signal fractions (pn) for each sample measured ex vivo are detailed in Table 3.
In contrast to ROI-based measurements, voxel-based T2 spectra in tumor consistently exhibited only two components ex vivo (though three components were resolved for some voxels). Fig. 5b displays <T̄2> and pI maps acquired ex vivo and Table 4 summarizes these results. Again, only results for voxels whose spectra were deemed admissible — defined here as spectra that exhibited either two or three components in the range 15–300 ms — are shown in Fig. 5b. Additional contributions from white matter were also removed by only displaying spectra whose long-lived T2 component was > 70 ms (using the same arguments as described above for in vivo measurements). These results suggest that voxel-based MET2 analysis might be possible with regards to resolving two components ex vivo because 97.6 ± 4.1% percent of voxel within tumor ROIs were deemed admissible.
Comparing in vivo and ex vivo voxel-based results, it can be seen that similar results were found for Rats #9 and #10, while a substantial difference was found for Rat #11. However, this particular animal (Rat #11) was sacrificed a full four days after the in vivo study (compared to one day for the other animals). Therefore, comparison between the in vivo and ex vivo data in this case is difficult as tumor growth had progressed significantly in those four days. In summary, the presented ex vivo results argue against the assertion that the in vivo results are due to either partial-voluming or low SNR.
DISCUSSION
This study demonstrates that T2 in a C6 rat glioblastoma model is heterogeneous on the scale of a typical MR voxel. Tumor signal exhibited two T2 components in eight of the eleven animals in vivo, while a majority of the signal from contralateral grey matter could be described by a single T2 component. Tumor signal in three of the eleven animals was monoexponential. Interestingly, the tumors of these animals were all relatively small in volume, suggesting that the observed MET2 signal might contain information about tumor progression. It should be noted, however, that no correlation was found between time post-innoculation and any of the MET2 parameters, which is not surprising given our observed variability in tumor volume across animals for a given time post-innoculation. Further longitudinal studies are needed to test the effect of tumor progression on MET2 parameters.
A similar pattern was observed in the higher resolution and SNR ex vivo data; however, in this case three T2 components were observed in tumor signal, while again a majority of the signal from contralateral gray matter could again be described by a single T2 component. The reason an additional long-lived peak (component III in Fig. 3f) was resolved ex vivo is unclear. Previous studies in white matter (25) have shown that T2 spectral characteristics are well-preserved in fixed samples. One possible explanation for the observed differences is the limited SNR of the in vivo data. In fact, spectra resulting from in vivo ROI-based analysis and ex vivo voxel-based analysis — data used for each of these analyses had approximately the same SNR — both exhibited two components (at least for a majority of tumor voxels in the ex vivo voxel-based analysis).
MET2 relaxation has been previously observed (6–10) in a number of tumor types and models with variable results. Given that microanatomical characteristics (and likely resultant relaxation spectra) vary across different tumor types and models, this observed variability is not surprising. Furthermore, a variety of models (e.g., biexponential, continuous) were employed in these past studies, which may be an additional contributing factor in this observed variability. In the current study, a linear least-squares algorithm with non-negative constraints (NNLS) was employed, which fits the data to a continuous distribution of decaying exponentials. This approach is particularly attractive as it makes no assumptions about the number of exponential components in the sample. Data sampling parameters (e.g, SNR, echo spacing) are an important consideration when employing such an approach (16). In the current study, Monte Carlo simulations were performed to ensure that these were sufficient to obtain reproducible results.
A number of physiological and microanatomical parameters are altered in tumors that may affect T2. This list includes variations in pO2 (26), pH (27), and water content (28) as well as the presence (or absence) of irregular vasculature, necrotic tissue (29), or densely packed proliferating cells (30). Given the heterogeneity common in tumors, a typical tumor voxel may contain regions that vary substantially in several of these parameters, which may explain the observed MET2 relaxation. The relevance of each of these with respect to the findings presented herein is discussed below.
It has been known for some time that the mean T2 (as well as T1) of viable tumor is elevated relative to normal tissue (31) and that this increase correlates with increased water content (28). This is consistent with the findings presented herein, in which <T̄2> was found to be elevated in tumors relative to contralateral grey matter. This can be attributed to the fact that the long-lived T2 (76.4 ± 9.3 ms) component in tumor signal, which represented a majority of the total signal (93.2 ± 6.2%), was longer than that observed in contralateral grey matter (48.8 ± 2.3 ms). Therefore, it is reasonable to assume that the long-T2 component in tumor signal represents signal from viable tumor tissue and that the underlying mechanism for the increased T2 of the component is increased water content. It should be noted that additional factors may also play a role in the elevated T2 of this component. For example, hypoxia (low tissue pO2) and intracellular acidosis have been shown to result in increased T2 in skeletal muscle (32). Given that viable tumor cells are commonly hypoxic and acidic, these may be underlying factors contributing to the observed long-T2 component in this study.
Assignment of an underlying mechanism for the short-T2 component observed in tumor signal is less straightforward. Recall the T2 of this component was substantially reduced (20.7 ± 5.4 ms) relative to contralateral grey matter (48.8 ± 2.3 ms); therefore, it is unlikely that this component reflects partial-volumed normal tissue within tumor ROIs (or voxels). One possible explanation for the observed short-T2 component in tumor signal is the presence of densely packed proliferating cells. It has previously been shown (33) that T2 and cellularity are inversely related in a human melanoma xenograft model — most likely attributed to that fact that macromolecular content increases and water content decreases with increased cellularity. The authors noted that T2 varied by a factor of approximately 1.5 between regions with extracellular volume fractions of 5 and 70% (27). In terms of the current study, it appears that increased cellularity alone cannot explain the observed short-T2 component. Even if we assume that the extracellular volume fraction varies to the extreme of the previously mentioned study, this variation alone could not explain the approximately 2.5-fold decrease in T2 of the short-T2 component in tumor signal relative to contralateral grey matter. Another possible explanation for the observed short-T2 component in tumor signal is the presence of irregular tumor vasculature (e.g., dead ends, shunts that are commonly found in tumor associated vasculature (29)), which may result in accumulation of paramagnetic deoxyhemoglobin and a corresponding decrease in T2 for adjacent tissue. A final, more likely, explanation for this component is the presence of necrotic tissue, which has been shown to have decreased water content (and similar T2) relative to normal tissue in surgical specimens taken from patients with lung cancer (8). A longitudinal study (7) in an EO 771 adenocarcinoma mouse model also noted decreases in T2 that correlated with the onset of necrosis.
Additional studies are needed to determine the physiological origin of these components. One proposed study is to use dynamic contrast-enhanced studies (DCE) MRI and histopathology and assess tumor necrosis. Correlation of these measures to the short-lived T2 signal fraction will allow us to test the hypothesis that this component arises from necrotic tissue. Though the underlying physiological origin of the observed MET2 components is currently unknown, MET2 analysis holds promise as a non-invasive tool for characterizing the tumor microenvironment in vivo on a sub-voxel scale.
Acknowledgments
Grant Sponsors: NIH EB001744, U24 CA126588 (NCI Small Animal Imaging Resource Program), 1K25 EB005936, 1K99CA127599-01 and NSF Career Award 0448915 (M.D.D). NIH P30 CA68485 (Cancer Center Support Grant)
We thank Jarrod True for providing expert assistance and guidance in technical animal care and handling issues and Kevin Wilson for assistance in MATLAB code development.
Abbreviations used
- MET2
multiexponential T2
- SNR
signal-to-noise ratio
- ROI
region of interest
- NNLS
non-negative least-squares
- ΔTE
interecho spacing
- NE
number of echoes
- NEX
number of averaged excitations
- DCE
dynamic contrast-enhanced
Footnotes
This work was presented, in part, at the International Society for Magnetic Resonance in Medicine 16th Scientific Meeting and Exhibition, Toronto, 2008.
References
- 1.Stewart WA, Mackay AL, Whittall KP, Moore GRW, Paty DW. Spin-spin relaxation in experimental allergic encephalomyelitis: Analysis of CPMG data using a nonlinear least-squares method and linear inverse-theory. Magn Reson Med. 1993;29:767–775. doi: 10.1002/mrm.1910290608. [DOI] [PubMed] [Google Scholar]
- 2.Mackay A, Whittal K, Adler J, Li D, Paty D, Graeb D. In-vivo visualization of myelin water in brain by magnetic resonance. Magn Reson Med. 1994;31:673–677. doi: 10.1002/mrm.1910310614. [DOI] [PubMed] [Google Scholar]
- 3.Does MD, Snyder RE. T2 relaxation of peripheral nerve measured in-vivo. Magn Reson Imaging. 1995;13:575–580. doi: 10.1016/0730-725x(94)00138-s. [DOI] [PubMed] [Google Scholar]
- 4.Vasilescu V, Katona E, Simplaceanu V, Demco D. Water compartments in myelinated nerve. 3. Pulsed NMR results. Experientia. 1978;34:1443–1444. doi: 10.1007/BF01932339. [DOI] [PubMed] [Google Scholar]
- 5.Saab G, Thompson RT, Marsh GD. Multicomponent T2 relaxation of in vivo skeletal muscle. Magn Reson Med. 1999;42:150–157. doi: 10.1002/(sici)1522-2594(199907)42:1<150::aid-mrm20>3.0.co;2-5. [DOI] [PubMed] [Google Scholar]
- 6.Kroeker RM, Stewart CA, Bronskill MJ, Henkelman RM. Continuous distributions of NMR relaxation times applied to tumors before and after therapy with X-rays and cyclophosphamide. Magn Reson Med. 1988;6:24–36. doi: 10.1002/mrm.1910060104. [DOI] [PubMed] [Google Scholar]
- 7.Kovalikova Z, Hoehn-Berlage MH, Gersonde K, Porschen R, Mittermayer C, Franke RP. Age-dependent variation of T1 and T2 relaxation times of adenocarcinoma in mice. Radiology. 1987;164:543–548. doi: 10.1148/radiology.164.2.3602399. [DOI] [PubMed] [Google Scholar]
- 8.Shioya S, Haida M, Ono Y, Fukuzaki M, Yamabayashi H. Lung cancer: differentiation of tumor, necrosis, and atelectasis by means of T1 and T2 values measured in vitro. Radiology. 1988;167:105–109. doi: 10.1148/radiology.167.1.3347709. [DOI] [PubMed] [Google Scholar]
- 9.Fantazzini P, Sarra A. A comparison of the proton relaxation in human epithelial tumors and associated uninvolved tissue. MAGMA. 1994;2:405–407. [Google Scholar]
- 10.Schad LR, Brix G, Zuna I, Harle W, Lorenz WJ, Semmler W. Multiexponential proton spin-spin relaxation in MR imaging of human brain tumors. J Comput Assist Tomogr. 1989;13:577–587. doi: 10.1097/00004728-198907000-00005. [DOI] [PubMed] [Google Scholar]
- 11.Carr HY, Purcell EM. Effects of Diffusion on Free Precession in Nuclear Magnetic Resonance Experiments. Physical Review. 1954;94:630. [Google Scholar]
- 12.Meiboom S, Gill D. Modified Spin-Echo Method for Measuring Nuclear Relaxation Times. Rev Sci Instrum. 1958;29:688–691. [Google Scholar]
- 13.Bonny JM, Boespflug-Tanguly O, Zanca M, Renou JP. Multi-exponential analysis of magnitude MR images using a quantitative multispectral edge-preserving filter. J Magn Reson. 2003;161:25–34. doi: 10.1016/s1090-7807(02)00107-6. [DOI] [PubMed] [Google Scholar]
- 14.Lawson CL, Hanson RJ. Solving least squares problems. Englewood Cliffs, NJ: Prentice-Hall; 1974. [Google Scholar]
- 15.Whittall KP, Mackay AL. Quantitative Interpretation of NMR Relaxation Data. J Magn Reson. 1989;84:134–152. [Google Scholar]
- 16.Graham SJ, Stanchev PL, Bronskill MJ. Criteria for analysis of multicomponent tissue T2 relaxation data. Magn Reson Med. 1996;35:370–378. doi: 10.1002/mrm.1910350315. [DOI] [PubMed] [Google Scholar]
- 17.Barth RF. Rat brain tumor models in experimental neuro-oncology: the 9L, C6, T9, F98, RG2 (D74), RT-2 and CNS-1 gliomas. J Neurooncol. 1998;36:91–102. doi: 10.1023/a:1005805203044. [DOI] [PubMed] [Google Scholar]
- 18.Poon CS, Henkelman RM. Practical T2 quantitation for clinical applications. J Magn Reson Imaging. 1992;2:541–553. doi: 10.1002/jmri.1880020512. [DOI] [PubMed] [Google Scholar]
- 19.Levitt MH, Freeman R. Compensation for pulse imperfections in NMR spin-echo experiments. J Magn Reson. 1981;43:65–80. [Google Scholar]
- 20.Karlsen OT, Verhagen R, Bovee WMMJ. Parameter estimation from Rician-distributed data sets using a maximum likelihood estimator: Application to T1 and perfusion measurements. Magn Reson Med. 1999;41:614–623. doi: 10.1002/(sici)1522-2594(199903)41:3<614::aid-mrm26>3.0.co;2-1. [DOI] [PubMed] [Google Scholar]
- 21.Gerig G, Kubler O, Kikinis R, Jolesz FA. Nonlinear anisotropic filtering of MRI data. IEEE Trans Med Imaging. 1992;11:221–232. doi: 10.1109/42.141646. [DOI] [PubMed] [Google Scholar]
- 22.Jones CK, Whittall KP, MacKay AL. Robust myelin water quantification: averaging vs. spatial filtering. Magn Reson Med. 2003;50:206–209. doi: 10.1002/mrm.10492. [DOI] [PubMed] [Google Scholar]
- 23.Does MD, Gore JC. Compartmental study of T1 and T2 in rat brain and trigeminal nerve in vivo. Magn Reson Med. 2002;47:274–283. doi: 10.1002/mrm.10060. [DOI] [PubMed] [Google Scholar]
- 24.D’Arceuil HE, Westmoreland S, de Crespigny AJ. An approach to high resolution diffusion tensor imaging in fixed primate brain. Neuroimage. 2007;35:553–565. doi: 10.1016/j.neuroimage.2006.12.028. [DOI] [PubMed] [Google Scholar]
- 25.Laule C, Kozlowski P, Leung E, Li DK, Mackay AL, Moore GR. Myelin water imaging of multiple sclerosis at 7 T: correlations with histopathology. Neuroimage. 2008;40:1575–1580. doi: 10.1016/j.neuroimage.2007.12.008. [DOI] [PubMed] [Google Scholar]
- 26.Padhani AR, Krohn KA, Lewis JS, Alber M. Imaging oxygenation of human tumours. Eur Radiol. 2007;17:861–872. doi: 10.1007/s00330-006-0431-y. [DOI] [PMC free article] [PubMed] [Google Scholar]
- 27.Gatenby RA, Gillies RJ. Why do cancers have high aerobic glycolysis? Nat Rev Cancer. 2004;4:891–899. doi: 10.1038/nrc1478. [DOI] [PubMed] [Google Scholar]
- 28.Kiricuta IC, Jr, Simplaceanu V. Tissue water content and nuclear magnetic resonance in normal and tumor tissues. Cancer Res. 1975;35:1164–1167. [PubMed] [Google Scholar]
- 29.Bergers G, Benjamin LE. Angiogenesis: Tumorigenesis and the angiogenic switch. Nat Rev Cancer. 2003;3:401–410. doi: 10.1038/nrc1093. [DOI] [PubMed] [Google Scholar]
- 30.Krohn KA, Mankoff DA, Eary JF. Imaging cellular proliferation as a measure of response to therapy. J Clin Pharmacol. 2001:96S–103S. [PubMed] [Google Scholar]
- 31.Damadian R. Tumor detection by nuclear magnetic resonance. Science. 1971;171:1151–1153. doi: 10.1126/science.171.3976.1151. [DOI] [PubMed] [Google Scholar]
- 32.Damon BM, Gregory CD, Hall KL, Stark HJ, Gulani V, Dawson MJ. Intracellular acidification and volume increases explain R(2) decreases in exercising muscle. Magn Reson Med. 2002;47:14–23. doi: 10.1002/mrm.10043. [DOI] [PubMed] [Google Scholar]
- 33.Jakobsen I, Lyng H, Kaalhus O, Rofstad EK. MRI of human tumor xenografts in vivo: proton relaxation times and extracellular tumor volume. Magn Reson Imaging. 1995;13:693–700. doi: 10.1016/0730-725x(95)00019-d. [DOI] [PubMed] [Google Scholar]