

Abstract
The loss of NPC1 protein function is the predominant cause of Niemann-Pick type C1 disease (NP-C1), a systemic and neurodegenerative disorder characterized by late-endosomal/lysosomal accumulation of cholesterol and other lipids. Limited evidence from post-mortem human tissues, an Npc1−/− mouse model, and cell culture studies also suggest failure of metal homeostasis in NP-C1. To investigate these findings, we performed a comprehensive transition metal analysis of cerebrospinal fluid (CSF), plasma and tissue samples from human NP-C1 patients and an Npc1−/− mouse model. NPC1 deficiency in the Npc1−/− mouse model resulted in a perturbation of transition metal homeostasis in the plasma and key organs (brain, liver, spleen, heart, lungs, and kidneys). Analysis of human patient CSF, plasma and post-mortem brain tissues also indicated disrupted metal homeostasis. There was a disparity in the direction of metal changes between the human and the Npc1−/− mouse samples, which may reflect species-specific metal metabolism. Nevertheless, common to both species is brain zinc accumulation. Furthermore, treatment with the glucosylceramide synthase inhibitor miglustat, the only drug shown in a controlled clinical trial to have some efficacy for NP-C1, did not correct the alterations in CSF and plasma transition metal and ceruloplasmin (CP) metabolism in NP-C1 patients. These findings highlight the importance of NPC1 function in metal homeostasis, and indicate that metal-targeting therapy may be of value as a treatment for NP-C.
INTRODUCTION
Niemann-Pick Disease Type C (NP-C) is an autosomal recessive lysosomal lipid storage disorder with progressive neurodegeneration. NP-C is classified as type C1 (NP-C1; OMIM 257220) or type C2 (NP-C2; OMIM 607625), which are caused by mutations in the NPC1 or NPC2 gene, respectively1, 2. Mutations in the NPC1 gene accounts for 95% of NP-C patients3. The concerted activities of NPC1 and NPC2 proteins are essential to intracellular mobilization of unesterified cholesterol and other lipids4, 5. Loss of either NPC1 or NPC2 function results in distinctive intracellular accumulation of cholesterol and glycosphingolipids in late endosomes and lysosomes. The onset of the disease can occur at any age, but it typically manifests in childhood with an early death by adolescence. Degeneration of cerebellar Purkinje neurons is a prominent early feature in the disease progression, which leads to clinical symptoms of motor impairments that include cerebellar ataxia, dysarthria and dysphagia3. Dementia is a late stage feature of NP-C due to the loss of hippocampal and cortical neurons6–8.
Transition metals such as iron, manganese, copper, and zinc are integral to diverse biological processes including neurotransmission, myelination, synaptogenesis, DNA transcription, respiration, and antioxidant defense. Dysregulation of essential redox-active metals such as copper and iron, can enhance toxic Fenton and Haber-Weiss reactions, and generate reactive oxygen species (ROS)9. Oxidative stress is a pathological feature of NP-C10–14. Notably, there is an elevation of non-enzymatically produced oxysterols in NP-C15, which could be a product of perturbed metal homeostasis.
Emerging data indicate an imbalance of metal ions in NP-C1. Skin fibroblast cells derived from NP-C1 patients have up-regulated gene expression of metalloproteins involved in copper (copper-transporting ATPase 1 (ATP7A)), iron (ferritin and sideroflexin 1) and zinc (zinc transporter ZIP2) metabolism11. Recent studies reported elevated copper levels in the liver and plasma of the Npc1−/− mouse model, concomitant with an increase in plasma ceruloplasmin (CP) levels12, 16. However, these findings are inconsistent with a case report of an NP-C1 patient who had elevated serum free copper with low CP17. An alternative explanation is that the low serum CP in this patient results from defective NPC1-dependent trafficking of the copper transporter ATP7B in hepatic cells from the late endosomes to the secretory pathway18, 19, where ATP7B facilitates copper incorporation into CP. CP plays an important role in iron export20. There is a lack of ferritin immunoreactivity in spleen, liver, and fetal tissues from human NP-C cases, suggesting that tissue iron is not properly regulated in NP-C21–23. Collectively, these findings implicate disrupted metal homeostasis in the Npc1−/− mouse model and NP-C1 patients, yet there is a lack of a detailed metal analysis of NP-C1 tissues and biological fluids to resolve the conflicting findings. To address this deficiency, we present here a detailed transition metal analysis of cerebrospinal fluid (CSF), plasma and tissue samples from human NP-C1 patients and the Npc1−/− mouse model.
EXPERIMENTAL
Animals
The Npc1−/− mouse model (BALB/c Npc1nih)24 was obtained from Jackson Laboratories and maintained on a standard chow diet. Experimental procedures were approved by the Washington University Animal Studies Committee and were conducted in accordance with the USDA Animal Welfare Act and the Public Health Service Policy for the Humane Care and Use of Laboratory Animals. Postnatal day 21 (P21) and day 49 (P49) female mice were anesthetized using a cocktail of telazol/butophaol/dexmedetomidine, followed by exsanguination and transcardial perfusion. Plasma samples were prepared from Npc1−/− and wild-type littermate control mice sacrificed at P21 (n = 5/genotype) and P49 (n = 18/genotype), using sodium heparin as the anti-coagulant. The following organs were collected (n = 14/genotype): cerebellum, cerebrum, liver, spleen, lungs, kidneys, and heart. Plasma and tissue samples were snap frozen in liquid nitrogen and stored at −80°C until use. The investigators were blinded to the sample genotype. Samples were decoded at the completion of metal analysis.
Human tissue and biological fluid samples
Post-mortem human brain tissues (cerebellum and hippocampus) from NP-C cases and matched non-NP-C control subjects (n (hippocampus) = 5/diagnostic group; n (cerebellum) = 4/diagnostic group); Table S3) were obtained from the Eunice Kennedy Shriver National Institute of Child Health and Development (NICHD) Brain and Tissue Bank for Developmental Disorders (MD, USA). NP-C1 patient cerebrospinal fluid (CSF) samples were collected under approved protocols from NICHD (IRB# 06-CH-0186; n = 21; Table S5) and Children's Hospital & Research Center Oakland (IRB# 2010–70) Institutional Review Boards (n = 2, not included in data analysis). Informed consent and assent, when appropriate, were obtained. The lumbar puncture was performed under sedation. CSF was collected in polypropylene tubes, snap frozen on dry ice, and stored at −80°C until use. NP-C1 patient and healthy control (HC) plasma samples were collected under approved protocols from NICHD Institutional Review Board (IRB# 06-CH-0186; n (HC) = 34; n (NP-C1) = 33) and Melbourne Health Human Research Ethics Committee (QA2010057; n = 7/diagnostic group). Metal and biochemical analyses of human brain tissue and biological fluid samples were approved by the University of Melbourne Human Research Ethics Committee (HREC# 1034015).
Metal analysis
Metal content in CSF, plasma and tissues samples were analyzed using inductively-coupled plasma mass spectrometry (ICP-MS) as previously described25. Lyophilized human and murine tissue (~40 – 600 mg wet weight or ~5 – 40 mg dry weight), CSF (100 μL) and plasma (50 μL) samples were pre-digested overnight in 50 μL of concentrated HNO3 (Aristar Grade, BDH), followed by heating to 90°C for 20 min. The acid digested tissue, CSF and plasma samples were diluted with 1% HNO3, and metal content was measured using a 7700× ICP-MS (Agilent). The instrument was calibrated using certified ICP-MS standard solutions (AccuStandard) containing 0, 10, 50, 100, and 500 ppb of all elements measured in 1% HNO3. Metal content in limited CSF samples were confirmed by inductively-coupled plasma optical emission spectrometry (ICP-OES)26 (data not shown). For ICP-OES analysis, the CSF sample (1 mL) was digested overnight in OmniTrace 70% HNO3 (EMD) with heating at 60°C and shaking at 200 rpm, then diluted to 5% HNO3 with OmniTrace water. Then the samples were analyzed for elemental analysis (similar to ICP-MS) using a Vista Pro ICP-OES (Varian, Inc). Elemental values were calibrated using National Institute of Standards and Technology (NIST)-traceable elemental standards and validated using NIST-traceable 1577b bovine liver reference material. Cesium (50 ppm) was used for ionization suppression and yttrium (5 ppm) was used as an internal standard. Data was collected and summarized using native software (ICP Expert; Varian, Inc).
Quantification of ceruloplasmin
Western blotting was used to identify total, apo- and holo-CP in both CSF and plasma samples as previously described27. Heparinized plasma samples were diluted 100-fold with 0.9% saline (Baxter). For each diluted heparinized plasma or neat CSF sample, two 5 μL preparations per sample were made. One set was heated at 95°C for 5 min for the detection of total CP, and the other set was not heat treated for differential detection of apo- and holo-CP. Protein samples were separated by SDS-PAGE using either 4 – 12% BisTris gradient gels (Invitrogen) or 4 – 20% Criterion TGX™ gels (Bio-Rad), using either MOPS (Invitrogen) or Tris/Glycine/SDS (Bio-Rad) running buffer, respectively. After separation by SDS-PAGE, proteins were transferred to a 0.2 μm nitrocellulose or PVDF membrane (Bio-Rad) using either an iBlot® Dry Blot System (Invitrogen) or Trans-Blot® Turbo™ Transfer System (Bio-Rad). Blots were blocked with Tris-buffered saline containing 0.05% Tween® 20 (Sigma) and 5% skim milk, and probed with anti-human ceruloplasmin antibody (Dako) diluted in the blocking buffer. The blots were subsequently incubated with an anti-rabbit IgG-horseradish peroxidase conjugated secondary antibody (Dako). Blots were developed using an ECL™ Western blotting detection system (Millipore), and visualized using an LAS-3000 Imaging System (Fujifilm). Densitometry quantification of immunoreactive signals was performed using MultiGauge v.3 (Fujifilm). CP concentration was estimated against purified human CP (Vital Products) standards.
Plasma ceruloplasmin oxidase activity
Plasma ceruloplasmin oxidase activity was assayed using a modified protocol for 96-well plates based on that previously described28. Briefly, 5 μL of each plasma sample was pre-incubated at 37°C with 75 mM sodium acetate buffer (pH 5.0) with or without 1 mM sodium azide. The reaction was initiated with the addition of 20 μL of 1.58 mM o-dianisidine dihydrochloride (Sigma). Samples on duplicate plates were incubated at 37°C for 5 min or 60 min. At designated time points, the reaction was stopped with 200 μL of 9 M sulfuric acid. The absorbance at 540 nm of the oxidized product was measured using a PowerWave microplate spectrometer (BioTek). CP oxidase activity was calculated as the difference between the total and azide-resistant oxidase activities.
Statistical analysis
Human clinical data analyses were performed with R version 2.15.229, using the following packages, multcomp30, effects30 and ggplot231. The data were checked for normality. Those that showed a deviation were transformed as required by BoxCox transformation32. For categorical variables such as gender, a chi-square test was performed to assess the distribution across the defined groups. Analysis of variance was used to assess any age difference between the groups. For all other continuous variables, analysis of co-variance (ANCOVA) was performed, adjusting for age (as a continuous variable), gender, clinical group and cohort site. Pairwise comparisons were performed using the Tukey contrasts with false discovery correction. Fisher's exact test was used to assess the significance of the difference in frequency of subjects below the reference range between the clinical groups. Multiple linear regression analysis was performed to assess the relationship between continuous variables (e.g. copper and CP levels) under investigation. The analysis included examination of the interaction between gender and miglustat status, gender and continuous variables, and miglustat status and continuous variables. We included only the significant interactions (p < 0.05) in the final model.
Statistical analyses of animal data, Student's t-test or two-way analysis of variance (ANOVA) with Bonferroni correction for multiple comparisons, as indicated in figure legends, were performed using GraphPad Prism version 5.04 for Windows (GraphPad Software). Data are presented as mean ± S.D. or mean ± S.E.M. as indicated. Statistical significance was defined as * p ≤ 0.05; ** p ≤ 0.01; *** p ≤ 0.001.
RESULTS
Extensive metal dyshomeostasis in tissues of Npc1−/− mice
To assess the impact of NPC1 gene ablation on metal metabolism, we analyzed metal contents in the Npc1−/− (BALB/c Npc1nih)24 mice, a well-characterized model for NP-C1. Brain, liver, spleen, lungs, heart, and kidneys, were collected from symptomatic female Npc1−/− and wild-type (WT) littermate control mice at P49. Metal analysis by inductively-coupled plasma mass spectrometry (ICP-MS) revealed marked changes in Npc1−/− tissues compared to WT controls (Figure 1 and Table S1).
Figure 1. Altered metal homeostasis in the Npc1−/− mouse model.

Major organ tissues were collected from P49 female Npc1−/− and wild-type (WT) littermate control mice (n = 14/genotype). Mn, Fe, Cu, and Zn concentrations were significantly changed in selected Npc1−/− tissues (cerebellum, cerebrum, and liver) compared to WT. See Table S1 for detailed metal analysis of major organs from the Npc1−/− mouse model. Metal levels were determined by ICPMS. Data represent mean ± S.E.M. Statistical analysis: Student's t-test. **p < 0.01; ***p < 0.001.
Iron levels were significantly decreased in Npc1−/− liver (29 ± 5%; p < 0.0001) and spleen (18 ± 4%; p < 0.0001) compared to WT. These results were consistent with previous studies that reported a lack of ferritin in these tissues from human NP-C cases21–23, indicating a functional iron deficiency. In contrast, we found a moderate iron accumulation in the cerebellum (16 ± 3%; p < 0.0001) and cerebrum (22 ± 2%; p < 0.0001) of Npc1−/− mice. There was no difference in iron levels in the lung, heart and kidney.
Copper levels were significantly altered in each tissue analyzed. Copper was significantly increased in the liver (23 ± 4%; p< 0.0001) and in the lung (170 ± 17%; p < 0.0001) of Npc1−/− mice compared to WT. A moderate but significant copper deficiency was observed in all other tissues examined, with reductions in Npc1−/− cerebellum (16 ± 3%; p < 0.0001), cerebrum (15 ± 2%; p < 0.0001), spleen (10 ± 4%; p = 0.01), kidney (14 ± 2%; p < 0.0001), and heart (6 ± 2%; p = 0.009). The elevation of copper in the Npc1−/− mouse liver was consistent with previous reports12, 16. It should be noted that despite a close agreement in the mean cerebellar copper concentrations measured in our study and that by Vazquez et al16, there was a discrepancy in our statistical significance testing results. Our study, but not Vazquez et al, found a significant decrease (16 ± 3%) in cerebellar copper concentrations in Npc1−/− compared to WT. This variance may be explained by our smaller error values and that the study by Vazquez et al may be under-powered due to a smaller Npc1−/− sample size. Methodological differences may have also contributed to the discrepant result.
Zinc levels were increased in the Npc1−/− mouse cerebellum (14 ± 3%; p < 0.0001) and cerebrum (12 ± 2%; p < 0.0001) relative to WT. The liver (24 ± 2%; p < 0.0001) and the lung (28 ± 6%; p < 0.0001) of Npc1−/− mice were markedly decreased in zinc, and to a lesser extent in the spleen (7 ± 3%; p = 0.03) and kidney (9 ± 2%; p < 0.0001), compared to WT.
There was a significant accumulation of manganese content in the cerebellum (23 ± 3%; p < 0.0001) and cerebrum (21 ± 3%; p < 0.0001) of Npc1−/− mice compared to WT. Manganese was also significantly increased to a lesser extent in the spleen (14 ± 7%; p = 0.03) and the heart (7 ± 3%; p = 0.02) of Npc1−/− mice. In contrast, there was a reduction in the Npc1−/− mouse liver (14 ± 2%; p < 0.0001) and lung (15 ± 6%; p = 0.02) manganese concentration.
Aberrant metal levels and ceruloplasmin abnormalities in Npc1−/− mice plasma
We analyzed the metal content of plasma samples collected from pre- and symptomatic female Npc1−/− and WT littermate control mice at P21 and P49, respectively. There was a trend to an age-dependent rise in plasma iron concentration in both genotypes, but not statistically significant (Figure 2A and Table S2). Our observation of a 34 ± 7% increase (p < 0.0001) in plasma copper at P49 in Npc1−/− mice compared to WT (Figure 2B and Table S2) was consistent with that previously reported16. Furthermore, we identified a marked age-dependent elevation of plasma copper in Npc1−/− mice that was not observed in WT animals (Figure 2B and Table S2). In contrast, we found an elevation in plasma zinc in pre-symptomatic Npc1−/− mice at P21 (Figure 2C and Table S2). At the symptomatic age of P49, plasma zinc in Npc1−/− mice fell to a level comparable to that of WT.
Figure 2. Altered plasma metal and CP homeostasis in the Npc1−/− mouse model.

Heparinized plasma samples were collected from P21 (n = 5/genotype) and P49 (n = 18/genotype) female Npc1−/− and wild-type (WT) littermate control mice. Significant changes in Npc1−/− plasma (A) Mn, (B) Fe, (C) Cu and (D) Zn concentrations; (E) total CP levels; (F) total oxidase activity; (G) apo- and holo-CP levels; and (H) CP and azide-resistant oxidase activity levels were age- and disease-dependent. Metal levels were determined by ICP-MS. Total, holo- and apo-CP levels were measured by western blotting (see Figure S1). Total, CP and azide-resistant oxidase activities were determined by the o-dianisidine oxidase assay. CP oxidase activity was calculated as the difference between total and azide-resistant oxidase activities. Data represent mean ± S.E.M. Statistical analysis: Two-way ANOVA with Bonferroni correction for multiple comparisons. *p ≤ 0.05; **p ≤ 0.01; ***p ≤ 0.001.
CP is a key protein linked to both copper and iron metabolism33. It requires six copper atoms to form the stable and active holo-CP species34, which is central to its ferroxidase activity and cellular iron export by catalyzing the oxidation of ferrous to ferric iron35. Therefore, impaired copper homeostasis can negatively affect the synthesis and activity of holo-CP, and subsequently iron homeostasis. We quantified total, apo- and holo-CP levels in the plasma by western blotting (Figure S1). In parallel with the elevated plasma copper levels at P49 in Npc1−/− mice, we also observed a 49 ± 4% increase (p = 0.0004) in total CP compared to WT (Figure 2D). This was also reflected in a concomitant 53 ± 7% increase (p < 0.0001)in total oxidase activity, the sum of azide-sensitive activity (attributed to CP, and known as ferroxidase I) and azide-resistant activity (ferroxidase II, which is proportionally more in mice than in humans)36 (Figure 2E). Although there was no age-dependent change in total CP levels in Npc1−/− mice, there was an age-dependent increase in the copper-bound active holo-CP level and a decrease in the unmetallated apo-CP level (Figure 2F). These changes in apo- and holo-CP levels were reflected in the age-dependent increase in total (azide-sensitive plus -insensitive) and CP oxidase (azide-sensitive) activities observed in Npc1−/− mouse plasma (2E and 2G).
Zinc accumulates in the human NP-C disease patient cerebellum
To assess the potential of dysregulated metal homeostasis to be a contributing factor to neurodegeneration in NP-C patients, we analyzed the metal content of brain tissues, CSF and plasma. The cerebellum and hippocampus have significant neuropathology in NP-C disease6–8. We obtained post-mortem cerebellar (n = 4/diagnostic group) and hippocampal (n = 5/diagnostic group) tissues from NP-C cases and matched non-NP-C controls (Table S3). Limited availability of post-mortem NP-C disease brain tissue samples restricted the power of this study. While the sample sizes are small, and having determined that there were no effects of gender or age, these factors were not included in the analysis of data presented. We found a significant elevation of zinc (28 ± 10%; p = 0.03) in NP-C cerebellar tissue compared to non-NP-C control tissues (Figure 3 and Table S4). There was a possible trend to elevated iron levels in the NP-C cerebellum compared to controls (p = 0.06). In the hippocampus, there was no significant difference in transition metals measured between NP-C and control samples, but a possible trend towards an increase in zinc (p = 0.09).
Figure 3. Zinc accumulates in human NP-C cerebellum.

Metal analysis of human postmortem cerebellar (n = 4/group) and hippocampal (n = 5/group) tissues from NP-C and age- and gender-matched non-NP-C control subjects. Metal concentrations in cerebellar and hippocampal tissues were measured by ICP-MS and normalized to tissue wet weight. Data represent mean ± S.E.M. Statistical analysis: Student's t-test. *p ≤ 0.05.
NP-C1 cerebrospinal fluid is deficient in transition metal
We also evaluated CSF transition metal levels in 21 NP-C1 disease patients. A third of the NP-C1 subjects were treated with miglustat (Table S5), an inhibitor of glycosphingolipid synthesis and the only drug shown in a controlled clinical trial to have some efficacy for NP-C37, 38. Therefore, we also analyzed the effect of miglustat treatment on CSF metal levels. Since control CSF samples from healthy individuals, particularly pediatric samples, are impractically rare, we used published reference range values39 as a comparison for the NP-C1 CSF metal levels.
Relative to the reference range, the majority of the NP-C1 CSF samples analyzed were deficient in the essential transition metals iron, copper and zinc (Figure 4B, 4C, 4D and Table S5). The mean CSF manganese concentration was just below the lower reference limit (Figure 4A; Table S5). Miglustat treatment had no effect on CSF metal concentrations. There was no association between levels of these metal ions and disease severity or age. The deficiency of transition metals was confirmed using samples that were measured in a separate lab using inductively-coupled plasma optical emission spectrometry (ICP-OES; data not shown). The apparent deficiency of transition metals in the CSF may indicate a failure of essential metal homeostasis in the central nervous system of NP-C1 patients.
Figure 4. Human NP-C1 CSF is deficient in transition metals.
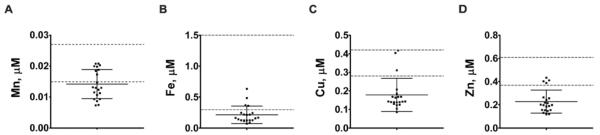
Scatterplots of CSF (A) Mn, (B) Fe, (C) Cu, and (D) Zn concentrations in human NP-C1 cases (n = 21). The majority of the NP-C1 cases have CSF (B) Fe, (C) Cu and (D) Zn concentrations below their respective reference range (dashed lines), independent of age, disease severity, gender and miglustat treatment. Metal concentrations were measured by ICP-MS. Data represent mean ± S.D. [Reference range: Lentner, C., (Ed.) (1981) Geigy Scientific Tables: Units of Measurement, Body Fluids, Composition of the Body, Nutrition. Ciba-Geigy Corporation Medical Education Division, Basel, Switzerland.]
CSF ceruloplasmin levels correlate with NP-C1 disease severity
To determine whether the apparent CSF copper and iron deficiencies affect the level of CP in the CSF of NP-C1 patients, we quantified CSF total, apo- and holo-CP levels by western blotting (Figure S2A). It was noteworthy that, despite an apparent copper deficiency in the CSF, the estimated CSF total CP concentration in NP-C1 patients was slightly higher than the reference range (Table S5). We found a significant positive correlation between NP-C1 disease severity and CSF total CP and holo-CP concentrations (Figure 5A). An increase in 1 nM of total CP and holo-CP corresponded to an increase of 2 ± 1 and 2.7 ± 0.9 points in clinical severity score40, respectively. Thus, CSF total CP and holo-CP may be useful biomarkers of NP-C1 disease progression.
Figure 5. Changes in NP-C1 CSF CP and metal homeostasis.

(A) A moderate, but significant positive correlation between NP-C disease severity with CSF total and holo-CP concentrations. (B) There was a significant negative correlation between NP-C1 CSF Cu and apo-CP. (C) The CSF Mn concentration was significantly associated with both total and holo-CP levels. CSF total, holo- and apo-CP concentrations were measured using purified human CP standards and western blotting (see Figure S2A). Statistical analysis: multiple linear regression was performed, adjusting for age and gender (n = 21). Shaded areas denote 95% confidence interval.
We further examined the association between CSF CP species with CSF metal ions. Unlike plasma, there was no correlation between copper and total CP or holo-CP in the NP-C1 CSF samples (Figure 5B). Interestingly, we found a modest, but significant negative correlation between copper and apo-CP (Figure 5B). We also found significant negative correlations between NP-C1 CSF manganese and total CP or holo-CP levels, which was independent of miglustat treatment (Figure 5C). These relationships were adjusted for age and gender.
Significantly decreased plasma metal concentrations in NP-C1
Next, we appraised NP-C1 patient plasma metal levels. We found, compared to matched non-NP-C healthy controls (HC), NP-C1 cases had slightly lower plasma manganese, iron and zinc (Figure 6 and Table S6). In particular, values below the reference range for plasma zinc were frequent in NP-C1 patients (12%), and uncommon in the HC (5%; p = 0.04). Miglustat treatment did not impact on any of these changes. Although there was a slight decrease in the plasma copper concentration in the NP-C1 cases, the mean concentration difference was not statistically different to that of HC (Table S6).
Figure 6. Altered plasma Mn, Fe and Zn homestasis in NP-C1 patients.
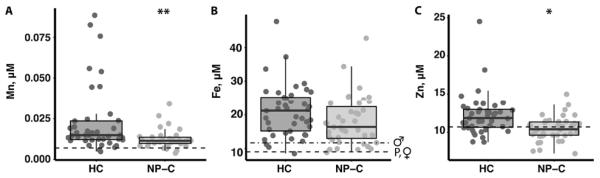
Metal analysis of heparinized plasma samples from NP-C1 cases (n = 40) and age-matched healthy controls (HC; n = 41). There was a significant decrease in (A) Mn, (B) Fe and (C) Zn in the NP-C1 plasma samples compared to HC. The frequency of NP-C1 patients (12%) with plasma zinc below the reference range is significantly greater than HC (5%; p = 0.04). These changes were not affected by miglustat treatment. Metal concentrations were measured by ICP-MS. Box and whiskers plot depict the median, the inter-quartile range (IQR), and the highest and lowest values within 1.5 times the IQR. Statistical analysis: ANCOVA followed by multiple pairwise comparison using the Tukey contrasts with false discovery correction. *p ≤ 0.05; **p ≤ 0.01; ***p ≤ 0.001. [Reference range (dashed lines): Tietz, N.W. (1987). Fundamentals of clinical chemistry, 3rd edn. Saunders, Philadelphia. P: pediatric (≤ 21 years old); ♀: female; ♂: male.]
Miglustat treatment affects holo-CP formation and specific oxidase activity
CP is a major copper-carrying protein in the blood41, 42, and it is sometimes used as an indirect indicator of serum and plasma copper levels. On the basis of the disparate findings of serum/plasma copper changes between our study and a case study that reported an elevation in serum free copper17, we further investigated the change in human plasma CP. We found that there was no significant difference in plasma total CP concentration between HC and both NPC1 groups (Figure 7A, Figure S2B and Table S6). However, further separating CP into the active copper-bound holo-CP and unmetallated apo-CP species, we found that miglustat treatment resulted in a small, but significant, increase in plasma holo-CP concentration in the NP-C1 patients (Figure 7B and Table S6), while there was no difference in the mean apo-CP concentration between the three groups (Figure 7C and Table S6).
Figure 7. Miglustat alters human NP-C1 patient plasma CP homeostasis.

There were no significant differences in the mean plasma (A) total and (C) apo-CP concentrations between non-NP-C healthy controls (HC; n =41) and NP-C1 cases not treated (n = 16) and treated with miglustat (n = 24). However, (B) plasma holo-CP was significantly increased by 17% in NP-C1 patients treated with miglustat. Despite an increase in holo-CP, NP-C1 patients treated with miglustat had significantly lower (D) Cu:total CP and (E) Cu:holo-CP ratios compared to HC and NP-C1 patients not treated with miglustat. (F) This was reflected in a significantly reduced holo-CP specific activity in NP-C1 patients treated with miglustat compared to those not treated with miglustat. (G) Plasma apo-CP in NP-C1 patients was significantly associated with disease severity, and this was gender-dependent, but independent of miglustat treatment (p = 0.016). Plasma total, holo- and apo-CP concentrations were measured using purified human CP standards and western blotting (see Figure S2B). Box and whiskers plot depict the median, the inter-quartile range (IQR), and the highest and lowest values within 1.5 times the IQR. Statistical analysis: (A – F) ANCOVA followed by multiple pairwise comparison using the Tukey contrasts with false discovery correction; (G) multiple linear regression was performed, adjusting for age, gender and miglustat status. *p ≤ 0.05; **p ≤ 0.01. Shaded areas denote 95% confidence interval.
Stable and active CP requires binding of six copper atoms34. Our calculation of the mean plasma Cu:total CP and Cu:holo-CP ratios for HC approximated the expected ratio of six (Figure 7D, 7E and Table S6). Consistent with the plasma copper data, the plasma Cu:total CP and Cu:holo-CP ratios for NP-C1 patients not treated with miglustat did not deviate significantly from that of the HC (Figure 7D and 7E). It is noteworthy that NP-C1 patients treated with miglustat had significantly decreased plasma Cu:total CP and Cu:holo-CP ratios compared to HC and NP-C1 patients not treated with miglustat (Figure 7D and 7E). The decrease in plasma Cu:holo-CP ratio in NP-C1 patients treated with miglustat was paralleled by a small but significant decrease in holo-CP specific oxidase activity (Figure 7F).
Interestingly, we found a negative association between NP-C1 disease severity and plasma apo-CP concentration that was gender-dependent (female only) but miglustat-independent (Figure 7G). However, there was a significant difference in severity score that was miglustat-dependent after adjusting for gender and apo-CP concentration (p < 0.0002). Overall, NP-C1 patients treated with miglustat had lower severity score compared to those not treated with miglustat. There was no association between NP-C1 disease severity and other CP or CP activity parameters examined.
DISCUSSION
To our knowledge, this is the first comprehensive transition metal analysis of tissue and plasma samples from NP-C1 patients and an Npc1−/− mouse model. Our study shows an extensive perturbation of metal homeostasis in the plasma and major organs and plasma CP homeostasis in the Npc1−/− mouse model compared to WT. We also found disturbed metal homeostasis in human NP-C1 patient CSF, post-mortem cerebellar tissue, and plasma samples. Collectively, disrupted metal homeostasis in the human NP-C1 clinical samples and the Npc1−/− mouse model indicates a critical role for NPC1 in the regulation of metal metabolism. It is important to note that the Npc1−/− mouse model does not fully recapitulate the changes in metal and CP homeostasis found in NP-C1 patients, but common to both species is the aberrant zinc homeostasis in the brain.
A number of factors can contribute to the disparity between the Npc1−/− mouse model and human NP-C1 clinical sample data. The Npc1−/− mouse model is effectively a “knockout” of Npc1 due to a large 703 bp deletion in the gene24, representing the most severe phenotype. In comparison, most of the human NP-C1 patients harbor missense mutations in the NPC1 gene with pleiotropic phenotypes43, 44, which may exhibit mild to moderate phenotypes relative to the residual protein activity. However, due to the small human sample size, the statistical power was low and precludes the inclusion of specific mutations as a part of the statistical model analysis. Furthermore, changes in metal metabolism in human NP-C1 patients may be obscured by heterogeneous genetic backgrounds and environmental factors. For example, the biochemical manifestations and the age of disease onset in the NP-C1 patients may be modified by additional genetic factors, such as the Apo-ε4 genotype45. It is noteworthy that ApoE binds transition metals, with highest affinity for copper46. The combination of cysteine and arginine at the isoform-defining positions 112 and 158 may result in differential metal metabolism in NP-C1 patients. Moreover, metal metabolism in humans is sensitive to variations in diet and intake of supplements/drugs that would not be a consideration in laboratory mice.
Peripheral copper dyshomeostasis has been associated with a loss of NPC1 function in an NP-C1 patient and the Npc1−/− mouse model11, 12, 16, 17. We observed no significant difference in plasma copper level in the present NP-C1 patient cohort compared to HC (Table S6). However, we did observe a late-disease stage increase in plasma copper in Npc1−/− mice (Figure 2B) as previously reported16. This rise in plasma copper coincides with a significant increase in late-disease stage hepatic oxidative gene expression13. Thus, copper is likely a contributor to the rise in oxidative stress in Npc1−/− mice. Disrupted copper homeostasis is widespread in all Npc1−/− mouse tissue types examined, with the most dramatic change of a 170 ± 17% increase in the lungs. It is possible that the copper-induced oxidative stress in the lungs may contribute to the pulmonary abnormalities reported in animal model studies47, 48.
CP is a multi-copper oxidase that plays an important role in copper and iron metabolism, and it may serve as a surrogate peripheral marker of copper status. Consistent with our finding of normal plasma copper levels in NP-C1 patients, the plasma levels of all CP species, holo-CP oxidase activity and Cu:holo-CP ratio analyzed in this study remained unchanged between the HC and the NP-C1 patients not taking miglustat (Figure 7 and Table S6). However, there was a small but significant decrease in plasma iron compared to HC (Figure 6B and Table S6) that cannot be explained by the apparent normal holo-CP activity. It should be noted that despite an apparent increase in holo-CP in NP-C1 patients treated with miglustat, the Cu:holo-CP ratio and holo-CP specific activity were significantly decreased compared to NP-C1 patients not treated with miglustat and compared to HC. The negative impact of miglustat on CP specific activity suggests that glycosphingolipids may be important in regulating CP activity by an uncertain mechanism. Again, in contrast to the human data, and as previously reported16, there is a concomitant elevation of the plasma total CP level in symptomatic Npc1−/− mice (Figure 2D). In this study we further demonstrated that this corresponds to increased copper-bound holo-CP and CP oxidase activity (Figure 2F and 2G). This difference between human and mouse plasma CP and its oxidase activity may be explained by a species-specific difference in CP metabolism and activity36. In humans, CP accounts for 90 – 100% of the plasma ferroxidase activity. In contrast, only about 50% of mouse plasma ferroxidase is attributable to CP, while the source of the remaining 50% is unknown. Furthermore, our in vivo human and mouse CP data do not support the in vitro finding that NPC1 regulates ATP7B trafficking to the secretory pathway, where ATP7B incorporates copper into CP18, 19. Further studies are required to resolve this apparent inconsistency.
Interestingly, there is an apparent copper deficiency in the CSF of NP-C1 patients, but a slightly higher total CP level compared to their respective reference ranges. There is a lack of association between CSF total and holo-CP with copper (Figure 5B), and the CSF Cu:CP ratio is 7 – 8-folds greater than that observed in the plasma. Our finding is consistent with an earlier study that reported only a small fraction of copper is associated with CP in the CSF in both Alzheimer's disease (AD) and control subjects49. We have limited knowledge of normal CP metabolism in the CSF, but the difference between peripheral and CSF Cu:CP ratios suggests discrete CP metabolism in these compartments. Collectively, these findings are consistent with the hypothesis that, unlike the plasma, the majority of the CSF copper is not CP-bound but binds to an yet-to-be-identified ligand50. However, in contrast to decreased CSF holo-CP in AD, our analysis of the NP-C1 CSF revealed a modest but significant positive association between CSF total and holo-CP concentrations and disease severity (Figure 5A). CP is an acute phase marker and this association may reflect the increase in neuroinflammation in NP-C151. Thus CSF CP may be a useful biomarker to monitor the disease progression and therapeutic response, in addition to the other CSF neuroinflammatory markers identified in the Cologna et al study51.
Zinc is an essential trace element important to the development and survival of all organisms. It is particularly critical to the normal brain function, such as neurotransmission and signaling52, 53. In Npc1−/− mice, there was an early, pre-symptomatic increase in plasma zinc compared to WT animals at P21, which appeared to normalize by P49 (Figure 2C and Table S1). Interestingly, an MRI study has revealed that pre-symptomatic 3-week old Npc1−/− mice exhibit a loss of white matter54. Combined with the age-dependent increase in plasma copper in symptomatic Npc1−/− mice at P49, the observed changes in plasma copper and zinc could serve as pre- and symptomatic biomarkers in the Npc1−/− mouse model. However, in NP-C1 patients, plasma zinc is significantly decreased compared to HC and they are more frequently below the reference range (Figure 6C and Table S6). Also, this apparent zinc deficiency is not corrected by miglustat treatment. It is noteworthy that hepatosplenomegaly is associated with human serum/plasma zinc deficiency55, 56, and is a complication of NP-C. Despite the inconsistencies in changes in plasma zinc between NP-C1 patients and Npc1−/− mice, both species demonstrate brain zinc overload (Figure 1 and 3, Tables S1 and S4). Excess brain zinc can promote tau expression, phosphorylation and aggregation, possibly contributing to the formation of pathological neurofibrillary tangles (NFTs) in NP-C57–63. Furthermore, zinc also accumulates in brain tissues from ovine and murine models of CLN6 neuronal ceroid lipofuscinosis (Batten disease), a lysosomal storage disease64, 65. Thus, brain zinc accumulation is an emerging common pathological feature associated with neurodegeneration in lysosomal storage disorders.
CONCLUSIONS
The findings in this study support a novel role for NPC1 in the regulation of metal metabolism, although its impact on human and mouse metal metabolism may differ. We hypothesize that since the lysosome is believed to play a critical role in the uptake and sorting of transition metals66, the lesion of NPC1 may perturb metal homeostasis by disrupting lysosomal-dependent sorting mechanisms. It is notable that miglustat does not correct the perturbed plasma manganese, iron and zinc levels and disrupts plasma CP chemistry in NP-C1 patients. Future therapeutic strategies for NP-C1 may need to consider the failure in metal metabolism to improve treatment efficacy.
Supplementary Material
ACKNOWLEDGEMENTS
This work was supported by grants from the National Health & Medical Research Council of Australia (A.I.B.), Cooperative Research Centre for Mental Health (A.I.B.), the Addi and Cassi Fund (A.I.B. and Y.H.H.), Perpetual Trustees (Harry Secomb Foundation and Payne L & Heather Medical Research Charitable Foundation (A.I.B.)), intramural research program of the Eunice Kennedy Shriver National Institute of Child Health and Human Development (F.D.P.), Ara Parseghian Medical Research Foundation (D.S.O. and F.D.P.), Dana's Angels Research Trust (D.S.O. and F.D.P.). Bench to Bedside award from the NIH Clinical Center and Office of Rare Diseases (F.D.P.). The Florey Institute of Neuroscience and Mental Health acknowledges the strong support from the Victorian Government and in particular the funding from the Operational Infrastructure Support Grant.
The authors thank Shih-Min Chiu, Amelia Sedjahtera, Lisa Bray, Kali Hubbert, Charlotte Jordan, Tai Holland, and the Australian Imaging, Biomarker and Lifestyle (AIBL) Study research team (Brett Trounson, Christopher Fowler, Rebecca Rumble and Kelly Pertile) for technical support; and Dr. Paul Adlard (Florey Institute of Neuroscience and Mental Health) for provision of non-NP-C control CSF samples. The authors would like to thank NP-C patients and their families, and healthy control subjects for their contribution and participation in this study.
Footnotes
CONFLICT OF INTEREST STATEMENT A.I.B. is a shareholder in Prana Biotechnology Ltd, Cogstate Ltd, and Mesoblast Ltd.
REFERENCES
- 1.Carstea ED, Morris JA, Coleman KG, Loftus SK, Zhang D, Cummings C, Gu J, Rosenfeld MA, Pavan WJ, Krizman DB, Nagle J, Polymeropoulos MH, Sturley SL, Ioannou YA, Higgins ME, Comly M, Cooney A, Brown A, Kaneski CR, Blanchette-Mackie EJ, Dwyer NK, Neufeld EB, Chang TY, Liscum L, Strauss JF, 3rd, Ohno K, Zeigler M, Carmi R, Sokol J, Markie D, O'Neill RR, van Diggelen OP, Elleder M, Patterson MC, Brady RO, Vanier MT, Pentchev PG, Tagle DA. Science. 1997;277:228–231. [Google Scholar]
- 2.Naureckiene S, Sleat DE, Lackland H, Fensom A, Vanier MT, Wattiaux R, Jadot M, Lobel P. Science. 2000;290:2298–2301. doi: 10.1126/science.290.5500.2298. [DOI] [PubMed] [Google Scholar]
- 3.Patterson MC, Mengel E, Wijburg FA, Muller A, Schwierin B, Drevon H, Vanier MT, Pineda M. Orphanet J Rare Dis. 2013;8:12. doi: 10.1186/1750-1172-8-12. [DOI] [PMC free article] [PubMed] [Google Scholar]
- 4.Vanier MT. Orphanet J Rare Dis. 2010;5:16. doi: 10.1186/1750-1172-5-16. [DOI] [PMC free article] [PubMed] [Google Scholar]
- 5.Rosenbaum AI, Maxfield FR. J Neurochem. 2011;116:789–795. doi: 10.1111/j.1471-4159.2010.06976.x. [DOI] [PMC free article] [PubMed] [Google Scholar]
- 6.Love S, Bridges LR, Case CP. Brain. 1995;118(Pt 1):119–129. doi: 10.1093/brain/118.1.119. [DOI] [PubMed] [Google Scholar]
- 7.Ong WY, Kumar U, Switzer RC, Sidhu A, Suresh G, Hu CY, Patel SC. Exp Brain Res. 2001;141:218–231. doi: 10.1007/s002210100870. [DOI] [PubMed] [Google Scholar]
- 8.Yamada A, Saji M, Ukita Y, Shinoda Y, Taniguchi M, Higaki K, Ninomiya H, Ohno K. Brain Dev. 2001;23:288–297. doi: 10.1016/s0387-7604(01)00209-1. [DOI] [PubMed] [Google Scholar]
- 9.Halliwell B, Gutteridge JMC. Biochem. J. 1984;219:1–14. doi: 10.1042/bj2190001. [DOI] [PMC free article] [PubMed] [Google Scholar]
- 10.Fu R, Yanjanin NM, Bianconi S, Pavan WJ, Porter FD. Mol Genet Metab. 2010;101:214–218. doi: 10.1016/j.ymgme.2010.06.018. [DOI] [PMC free article] [PubMed] [Google Scholar]
- 11.Reddy JV, Ganley IG, Pfeffer SR. PLoS ONE. 2006;1:e19. doi: 10.1371/journal.pone.0000019. [DOI] [PMC free article] [PubMed] [Google Scholar]
- 12.Vazquez MC, del Pozo T, Robledo FA, Carrasco G, Pavez L, Olivares F, Gonzalez M, Zanlungo S. PLoS ONE. 2011;6:e28777. doi: 10.1371/journal.pone.0028777. [DOI] [PMC free article] [PubMed] [Google Scholar]
- 13.Cluzeau CV, Watkins-Chow DE, Fu R, Borate B, Yanjanin N, Dail MK, Davidson CD, Walkley SU, Ory DS, Wassif CA, Pavan WJ, Porter FD. Hum Mol Genet. 2012;21:3632–3646. doi: 10.1093/hmg/dds193. [DOI] [PMC free article] [PubMed] [Google Scholar]
- 14.Fu R, Wassif CA, Yanjanin NM, Watkins-Chow DE, Baxter LL, Incao A, Liscum L, Sidhu R, Firnkes S, Graham M, Ory DS, Porter FD, Pavan WJ. Hum Mol Genet. 2013 doi: 10.1093/hmg/ddt206. [DOI] [PMC free article] [PubMed] [Google Scholar]
- 15.Porter FD, Scherrer DE, Lanier MH, Langmade SJ, Molugu V, Gale SE, Olzeski D, Sidhu R, Dietzen DJ, Fu R, Wassif CA, Yanjanin NM, Marso SP, House J, Vite C, Schaffer JE, Ory DS. Sci Transl Med. 2010;2:56ra81. doi: 10.1126/scitranslmed.3001417. [DOI] [PMC free article] [PubMed] [Google Scholar]
- 16.Vazquez MC, Martinez P, Alvarez AR, Gonzalez M, Zanlungo S. Biometals. 2012;25:777–786. doi: 10.1007/s10534-012-9546-6. [DOI] [PubMed] [Google Scholar]
- 17.Connemann BJ, Gahr M, Schmid M, Runz H, Freudenmann RW. J Clin Neurosci. 2012 doi: 10.1016/j.jocn.2011.05.038. [DOI] [PubMed] [Google Scholar]
- 18.Yanagimoto C, Harada M, Kumemura H, Koga H, Kawaguchi T, Terada K, Hanada S, Taniguchi E, Koizumi Y, Koyota S, Ninomiya H, Ueno T, Sugiyama T, Sata M. Exp Cell Res. 2009;315:119–126. doi: 10.1016/j.yexcr.2008.10.022. [DOI] [PubMed] [Google Scholar]
- 19.Yanagimoto C, Harada M, Kumemura H, Abe M, Koga H, Sakata M, Kawaguchi T, Terada K, Hanada S, Taniguchi E, Ninomiya H, Ueno T, Sugiyama T, Sata M. Hepatol Res. 2011;41:484–491. doi: 10.1111/j.1872-034X.2011.00788.x. [DOI] [PubMed] [Google Scholar]
- 20.Chua AC, Graham RM, Trinder D, Olynyk JK. Crit Rev Clin Lab Sci. 2007;44:413–459. doi: 10.1080/10408360701428257. [DOI] [PubMed] [Google Scholar]
- 21.Christomanou H, Harzer K. Biochem Mol Med. 1996;58:176–183. doi: 10.1006/bmme.1996.0046. [DOI] [PubMed] [Google Scholar]
- 22.Christomanou H, Kellermann J, Linke RP, Harzer K. Biochem Mol Med. 1995;55:105–115. doi: 10.1006/bmme.1995.1040. [DOI] [PubMed] [Google Scholar]
- 23.Christomanou H, Vanier MT, Santambrogio P, Arosio P, Kleijer WJ, Harzer K. Mol Genet Metab. 2000;70:196–202. doi: 10.1006/mgme.2000.3004. [DOI] [PubMed] [Google Scholar]
- 24.Loftus SK, Morris JA, Carstea ED, Gu JZ, Cummings C, Brown A, Ellison J, Ohno K, Rosenfeld MA, Tagle DA, Pentchev PG, Pavan WJ. Science. 1997;277:232–235. doi: 10.1126/science.277.5323.232. [DOI] [PubMed] [Google Scholar]
- 25.Maynard CJ, Cappai R, Volitakis I, Cherny RA, Masters CL, Li QX, Bush AI. J Inorg Biochem. 2006;100:952–962. doi: 10.1016/j.jinorgbio.2006.02.010. [DOI] [PubMed] [Google Scholar]
- 26.Page KE, White KN, McCrohan CR, Killilea DW, Lithgow GJ. Metallomics. 2012;4:512–522. doi: 10.1039/c2mt00146b. [DOI] [PMC free article] [PubMed] [Google Scholar]
- 27.Sato M, Gitlin JD. J Biol Chem. 1991;266:5128–5134. [PubMed] [Google Scholar]
- 28.Schosinsky KH, Lehmann HP, Beeler MF. Clin Chem. 1974;20:1556–1563. [PubMed] [Google Scholar]
- 29.R Development Core Team . R: A language and environment for statistical computing. R Foundation for Statistical Computing; 2011. [Google Scholar]
- 30.Hothorn T, Bretz F, Westfall P. Biometrical journal. Biometrische Zeitschrift. 2008;50:346–363. doi: 10.1002/bimj.200810425. [DOI] [PubMed] [Google Scholar]
- 31.Wickham H. ggplot2: Elegant Graphics for Data Analysis. 2nd edn. Springer Publishing Company, Incorporated; 2009. [Google Scholar]
- 32.Box G, Cox D. Journal of the Royal Statistical Society. Series B (Methodological) 1964;26:211–252. [Google Scholar]
- 33.Prohaska JR. Advances in nutrition. 2011;2:89–95. doi: 10.3945/an.110.000208. [DOI] [PMC free article] [PubMed] [Google Scholar]
- 34.Zaitsev VN, Zaitseva I, Papiz M, Lindley PF. J Biol Inorg Chem. 1999;4:579–587. doi: 10.1007/s007750050380. [DOI] [PubMed] [Google Scholar]
- 35.Hellman NE, Gitlin JD. Annu Rev Nutr. 2002;22:439–458. doi: 10.1146/annurev.nutr.22.012502.114457. [DOI] [PubMed] [Google Scholar]
- 36.Gray LW, Kidane TZ, Nguyen A, Akagi S, Petrasek K, Chu YL, Cabrera A, Kantardjieff K, Mason AZ, Linder MC. Biochem J. 2009;419:237–245. doi: 10.1042/BJ20081983. [DOI] [PubMed] [Google Scholar]
- 37.Patterson MC, Hendriksz CJ, Walterfang M, Sedel F, Vanier MT, Wijburg F, Group N-CGW. Mol Genet Metab. 2012;106:330–344. doi: 10.1016/j.ymgme.2012.03.012. [DOI] [PubMed] [Google Scholar]
- 38.Patterson MC, Vecchio D, Prady H, Abel L, Wraith JE. Lancet Neurol. 2007;6:765–772. doi: 10.1016/S1474-4422(07)70194-1. [DOI] [PubMed] [Google Scholar]
- 39.Lentner C, editor. Geigy Scientific Tables: Units of Measurement, Body Fluids, Composition of the Body, Nutrition. 8th edn. Ciba-Geigy Corporation Medical Education Division; Basel, Switzerland: 1981. [Google Scholar]
- 40.Yanjanin NM, Velez JI, Gropman A, King K, Bianconi SE, Conley SK, Brewer CC, Solomon B, Pavan WJ, Arcos-Burgos M, Patterson MC, Porter FD. Am J Med Genet B Neuropsychiatr Genet. 2010;153B:132–140. doi: 10.1002/ajmg.b.30969. [DOI] [PMC free article] [PubMed] [Google Scholar]
- 41.Campbell CH, Brown R, Linder MC. Biochim Biophys Acta. 1981;678:27–38. doi: 10.1016/0304-4165(81)90044-1. [DOI] [PubMed] [Google Scholar]
- 42.Lee SH, Lancey R, Montaser A, Madani N, Linder MC. Proc Soc Exp Biol Med. 1993;203:428–439. doi: 10.3181/00379727-203-43619. [DOI] [PubMed] [Google Scholar]
- 43.Ribeiro I, Marcao A, Amaral O, Sa Miranda MC, Vanier MT, Millat G. Hum Genet. 2001;109:24–32. doi: 10.1007/s004390100531. [DOI] [PubMed] [Google Scholar]
- 44.Park WD, O'Brien JF, Lundquist PA, Kraft DL, Vockley CW, Karnes PS, Patterson MC, Snow K. Hum Mutat. 2003;22:313–325. doi: 10.1002/humu.10255. [DOI] [PubMed] [Google Scholar]
- 45.Fu R, Yanjanin NM, Elrick MJ, Ware C, Lieberman AP, Porter FD. Am J Med Genet A. 2012;158A:2775–2780. doi: 10.1002/ajmg.a.35395. [DOI] [PMC free article] [PubMed] [Google Scholar]
- 46.Miyata M, Smith JD. Nat Genet. 1996;14:55–61. doi: 10.1038/ng0996-55. [DOI] [PubMed] [Google Scholar]
- 47.Roszell BR, Tao JQ, Yu KJ, Gao L, Huang S, Ning Y, Feinstein SI, Vite CH, Bates SR. PLoS ONE. 2013;8:e67084. doi: 10.1371/journal.pone.0067084. [DOI] [PMC free article] [PubMed] [Google Scholar]
- 48.Muralidhar A, Borbon IA, Esharif DM, Ke W, Manacheril R, Daines M, Erickson RP. Mol Genet Metab. 2011;103:142–147. doi: 10.1016/j.ymgme.2011.03.001. [DOI] [PMC free article] [PubMed] [Google Scholar]
- 49.Capo CR, Arciello M, Squitti R, Cassetta E, Rossini PM, Calabrese L, Rossi L. Biometals. 2008;21:367–372. doi: 10.1007/s10534-007-9125-4. [DOI] [PubMed] [Google Scholar]
- 50.Que EL, Domaille DW, Chang CJ. Chem Rev. 2008;108:1517–1549. doi: 10.1021/cr078203u. [DOI] [PubMed] [Google Scholar]
- 51.Cologna SM, Cluzeau CV, Yanjanin NM, Blank PS, Dail MK, Siebel S, Toth CL, Wassif CA, Lieberman AP, Porter FD. J Inherit Metab Dis. 2013 [Google Scholar]
- 52.Sensi SL, Paoletti P, Bush AI, Sekler I. Nat Rev Neurosci. 2009;10:780–791. doi: 10.1038/nrn2734. [DOI] [PubMed] [Google Scholar]
- 53.Bitanihirwe BK, Cunningham MG. Synapse. 2009;63:1029–1049. doi: 10.1002/syn.20683. [DOI] [PubMed] [Google Scholar]
- 54.Totenhagen JW, Lope-Piedrafita S, Borbon IA, Yoshimaru ES, Erickson RP, Trouard TP. J Magn Reson Imaging. 2012;35:528–536. doi: 10.1002/jmri.22837. [DOI] [PMC free article] [PubMed] [Google Scholar]
- 55.Prasad AS, Miale A, Jr., Farid Z, Sandstead HH, Schulert AR. J Lab Clin Med. 1963;61:537–549. [PubMed] [Google Scholar]
- 56.Sandstead HH. Advances in nutrition. 2013;4:76–81. doi: 10.3945/an.112.003186. [DOI] [PMC free article] [PubMed] [Google Scholar]
- 57.An WL, Bjorkdahl C, Liu R, Cowburn RF, Winblad B, Pei JJ. J Neurochem. 2005;92:1104–1115. doi: 10.1111/j.1471-4159.2004.02948.x. [DOI] [PubMed] [Google Scholar]
- 58.Mo ZY, Zhu YZ, Zhu HL, Fan JB, Chen J, Liang Y. J Biol Chem. 2009;284:34648–34657. doi: 10.1074/jbc.M109.058883. [DOI] [PMC free article] [PubMed] [Google Scholar]
- 59.Auer IA, Schmidt ML, Lee VM, Curry B, Suzuki K, Shin RW, Pentchev PG, Carstea ED, Trojanowski JQ. Acta Neuropathol. 1995;90:547–551. doi: 10.1007/BF00318566. [DOI] [PubMed] [Google Scholar]
- 60.Sawamura N, Gong JS, Garver WS, Heidenreich RA, Ninomiya H, Ohno K, Yanagisawa K, Michikawa M. J Biol Chem. 2001;276:10314–10319. doi: 10.1074/jbc.M009733200. [DOI] [PubMed] [Google Scholar]
- 61.Treiber-Held S, Distl R, Meske V, Albert F, Ohm TG. J Pathol. 2003;200:95–103. doi: 10.1002/path.1345. [DOI] [PubMed] [Google Scholar]
- 62.Distl R, Meske V, Ohm TG. Acta Neuropathol. 2001;101:547–554. doi: 10.1007/s004010000314. [DOI] [PubMed] [Google Scholar]
- 63.Craddock TJ, Tuszynski JA, Chopra D, Casey N, Goldstein LE, Hameroff SR, Tanzi RE. PLoS ONE. 2012;7:e33552. doi: 10.1371/journal.pone.0033552. [DOI] [PMC free article] [PubMed] [Google Scholar]
- 64.Kanninen KM, Grubman A, Caragounis A, Duncan C, Parker SJ, Lidgerwood GE, Volitakis I, Ganio G, Crouch PJ, White AR. Biology open. 2013;2:635–646. doi: 10.1242/bio.20134804. [DOI] [PMC free article] [PubMed] [Google Scholar]
- 65.Kanninen KM, Grubman A, Meyerowitz J, Duncan C, Tan JL, Parker SJ, Crouch PJ, Paterson BM, Hickey JL, Donnelly PS, Volitakis I, Tammen I, Palmer DN, White AR. PLoS ONE. 2013;8:e58644. doi: 10.1371/journal.pone.0058644. [DOI] [PMC free article] [PubMed] [Google Scholar]
- 66.Terman A, Kurz T. Antioxid Redox Signal. 2013;18:888–898. doi: 10.1089/ars.2012.4885. [DOI] [PubMed] [Google Scholar]
Associated Data
This section collects any data citations, data availability statements, or supplementary materials included in this article.