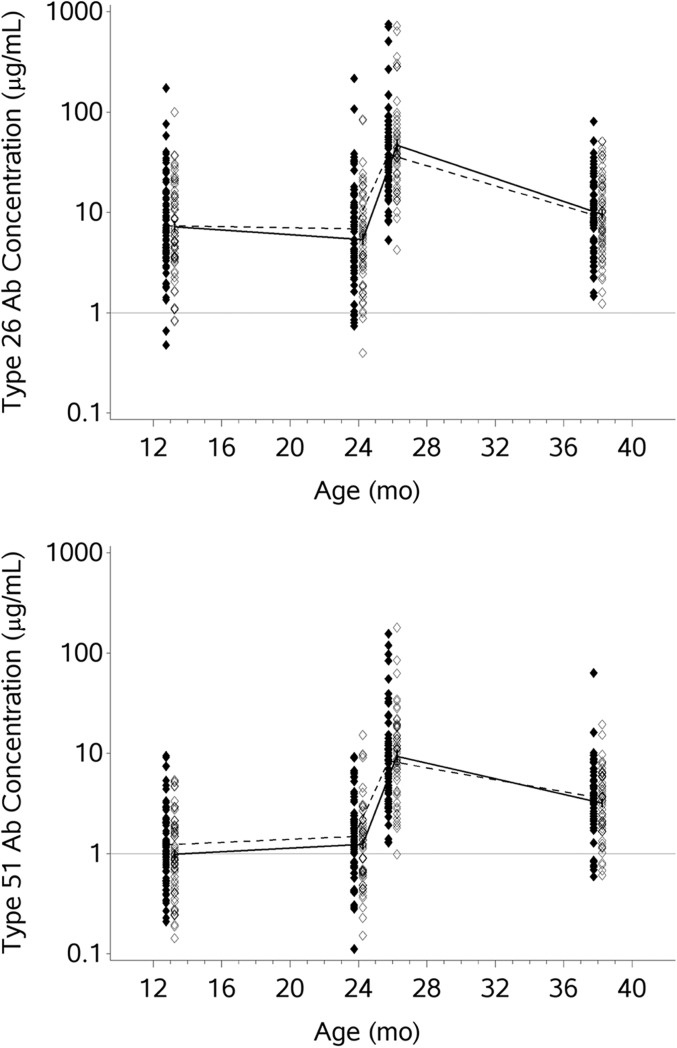
FIGURE 3.
Semilogarithmic plot of IgG antibody concentrations to pneumococcal polysaccharide serotypes 26 (6B) and 51 (7F). Individual patients are represented by scatterplot symbols corresponding to their IgG antibody concentration at pretreatment, age 24 months, age 26 months, and end of study. Plot symbols of patients randomly assigned to hydroxyurea are offset left solid diamonds, with geometric means connected by dashed line. Plot symbols of patients randomly assigned to placebo are offset right open diamonds, with geometric means connected by unbroken line.

