

Abstract
Segmenting brain from non-brain tissue within magnetic resonance (MR) images of the human head, also known as skull-stripping, is a critical processing step in the analysis of neuroimaging data. Though many algorithms have been developed to address this problem, challenges remain. In this paper, we apply the “deformable organism” framework to the skull-stripping problem. Within this framework, deformable models are equipped with higher-level control mechanisms based on the principles of artificial life, including sensing, reactive behavior, knowledge representation, and proactive planning. Our new deformable organisms are governed by a high-level plan aimed at the fully-automated segmentation of various parts of the head in MR imagery, and they are able to cooperate in computing a robust and accurate segmentation. We applied our segmentation approach to a test set of human MRI data using manual delineations of the data as a reference “gold standard.” We compare these results with results from three widely used methods using set-similarity metrics.
Index Terms: deformable organisms, skull-stripping, MRI, deformable models, segmentation
1. INTRODUCTION
Skull-stripping is the process of segmenting brain from non-brain tissues (e.g., skull, scalp, eyes, or neck) in whole-head magnetic resonance (MR) images. Delineating the brain region is important for applications such as surgical planning [1]; analysis of brain images, where removing non-brain structures allows all subsequent analysis to focus on the brain voxels specifically; or in brain registration [2, 3]. Skull-stripping can also perform an important role in extracting cortical surface models [4], in analyzing how the brain changes over time in longitudinal studies [5], and in examining how the brain is affected by disease [6].
Skull-stripping can be performed manually, and manually delineated brain masks are typically used as the “gold standard” to validate automatic brain extraction algorithms. Manual skull-stripping takes a substantial amount of time to complete for a MRI volume, and many groups have developed automated algorithms to address this problem. Still, users often resort to manual clean-up of automated skull-stripping results or will forgo the use of automated algorithms entirely. Achieving better reliability in automated skull-stripping algorithms remains an important research problem, as this would be less labor-intensive while also reducing rater variation across sets of images. Figure 1 shows a manual identification of the brain (green) in a T1 MR image of the head (red).
Fig. 1.
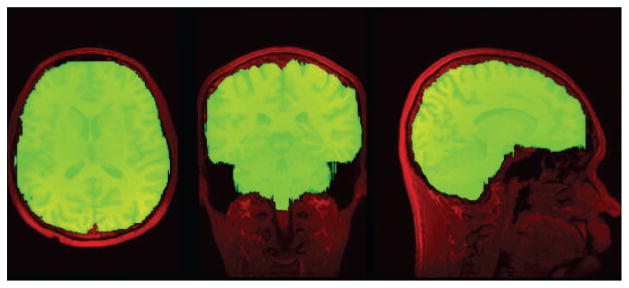
T1 MR image (red) with the brain location manually identified in green.
Many automated approaches have been described in the literature and made available publicly. The Brain Surface Extractor (BSE) applies Marr-Hildreth edge detection to the image to obtain a connected component that represents the brain; it then applies morphological operations to remove erroneous connected regions and to produce a smooth brain mask [7]. In some cases, the erosion may fail to completely separate the brain from the surrounding tissues, which can lead to attached skull, scalp, or dura. The Brain Extraction Tool (BET) [8] uses a deformable model that evolves into the shape of the brain by relying on local information in the image. This method is more robust for images where certain areas do not have a clear boundary between the brain and non-brain tissue, but it does not incorporate anatomical tissue regions and their relative positions. The Hybrid Watershed Algorithm (HWA) [9], applies the watershed algorithm to the MR image to obtain a rough estimate of the brain region, then fits a deformable surface to the region, and allows it to deform based on geometric constraints and a statistical atlas. Comparisons of these and other skull-stripping algorithms have appeared in [10].
In this paper, we introduce the application of “deformable organisms” [11] to the problem of skull-stripping1. Within the deformable organisms framework, deformable models are equipped with higher-level control mechanisms based on the principles of artificial life. These mechanisms include sensing, reactive behavior, knowledge representation, and proactive planning. Our new deformable organisms are governed by a high-level plan aimed at fully-automated segmentation of various parts of the head in MR images, and they cooperate in computing the segmentation. The organisms make use of local information, such as edges, along with global image tissue classifications from K-means clustering. Their intermediate goals of finding easily recognized features in the image make the final segmentation more robust.
2. METHODS
2.1. Image Processing
The subject T1 MR of the head is first processed so that its results are available to the deformable organisms as they segment the brain. The organisms are embedded in the image space and “sense” the processed images by analyzing the intensities around them.
The images are processed in various ways to make different types of information available to the sensors of the organisms. The basic T1 weighted MR image consists of a volume grayscale intensity image and is used as a base for three different types of processing.
The gradient of the base MR image is computed to create an image that emphasizes the edges.
A threshold is applied to the base image by finding a histogram of the intensities and processing it to classify voxels lying within the head from those of the surrounding air in the image.
Once a threshold has been applied to the image, a K-Means classification is used to classify the head voxels into K different classes. In our case we set K to 2 and 3 (Figure 2). The brain region is actually composed of two tissue types, but the rest of the head adds interference into the classification.
Fig. 2.
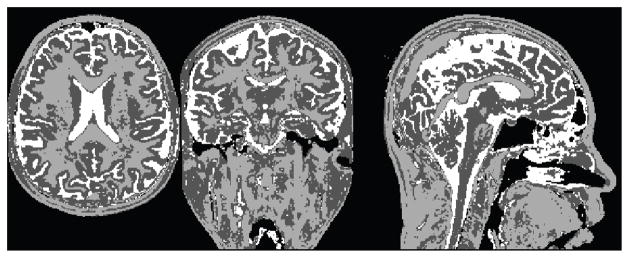
3-Means classification of a T1 MR image. The intensities are mapped to three different labels, segmenting it into three areas.
2.2. Deformable Organisms
Our deformable organisms combine representations and control mechanisms of various different types, as outlined below. Each layer is customized to whatever needs to be segmented, in our case we focus on the brain.
2.2.1. Geometry and Physics
Each deformable organism is represented geometrically as a 3D triangulated mesh. The models are initialized in the shapes of spheres that either contract or expand to find the boundary of the object being modeled. Each geometric model is deformed iteratively to model different structures in the MR images. Each vertex on the mesh is moved either inwards or outwards along the direction of the normal vector at that point. At each iteration, Laplacian smoothing is applied to the mesh to constrain the movement of each vertex in order to maintain a smooth mesh that does not pass through itself.
2.2.2. Perception
The perception layer enables the organism to sense the medical image in which it is embedded. The vertices of the triangulated mesh are represented in real coordinates embedded in a volume image represented by a set of voxels. Hence, nearest neighbor interpolation was used to sample the image intensities at the location of a certain point in the mesh. The locations of all the organisms in the image are computed by the perception layer. A 3D rasterization method followed by dilation is used to calculate which voxels in the volume are located within each organism. The dilation is required to deal with the discrepancy between the low resolution of the volume image in which meshes are embedded. When the mesh is rasterized it will conservatively choose a voxel that is only partly intersected by the mesh and thus remove too many voxels from the boundary. The dilation helps to fit the border voxels better to the boundary of the mesh and resolve this discrepancy. This information is used by the motor control layer to regulate where an organism is allowed to deform by restricting organisms from intersecting each other.
2.2.3. Motor Control
The motor control of the organism is a function of intensities along the line normal to the mesh surface going through each vertex. The intensities along this line are from the images available to the perception layer. This layer looks for or avoids a particular intensity or relative intensity or tries to fit a certain model or statistic to the data along these lines. The intensities along the normal lines are sampled from different types of sensors and can each be processed using a different set of constraints.
2.2.4. Behavior
The organism has a repertoire of behaviors. Translation is a behavior that moves a particular organism rigidly without any deformation to the mesh, as does the rotation behavior. These behaviors can take into account the organism’s relationship to other organisms and use information about their locations to decide how to move rigidly. Another behavior is the local deformation of the mesh. This behavior also depends on sensing different information, various motor controls, and the locations of surrounding organisms. Thus high level information about locating different regions in the image can be used to create a plan for segmentation.
2.2.5. Cognition
The cognitive layer is created by putting together a set of behaviors to accomplish certain goals. Different behaviors can be activated dynamically depending on what goals have been accomplished or what features have or need to be located.
2.3. Skull-Stripping Plan
Figure 3 shows the image processing steps and the organism plan. The red arrow points to the processing of the T1 MR image. The black arrows show the image and location dependencies at each step. The images are sensed at various stages in the organism plans. When a structure is found, its location can be helpful when locating other structures. For instance, the deformation of the brain utilizes the location of the skin and the eyes to figure out the bounds of where it can expand.
Fig. 3.
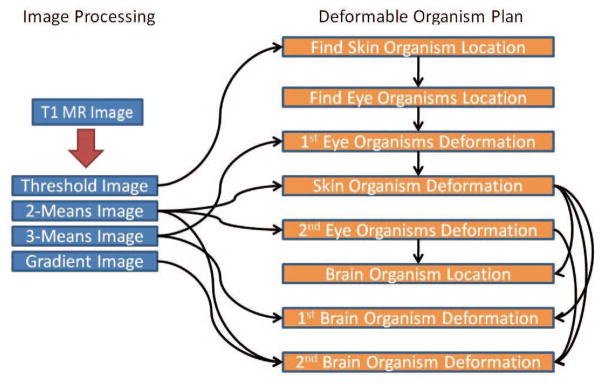
The flow of data and steps of the algorithm. The red arrow shows processing steps for the image and the black arrows represent information that is being passed.
The Skull-Stripping plan dictates which organisms are used, the goals for each organism and how the organisms interact. It begins by finding the location of a skin organism that surrounds the head. Then using the skin organism’s location and shape, two eye organisms are spawned. Finally, a brain organism is created that interacts with the three other organisms to refine its own location.
Figure 4 shows an example of the organism deformations and interactions during the skull-stripping process. The skin organism is initialized as a large spherical triangulated mesh that is deformed into the surface of the head using the threshold of the initial MR image (Fig. 4A and 4B). The skin organism is then processed to locate the nose. This information is used to locate the eyes (Fig. 4C and 4D). Figure 4D shows the two eye organisms expanded to the full size of the eye by sensing the 3-Means classification of the MR image. Once this is complete, the skin organism again deforms to locate the area surrounding the brain by deforming through the eyes by sensing their locations and by using edge information from the 2-Means classified image as shown in Fig. 4E. In Fig. 4F, the eyes are again deformed by sensing the 2-Means image to take into account the surrounding tissues and to restrict more areas that the brain organism may try to expand into. Then using the location of the eyes and skin meshes a brain organism is spawned (Fig. 4G) that deforms itself to match the classification of tissues in the 3-Means image and to stay within the skin mesh and complete the segmentation of the brain (Fig. 4H).
Fig. 4.

This figure shows the sequential steps that the skin (yellow), eye (red), and brain (cyan) organisms use to skull-strip the head image.
Figure 5 shows how the brain organism interacts with the skin (yellow) and eye (red) organisms. Figure 5A shows how the brain organism (cyan) is expanding by sensing the image forces from the 3-Means classification of the image. The blue arrows show the direction in which the brain organism is deforming. Figure 5B shows that the organism is restricted by the skin and eye organisms as it pushes outwards. It is able to sense the locations of the other organisms and is forced to stay within the boundary as shown by the red arrows.
Fig. 5.

Interactions between the brain (cyan), eye (red), and skin (yellow) organisms. The arrows (blue) in Subfigure A show how the brain organism is expanding and Subfigure B has arrows (red) showing how its movement is restricted by the other organisms.
2.4. Implementation
Operations and processing of the MR images was implemented using the Insight Toolkit (ITK)2, an open-source C++ library for medical image analysis. The mesh operations and the visualization of the deformable organisms was completed using the Visual Toolkit (VTK)3, an open-source C++ library for 3D graphics, visualization, and image processing.
The entire deformable organisms method for skull-stripping takes less than three minutes on an Intel 2GHz machine with 1.50 GB of RAM to segment an MR image.
2.5. Evaluation
We evaluated the performance of our algorithm using the Segmentation Validation Engine (SVE; http://sve.loni.ucla.edu), a web-based resource that we developed previously [13]. SVE provides a set of 40 human whole-head T1-weighted MR images of 256 ×124 ×256 voxels (voxel size 0.86 × 1.50 × 0.86 mm3) that were delineated manually as part of the LONI Probabilistic Brain Atlas (LPBA40) [14]. The 40 images were downloaded and processed with our algorithm. The brain masks were then uploaded to the SVE server, which computed a series of measures comparing our brain masks with the manually-delineated masks. The overlap metrics used were the Jaccard Similarity, the Dice Coefficient, Sensitivity, and Specificity; these are described in [13]. Validation results are archived, allowing comparison with previously evaluated methods.
3. RESULTS
We applied the algorithm to a set of data, compared it to three existing algorithms, and validated the results.
3.1. Other Algorithms
The deformable organism framework for skull-stripping was compared with FSL’s Brain Extraction Tool (BET) [8] (version: BETv2.1 settings: -B), the Brain Surface Extractor (BSE) [7] (version: BSEv08b settings: -n 5 -d 15 -s 0.65 -p –noneck), and the Hybrid Watershed (HWA) [9] (version: HWA3 settings: -less).
Table 1 shows the mean for each of the metrics across the 40 images used to test the algorithms [mean±S.D.]. The results from the SVE false positive and false negative projection maps showed that the method includes too many voxels around the cerebellum lobe and the inferior and anterior portions of the temporal lobe. These can be improved through refining the parameters in the behavior layer. The method does do a good job at delineating the area around the medial longitudinal fissure (the groove separating the two hemispheres of the brain) and the anterior part of the parietal lobe when compared to the other algorithms.
Table 1.
Results from the application on the LPBA40 dataset of deformable organisms (DO), the brain extraction tool (BET), and the brain surface extractor (BSE). [mean±S.D.]
| Method | Jaccard | Dice | Sensitivity | Specificity |
|---|---|---|---|---|
| DO | 0.8954±0.0288 | 0.9446±0.0163 | 0.9616±0.0129 | 0.9864±0.0082 |
| BSE | 0.9431±0.0282 | 0.9705±0.0158 | 0.9747±0.0334 | 0.9941±0.0019 |
| BET | 0.9310±0.0089 | 0.9642±0.0048 | 0.9875±0.0117 | 0.9892±0.0014 |
| HWA | 0.8537±0.0184 | 0.9210±0.0107 | 0.9992±0.0003 | 0.9695±0.0053 |
4. DISCUSSION
The use of deformable organisms to segment the brain in whole head human MR images can help in cases where other algorithms include areas of tissue around the eyes and cases where they include parts of the skin. This method could help in difficult cases where those boundaries are hard to delineate. The behaviors within the deformable organisms framework can be customized to perform different specific brain segmentation tasks. If a brain study was sensitive to a particular lobe in the brain then the organisms could be customized so that area had better accuracy during the skull-stripping process.
It also allows the segmentation process to be sensitive to many different types of image information. In our case we process the images using K-Means classification, a threshold, and the gradient. Each organism has its own set of goals and new organisms can build off of what has already been accomplished in the segmentation task. The deformable organisms framework also easily allows the addition of components using different types of images and the use of additional deformations to improve segmentation performance.
The evaluation of the algorithm showed the areas of the brain where the deformable organisms approach needs more tuning and where it provides good results. The ability for each organism to be customized could allow for development of a skull-stripping plan customized for each area of the brain.
Footnotes
[12] proposed a framework similar to deformable organisms for segmenting IntraVascular UltraSound (IVUS) images. Their work, however, focused on establishing a set of rules that multiple agents can use to communicate in order to solve particular medical image segmentation tasks.
References
- 1.Gering DT, Nabavi A, Kikinis R, Hata N, ODonnell LJ, Grimson WEL, Jolesz FA, Black PM, Wells WM., III An integrated visualization system for surgical planning and guidance using image fusion and an open MR. Journal of Magnetic Resonance Imaging. 2001;13:967–975. doi: 10.1002/jmri.1139. [DOI] [PubMed] [Google Scholar]
- 2.Woods RP, Dapretto M, Sicotte NL, Toga AW, Mazziotta JC. Creation and use of a Talairach-compatible atlas for accurate, automated, nonlinear intersubject registration, and analysis of functional imaging data. Human Brain Mapping. 1999;8(2–3):73–79. doi: 10.1002/(SICI)1097-0193(1999)8:2/3<73::AID-HBM1>3.0.CO;2-7. [DOI] [PMC free article] [PubMed] [Google Scholar]
- 3.Klein A, Andersson J, Ardekani BA, Ashburner J, Avants B, Chiang MC, Christensen GE, Collins DL, Gee J, Hellier P, et al. Evaluation of 14 nonlinear deformation algorithms applied to human brain MRI registration. NeuroImage. 2009;46(3):786–802. doi: 10.1016/j.neuroimage.2008.12.037. [DOI] [PMC free article] [PubMed] [Google Scholar]
- 4.Dale AM, Fischl B, Sereno MI. Cortical Surface-Based Analysis* 1:: I. Segmentation and Surface Reconstruction. NeuroImage. 1999;9(2):179–194. doi: 10.1006/nimg.1998.0395. [DOI] [PubMed] [Google Scholar]
- 5.Resnick SM, Pham DL, Kraut MA, Zonderman AB, Davatzikos C. Longitudinal magnetic resonance imaging studies of older adults: a shrinking brain. Journal of Neuroscience. 2003;23(8):3295–3301. doi: 10.1523/JNEUROSCI.23-08-03295.2003. [DOI] [PMC free article] [PubMed] [Google Scholar]
- 6.Thompson PM, Hayashi KM, De Zubicaray G, Janke AL, Rose SE, Semple J, Herman D, Hong MS, Dittmer SS, Doddrell DM, et al. Dynamics of gray matter loss in Alzheimer’s disease. Journal of Neuroscience. 2003;23(3):994–1005. doi: 10.1523/JNEUROSCI.23-03-00994.2003. [DOI] [PMC free article] [PubMed] [Google Scholar]
- 7.Shattuck DW, Sandor-Leahy SR, Schaper KA, Rottenberg DA, Leahy RM. Magnetic resonance image tissue classification using a partial volume model. NeuroImage. 2001;13(5):856–876. doi: 10.1006/nimg.2000.0730. [DOI] [PubMed] [Google Scholar]
- 8.Smith SM. Fast robust automated brain extraction. Human Brain Mapping. 2002;17(3):143–155. doi: 10.1002/hbm.10062. [DOI] [PMC free article] [PubMed] [Google Scholar]
- 9.Segonne F, Dale AM, Busa E, Glessner M, Salat D, Hahn HK, Fischl B. A hybrid approach to the skull stripping problem in MRI. NeuroImage. 2004;22(3):1060–1075. doi: 10.1016/j.neuroimage.2004.03.032. [DOI] [PubMed] [Google Scholar]
- 10.Fennema-Notestine C, Ozyurt IB, Clark CP, Morris S, Bischoff-Grethe A, Bondi MW, Jernigan TL, Fischl B, Segonne F, Shattuck DW, et al. Quantitative evaluation of automated skull-stripping methods applied to contemporary and legacy images: effects of diagnosis, bias correction, and slice location. Human brain mapping. 2006;27(2):99–113. doi: 10.1002/hbm.20161. [DOI] [PMC free article] [PubMed] [Google Scholar]
- 11.McInerney T, Hamarneh G, Shenton M, Terzopoulos D. Deformable organisms for automatic medical image analysis. Medical Image Analysis. 2002;6(3):251–266. doi: 10.1016/s1361-8415(02)00083-x. [DOI] [PMC free article] [PubMed] [Google Scholar]
- 12.Bovenkamp EGP, Dijkstra J, Bosch JG, Reiber JHC. Multi-agent segmentation of IVUS images. Pattern Recognition. 2004;37(4):647–663. [Google Scholar]
- 13.Shattuck DW, Prasad G, Mirza M, Narr KL, Toga AW. Online resource for validation of brain segmentation methods. NeuroImage. 2009;45(2):431–439. doi: 10.1016/j.neuroimage.2008.10.066. [DOI] [PMC free article] [PubMed] [Google Scholar]
- 14.Shattuck DW, Mirza M, Adisetiyo V, Hojatkashani C, Salamon G, Narr KL, Poldrack RA, Bilder RM, Toga AW. Construction of a 3D probabilistic atlas of human cortical structures. NeuroImage. 2008;39(3):1064–1080. doi: 10.1016/j.neuroimage.2007.09.031. [DOI] [PMC free article] [PubMed] [Google Scholar]