Abstract
The simultaneous assessment of insulin action, secretion, and hepatic extraction is key to understanding postprandial glucose metabolism in nondiabetic and diabetic humans. We review the oral minimal method (i.e., models that allow the estimation of insulin sensitivity, β-cell responsivity, and hepatic insulin extraction from a mixed-meal or an oral glucose tolerance test). Both of these oral tests are more physiologic and simpler to administer than those based on an intravenous test (e.g., a glucose clamp or an intravenous glucose tolerance test). The focus of this review is on indices provided by physiological-based models and their validation against the glucose clamp technique. We discuss first the oral minimal model method rationale, data, and protocols. Then we present the three minimal models and the indices they provide. The disposition index paradigm, a widely used β-cell function metric, is revisited in the context of individual versus population modeling. Adding a glucose tracer to the oral dose significantly enhances the assessment of insulin action by segregating insulin sensitivity into its glucose disposal and hepatic components. The oral minimal model method, by quantitatively portraying the complex relationships between the major players of glucose metabolism, is able to provide novel insights regarding the regulation of postprandial metabolism.
Introduction
The simultaneous assessment of insulin action, insulin secretion, and hepatic extraction is key to understanding postprandial glucose metabolism in nondiabetic and diabetic humans and to putting therapeutic actions on solid quantitative grounds (1,2). We review in this study the oral minimal method (i.e., models that allow the estimation of insulin sensitivity [SI], β-cell function, and hepatic insulin extraction from an oral glucose test—either a mixed-meal tolerance test [MTT] or an oral glucose tolerance test [OGTT]). Both of these oral tests are more physiologic and simpler to administer than those based on an intravenous test (e.g., a glucose clamp or an intravenous glucose tolerance test [IVGTT]), with MTT being superior to OGTT due to the presence of other macronutrient components (proteins and fat). We will concentrate on the indices provided by physiological-based models and their validation against the glucose clamp technique. Surrogate MTT/OGTT indices are not discussed since their general validity has been questioned (3). Also, indices based on basal glucose and insulin levels are not discussed since they do not measure postprandial glucose metabolism and what they measure is not clear (4).
Sitting on the IVGTT Minimal Model's Giant Shoulders
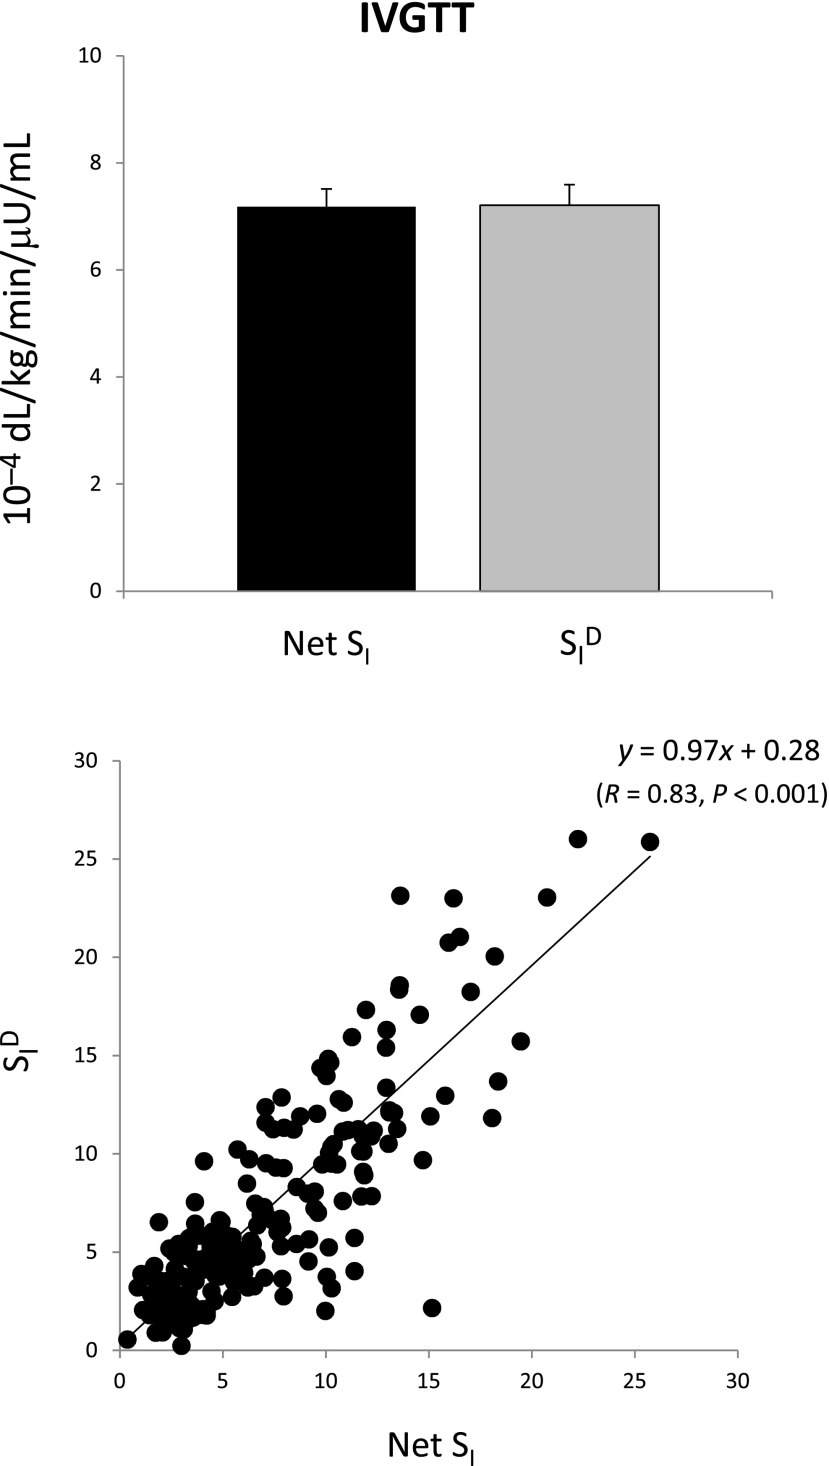
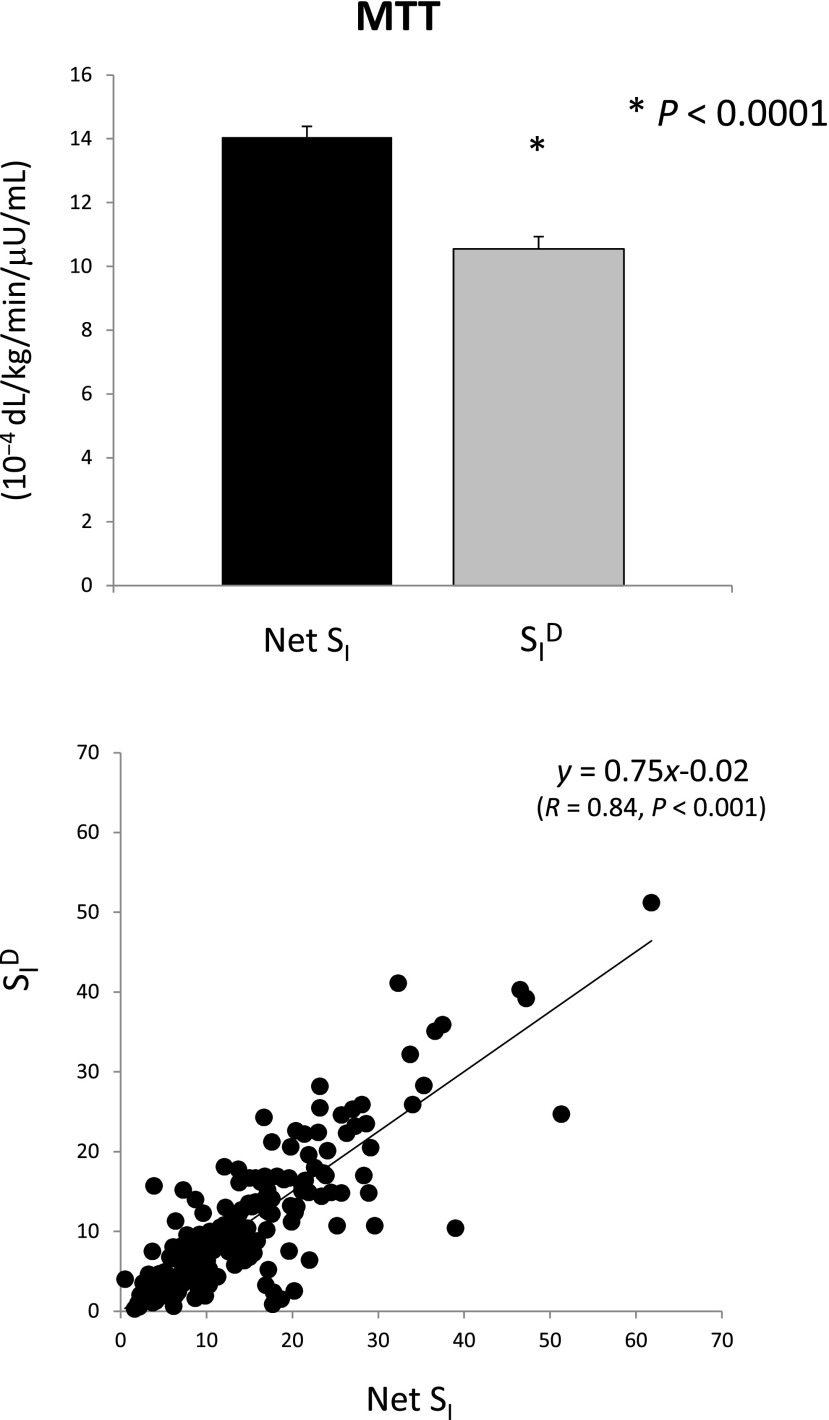
The oral minimal model method sits on the giant shoulders of the IVGTT minimal model method (5), particularly taking advantage of two revolutionary concepts introduced in 1979: 1) the system is decomposed (partitioned) into a glucose and insulin subsystem, thus allowing individual modeling of each system using, respectively, measured concentrations of plasma insulin and glucose as known inputs, and 2) insulin action takes place within a compartment remote from plasma (known today to be the interstitium). Paradoxically, the IVGTT seems simpler to model since one knows the exact nature of the input (i.e., the glucose dose injected intravenously). However, modeling glucose dynamics after the bolus is complex: the single compartment representation may undermodel the system complexity with potential bias introduced (e.g., on SI) (6,7). Fig. 1 exemplifies such a structural problem: net SI (i.e., insulin stimulatory effect on peripheral and liver glucose disposal plus inhibitory effect on endogenous glucose production [EGP] [x-axis]), rather than being greater than disposal SI, is virtually the same as disposal SI (SID, i.e., the stimulatory effect alone [y-axis]) (7.18 ± 0.33 vs. 7.21 ± 0.39 10−4 dL/kg/min/μU/mL), clearly indicating the inadequacy of the model (8). Also, the widely used IVGTT approach to assess β-cell function only uses the acute insulin response (i.e., the area under the insulin concentration curve of the first 10 min); since peripheral insulin concentrations represent the sum of insulin secretion and hepatic extraction, this measure can potentially be confounded by hepatic insulin extraction, as discussed in Cobelli et al. (9). To improve the quantitation of β-cell function, a C-peptide IVGTT minimal model has been developed that allows us to estimate first- and second-phase β-cell responsivity (10) and also, in conjunction with the IVGTT insulin minimal model, hepatic insulin extraction (11). Finally, a clinical shortcoming of the IVGTT method is that it does not allow assessment of therapies or interventions that modulate the intestinal contribution to insulin secretion (e.g., incretin-based therapies).
Figure 1.
Net SI (i.e., insulin action on glucose disposal and production) versus SID (i.e., insulin action on glucose disposal only from IVGTT data).
The Oral Minimal Model Method: Rationale, Data, and Protocols
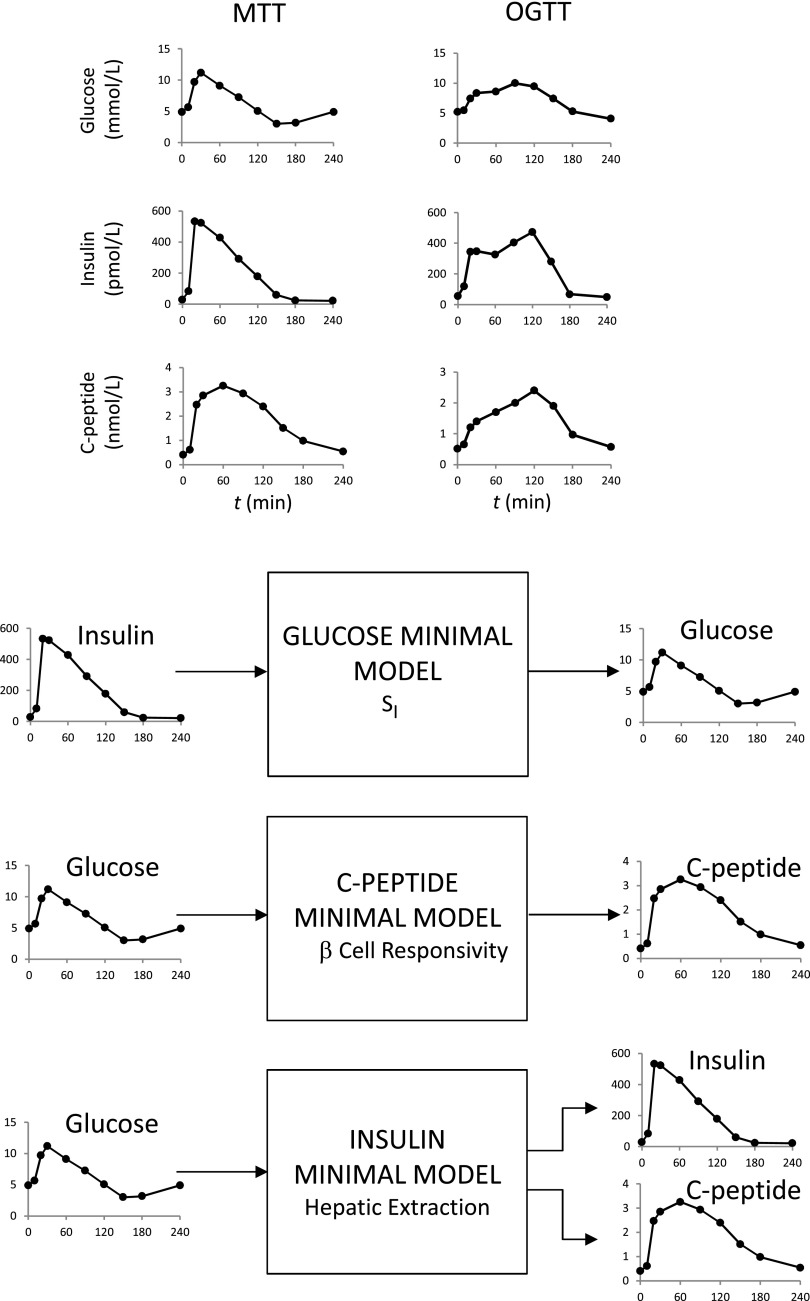
Historically, the oral minimal model method has been facilitated by a series of triple tracer meal studies that have provided a rich database for model development and validation (8). The MTT and OGTT data needed for the method are shown in Fig. 2 (top). The system partition analysis originally proposed for the IVGTT is also used in this study. What is the rationale underlying this? For instance, to describe plasma glucose and insulin data after an OGTT, there is a need to simultaneously model both the glucose and insulin system and their interactions. This means that, in addition to needing to model insulin action, one also has to model glucose-stimulated insulin secretion. Since, by definition, models are never perfect, they always will be “wrong”; therefore, an error in the insulin secretion model would be compensated for by an error in the insulin action model, thus introducing a bias in SI. To avoid this potential source of error, the dynamic contribution of a subsystem can be eliminated. Such a loop opening can be accomplished in several ways: by gross surgical manipulation of the systems, using an external-feedback loop to clamp the level of specific system variables, or infusing certain substances that inhibit the endogenous elaboration of some feedback signals. All of these techniques are invasive, and most are not applicable to humans, at least on a routine basis. In contrast, system partition is an artificial loop cut: the system is decomposed in two subsystems that are linked together by measured variables (Fig. 2, bottom). The insulin subsystem represents all tissues secreting, distributing, and degrading insulin, and the glucose subsystem represents all tissues producing, distributing, and metabolizing glucose. When the system is perturbed (e.g., by an MTT/OGTT) and the time courses of plasma glucose, insulin, and C-peptide are measured, then the time courses of insulin and glucose can be considered as “input” (assumed known) and “output” (assumed noisy), respectively, to measure SI; those of glucose and C-peptide to measure β-cell function; and those of glucose and insulin plus C-peptide to measure hepatic insulin extraction. In this way, models are developed not for the whole system but for each of the subsystems, independently, thus considerably reducing the difficulties of the modeling exercise.
Figure 2.
Top: MTT (left) and OGTT (right) plasma glucose (top), insulin (middle), and C-peptide (bottom) in the same subject. Bottom: Partition analysis of the system allows us to separately estimate SI, β-cell responsivity, and hepatic extraction without the confounding effect of the two other parameters. Relevant input and output signals of the three models are shown.
Fig. 2 shows the desirable MTT/OGTT 10-sample schedule (0, 10, 20, 30, 60, 90, 120, 150, 180, and 240 min), but an 8-sample reduced schedule (0, 10, 20, 30, 60, 90, 120, and 180 min) still provides accurate results at the individual level (in severe type 2 diabetes, an additional 240-min time point may help for estimating SI). The story is different if the interest is in assessing indices at the population level (see ref. 12 for a 7-sample schedule in nondiabetic and prediabetic subjects).
The Oral Glucose Minimal Model
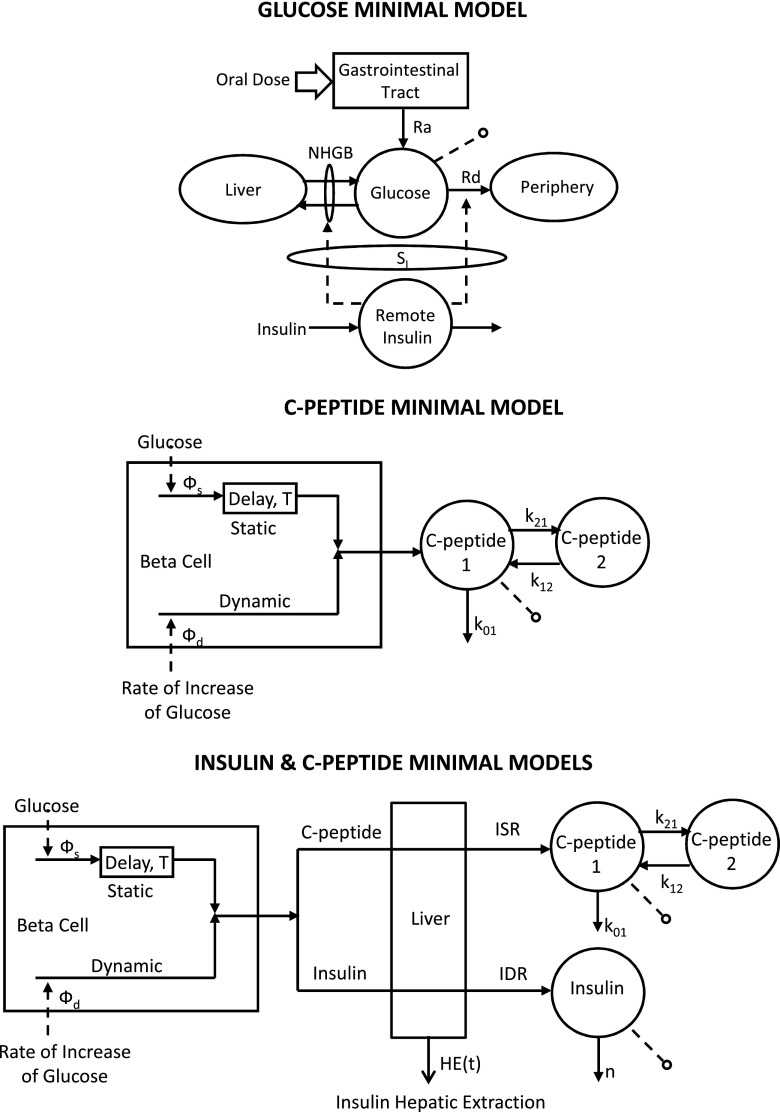
The oral glucose minimal model is shown in Fig. 3 (top). It resembles the classic single-compartment IVGTT minimal model but has a new element, the gastrointestinal tract, which has as input the oral dose. Of note is that, given the much smoother time course of plasma glucose and insulin during an oral test versus IVGTT, a single-compartment model is able to accurately describe glucose kinetics [in the IVGTT minimal model, in order to use a single-compartment glucose kinetics representation, one has to ignore the first 10 min of glucose data; a two-compartment model is needed to describe IVGTT glucose kinetics in their integrity (6,13)].
Figure 3.
The oral glucose minimal models that allow us to estimate SI (top), β-cell responsivity (middle), and hepatic insulin extraction (bottom).
Denoting by Q the plasma glucose mass, Rd the rate of plasma glucose disappearance, Ra the rate of glucose appearance in plasma from the oral input, and NHGB the net hepatic glucose balance, the system-measurement model equations are as follows:
 |
where G is plasma glucose concentration, V the glucose distribution volume, and subscript b denotes basal value.
By assuming that Rd and NHGB are linearly dependent on Q but modulated by insulin in a remote (vs. plasma) compartment, as proposed in Bergman et al. (5), one obtains the following (14):
 |
where SG is fractional (i.e., per-unit distribution volume) glucose effectiveness measuring glucose ability per se to promote glucose disposal and inhibit NHGB, I plasma insulin concentration, and X insulin action on glucose disposal and production, with p2 and p3 as rate constants describing its dynamics and magnitude. Ra is described as a piecewise linear function with known break point ti and unknown amplitude αi,
 |
otherwise with α denoting [α1, α2,…α8]T and α0 = 0.
SI is given by:
 |
A piecewise linear description for Ra with eight parameters is sufficiently flexible to accommodate MTT/OGTT data. The input of the model is the measured plasma insulin concentration; plasma glucose concentration is the output to be fitted by the model. The addition of the parameter vector α renders the model more complex, and it can be shown that it is not a priori uniquely identifiable because V is nonidentifiable, and SG is nonuniquely identifiable (two solutions). Thus, there is the need to assume V and SG to be known, usually fixed to population values. To improve numerical identifiability, a Maximum a Posteriori Bayesian estimator is used, exploiting some prior on p2 and a constraint on Ra, related to the total amount of glucose appearing in the circulation. SI can be precisely estimated and has been validated both against a multiple tracer meal protocol (15) and in an OGTT versus euglycemic glucose clamp study (16) showing a correlation of 0.86 and 0.81, respectively. The MTT SI has been also correlated with that obtained during an IVGTT in the same subjects, showing a correlation of 0.74. MTT SI was also compared with OGTT SI in 62 subjects with different degrees of glucose tolerance (17): correlation between the two was good (r = 0.75) but SI was significantly lower in MTT than OGTT.
SI is a steady-state measure of insulin action and does not account for how fast or slow insulin action takes place. To account for the timing of insulin action, the dynamic SI index, SIdyn, can be calculated (18,19) from SI and p2:
 |
where T = 60 min. SIdyn provides a more comprehensive picture of insulin action on glucose metabolism, which is especially important in prediabetic and diabetic subjects who exhibit both decreased and delayed insulin action. SI and SIdyn are macrophysiological parameters: they reflect insulin action in both suppressing glucose production and stimulating glucose transport and phosphorylation in muscle and adipose tissues. Segregating at least at the macroscopic level the two signals (i.e., insulin action on glucose production and glucose disposal) is possible by adding a tracer to the oral dose, as will be discussed later.
Intersubject variability of MTT SI index in healthy individuals is large but comparable to that of the IVGTT index in the same individuals (8). For what concerns the intrasubject variability, MTT SI reproducibility was assessed in Cobelli et al. (9) by calculating both the percent mean difference [D% = (study 1 − study 2)/mean (study 1, study 2)] and the coefficient of variation [CV% = |study 1 − study 2|/mean (study 1, study 2)]. In Cobelli et al. (9), D% and CV% were on average 8 and 23%, respectively. However, these measurements do not take into account the uncertainty of SI. This is an important limitation of the approach since SI is a model-based measurement from noisy data and, thus, can only be estimated with a certain CI.
The Oral C-Peptide Minimal Model
The model is shown in Fig. 3 (middle) and interprets plasma C-peptide concentration (the output) in relation to the observed changes in glucose concentration (the input) (20). The model is described as follows:
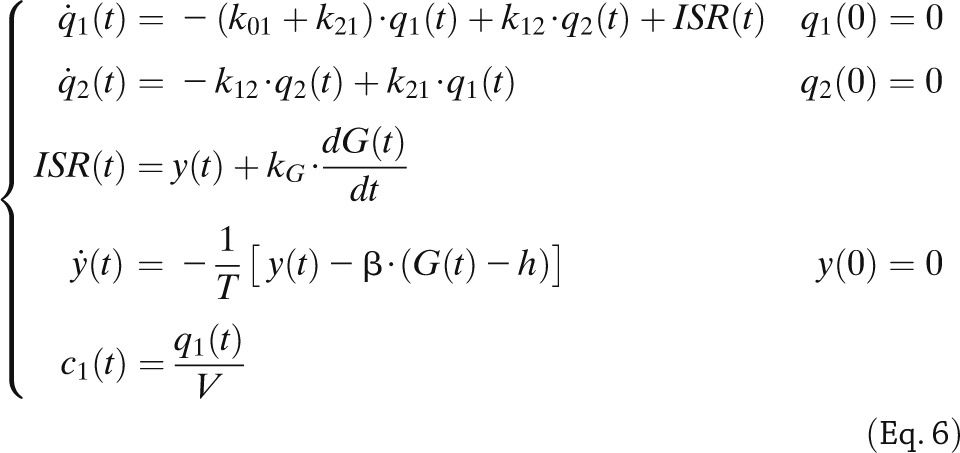 |
where q1 and q2 are, respectively, the above basal amount of C-peptide in the accessible and remote compartments (C-peptide 1 and 2 in Fig. 3, middle); k01, k12, and k21 are rate constants describing C-peptide kinetics; ISR is above basal C-peptide (insulin) secretion rate; y is insulin provision (i.e., the portion of synthesized insulin that reaches the cell membrane and can be released); and c1 is above basal C-peptide plasma concentration. ISR is made up of two components: one proportional, through parameter kG, to glucose rate of change (dG/dt), and one representing insulin release that, after a delay T, occurs proportionally to plasma glucose level above a threshold, h, through parameter β. The two components are termed, respectively, dynamic and static, and the parameters responsible for them: dynamic, Φd (= kG), and static, Φs (= β), responsivity indices. A single total responsivity index, Φ, which combines Φd and Φs, is often useful. The model is both a priori and a posteriori (numerically) uniquely identifiable once C-peptide kinetic parameters (k01, k12, k21, and V) are fixed using the population model proposed in Van Cauter et al. (21). The picture is markedly different from that of the IVGTT model, in which the incretin effect is absent, and the glucose signal is totally different, with the derivative component only contributing during the first 2 to 3 min and the proportional component for the rest of test. This explains the fact that dynamic Φd and static Φs during an MTT are 250% greater than first-phase, Φ1, and second-phase, Φ2, IVGTT indices in the same 204 individuals (8). Dynamic, Φd, and static, Φs, during an oral glucose challenge and IVGTT first-, Φ1, and second-phase, Φ2, indices bear some relation (r = 0.52 for both indices), but they are likely determined by different cellular events.
β-Cell responsivity indices during MTT were also compared with their OGTT counterparts in 62 subjects with different degrees of glucose tolerance (17): correlations were good (r = 0.71 for Φd, r = 0.73 for Φs, and r = 0.74 for Φ), but the indices were significantly higher in MTT than OGTT. Φd, Φs, and T are macrophysiological parameters, but thanks to recent multiscale modeling of insulin secretion (22,23), they can be given a cellular interpretation. In particular, Φd likely relates to exocytosis of insulin from secretory vesicles docked to the membrane, Φs reflects insulin granule translocation and maturation, and T the inherent delay in glucose-stimulated insulin secretion in order to permit granule mobilization and second-phase release (24). In this context, it is useful to comment on another widely used model to assess β-cell function (25). This model, like the model of Fig. 3 (middle), has both a proportional and derivative component, but there is no delay of supply of newly synthesized insulin to the circulation. The authors choose to account for the expected inability of a proportional plus derivative glucose control to describe the C-peptide data with a time-varying term correcting only the static component of insulin secretion, which has been called potentiation factor. This potentiation factor compensates the proportional plus derivative description deficiency but has no obvious mechanistic counterpart on the cellular level. In addition to the model structure, the methodology to numerically identify the model has also been questioned (see ref. 9 for detailed comments).
The C-peptide oral minimal model of Fig. 3 (middle) has been successfully used by Steil et al. (26) for describing hyperglycemic clamp C-peptide data as well as meals, thus providing further independent evidence of its validity (see also comments in ref. 27).
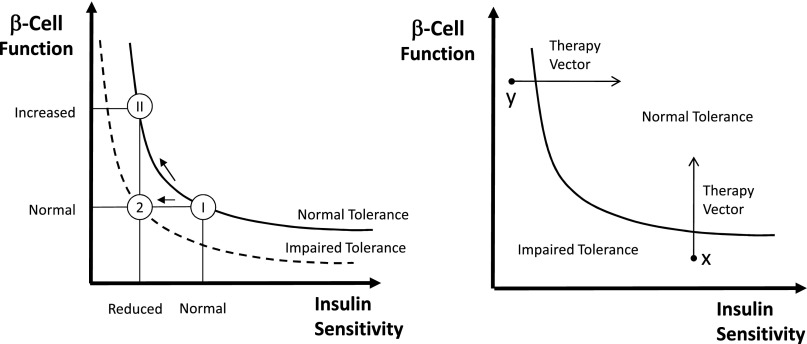
It is an accepted notion that β-cell function needs to be interpreted in light of the prevailing SI. One possibility is to resort to a normalization of β-cell function based on the disposition index (DI) paradigm, first introduced in 1981 (28), and recently revisited first in Cobelli et al. (9) and then in Denti et al. (29) in which β-cell function is multiplied by SI. This concept is clearly illustrated in Fig. 4 (left). While regulation of carbohydrate tolerance is undoubtedly more complex, it is conceivable that the glucose tolerance of an individual is related to the product of β-cell function and SI. In essence, different values of tolerance are represented by different hyperbolas (i.e., DI = β-cell function × SI = constant), and the individual’s β-cells’ ability to respond to a decrease in SI by adequately increasing insulin secretion can be assessed by measuring the product of β-cell function and SI. Thanks to its intuitive and reasonable grounds, this measure of β-cell function, which was first introduced for IVGTT, has become the method of choice also for MTT/OGTT. Thus, DIs can be calculated by multiplying responsivity indices Φd, Φs, and Φ by SI to determine if the first- and second-phase global β-cell function are appropriate in light of the prevailing SI. For instance, while SI was found to be significantly lower in MTT than OGTT and Φd, Φs, and Φ were found to be significantly higher in MTT than OGTT, the DI is the same with the two tests, making it a good marker of glucose tolerance (17).
Figure 4.
Schematic diagram to illustrate the importance of expressing β-cell responsivity in relation to SI by using the DI metric (i.e., the product of β-cell responsivity times SI is assumed to be a constant). Left: A normal subject (state I) reacts to impaired SI by increasing β-cell responsivity (state II), while a subject with impaired tolerance does not (state 2). In state II, β-cell responsivity is increased but the DI is unchanged, and normal glucose tolerance is retained normal; while in state 2, β-cell responsivity is normal but not adequate to compensate the decreased SI (state 2), and glucose intolerance is developed. Right: Impaired glucose tolerance can arise due to defects of β-cell responsivity and/or defects of SI. In this hypothetical example, subject x is intolerant due to his poor β-cell function, while subject y has poor SI. The ability to dissect the underlying physiological defects (SI or β-cell responsivity) allows us to optimize medical treatments.
Another important use of the DI paradigm is the monitoring in time of the individual components of tolerance and the assessment of different treatment strategies, as illustrated in Fig. 4 (right).
However, the glucose-insulin feedback system is more complex than the hyperbola paradigm. The relation between β-cell function and SI is certainly describable by a nonlinear inverse relationship but is in all likelihood more complex than their simple product (i.e., DI = β-cell function × [SI]α = constant), where SI is elevated to α. In addition, this simple concept hides several methodological issues that only recently have been thoroughly addressed in Denti et al. (29) and that, unless fully appreciated, could lead to errors in interpretation. Two important lessons are summarized below. 1) Traditionally, the most widely used approach consists in considering SI and β-cell responsivity as coordinates of a Cartesian plane and then using a traditional-fit approach to find the curve (hyperbola or power function) best explaining the data. However, to avoid the difficulties of a nonlinear two-variable fit, simplifications such as the log transformation of the data or assumptions on the precision of the individual indices have been used in the literature. Instead, a fit approach based on a nonlinear total least squares that does not use similar approximations should be used. 2) Although more reliable than all of the other curve-fitting approaches, the nonlinear total least squares approach relies on the hypothesis that all of the subjects in the population have the same value of DI. Thus, the only variability that is assumed to be present in the data is the uncertainty of SI and β-cell responsivity indices in each subject. This is arguably an oversimplification; even if a group of subjects is classified as healthy, it is very unlikely that they will all share exactly the same value of DI. A population approach is required based on a nonlinear mixed-effects model that accounts separately for between-subject variability in the DI values and the residual unexplained variability (e.g., model error and uncertainty) affecting the estimates of SI and β-cell responsivity in each individual. In the new framework proposed in Denti et al. (29), the population-typical values of DI and α are considered as features that characterize the population distribution of SI and β-cell responsivity.
A final note concerns the forgotten role of insulin hepatic extraction in Fig. 5. In fact, since the effect of insulin on peripheral tissues is also determined by the amount of insulin to which the tissue is exposed, hepatic insulin extraction should come into play (see the following paragraph) and provide yet another dimension to the relationship between insulin secretion and action portrayed in Fig. 4.
Figure 5.
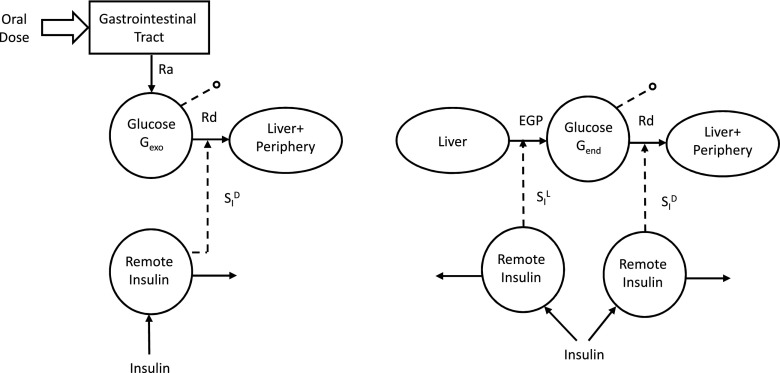
The oral-labeled minimal models. Left: The exogenous glucose model. Right: The endogenous glucose model.
Similarly to MTT, SI, reproducibility of MTT Φd, and Φs were assessed in Cobelli et al. (9): D% was 1 and 7%, and CV% was 31 and 18%, respectively.
An important addition to the parametric portrait provided by the oral glucose and C-peptide minimal models could be an index quantifying the effect of glucagon-like peptide 1, as a surrogate for the incretin effect, on insulin secretion. It can be obtained by adapting to MTT/OGTT the model developed in Dalla Man et al. (30) to quantify the effect of exogenous glucagon-like peptide 1 infusion on insulin secretion. This does not preclude other contributions to the incretin effect (e.g., by vagal inputs or by other incretin hormones such as glucose-dependent insulinotropic polypeptide), and experiments are underway to directly examine these contributions.
The Insulin and C-Peptide Model
Minimal models also provide an approach to assess hepatic insulin extraction (Fig. 3, bottom). The rationale is that we have seen that insulin secretion, ISR, can be assessed from the model of C-peptide kinetics and secretion identified from C-peptide and glucose data. By following a similar approach, posthepatic insulin delivery rate (IDR) can be assessed by using a model able to describe insulin data with plasma glucose concentration as an input. A recent study (31) has made this possible: an insulin population model developed along the lines of Van Cauter et al. (21) allows the calculation of insulin kinetic parameters from subject anthropometric characteristics, such as age, sex, and body surface area. This renders the model both a priori and a posteriori uniquely identifiable, thus allowing reconstruction of posthepatic IDR. From ISR and IDR, both the time course of hepatic insulin extraction (HE) and an index numerically quantifying hepatic insulin extraction can be calculated:
 |
 |
with T being the duration of the experiment.
The importance of adding hepatic extraction to SI and Φ for obtaining a more complete pathophysiological portrait has been shown in several studies (2,8).
Adding a Tracer to the Oral Glucose
If the oral glucose load is labeled with a glucose tracer, the exogenous glucose time course (Gexo) can be calculated from plasma tracer concentration, once the tracer-to-trace ratio in the oral dose is known. The endogenous glucose (Gend) can then be derived as Gend = G − Gexo, with G being the total glucose in plasma. In other words, adding a tracer to the MTT/OGTT allows total glucose concentration to be segregated into its exogenous and endogenous components.
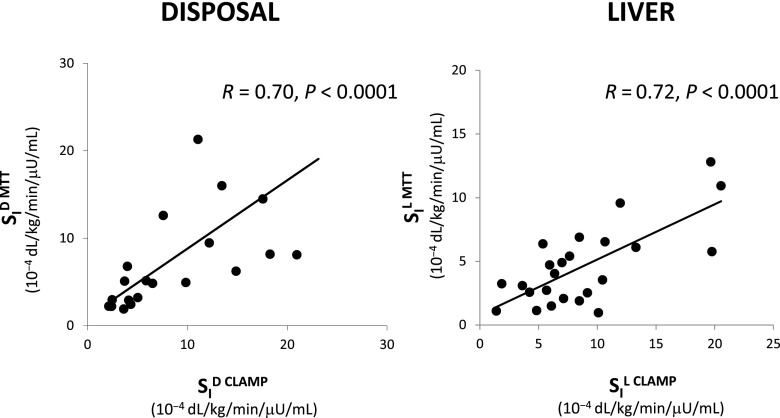
Gexo measured in plasma is the result of the glucose Ra coming from the MTT/OGTT and the Rd (Fig. 5, left). Thus, by fitting the model detailed in Dalla Man et al. (7) on Gexo and insulin, one can estimate both Ra and SID (i.e., the ability of insulin to enhance glucose utilization). Correlation between SID with disposal SI measured with the tracer-enhanced euglycemic-hyperinsulinemic clamp technique is r = 0.70 (Fig. 6, left) (16). Of particular note is that when the oral minimal models are used, the structural problem observed with the IVGTT in Fig. 1 vanishes: Fig. 7 shows the same plot for the same 204 subjects in Basu et al. (8) with SI greater than SID (14.05 ± 0.67 vs. 10.55 ± 0.60 10−4 dL/kg/min/μU/mL).
Figure 6.
Left: SID, MTT versus clamp. Right: SIL, MTT versus clamp.
Figure 7.
Net SI (i.e., insulin action on glucose disposal and production) versus SID (i.e., insulin action on glucose disposal only) from MTT data.
Gend is the result of the EGP and Rd (Fig. 5, right). The description of glucose disappearance and its control by insulin (SID) is the same derived from Gexo, since the body does not distingue exogenous from endogenous glucose. Therefore, EGP time course can be estimated from Gend either by deconvolution (32) or by using a mechanistic model (33). This assumes that EGP suppression is made up of three components: one proportional to plasma glucose, one proportional to delayed insulin (likely surrogating the effect of free fatty acid suppression), and one proportional to glucose derivative, strongly related to insulin concentration in the portal vein. The first solution has the advantage of not necessitating any assumption on EGP time course (apart from assuming that EGP is smooth); however, this approach does not provide indices of the efficacy of glucose and insulin control on EGP. Conversely, the use of a mechanistic model requires that the modality of glucose and insulin control on EGP suppression is explicitly defined; of note, this approach provides indices of both the inhibitory effect of glucose and insulin (SIL) on hepatic glucose production. Of note, recently, model-derived SIL has been compared with hepatic SI measured with a labeled euglycemic-hyperinsulinemic clamp, showing a correlation of 0.72 (P < 0.001) (34) (Fig. 6, right).
Model-Based Clinical Studies
It may be helpful for the reader to refer to some specific instances in which an answer to a diabetes-related question has been provided by systematic use of the oral minimal model method. For instance, the battery of oral glucose, C-peptide, and insulin models has been used to study the effect of age and sex on glucose metabolism (8), the effect of antiaging drugs (35), the influence of ethnicity (36), SI and β-cell function in nondiabetic (37) and obese (38) adolescents and children (39), the pathogenesis of prediabetes (17,40,41) and type 2 diabetes (1,42), the diurnal pattern of insulin action and secretion in healthy (43) and type 1 diabetic (44) subjects, the mechanism of insulin resistance in pregnancy (45), the effect of DPP4 inhibitors on insulin secretion (46), and the effect of a bile acid sequestrant on insulin secretion and action (47). These models also can be used to quantitatively measure changes in insulin secretion, insulin action, glucose effectiveness, and hepatic insulin extraction in individuals with prediabetes who do versus those who do not progress to overt diabetes.
Conclusions
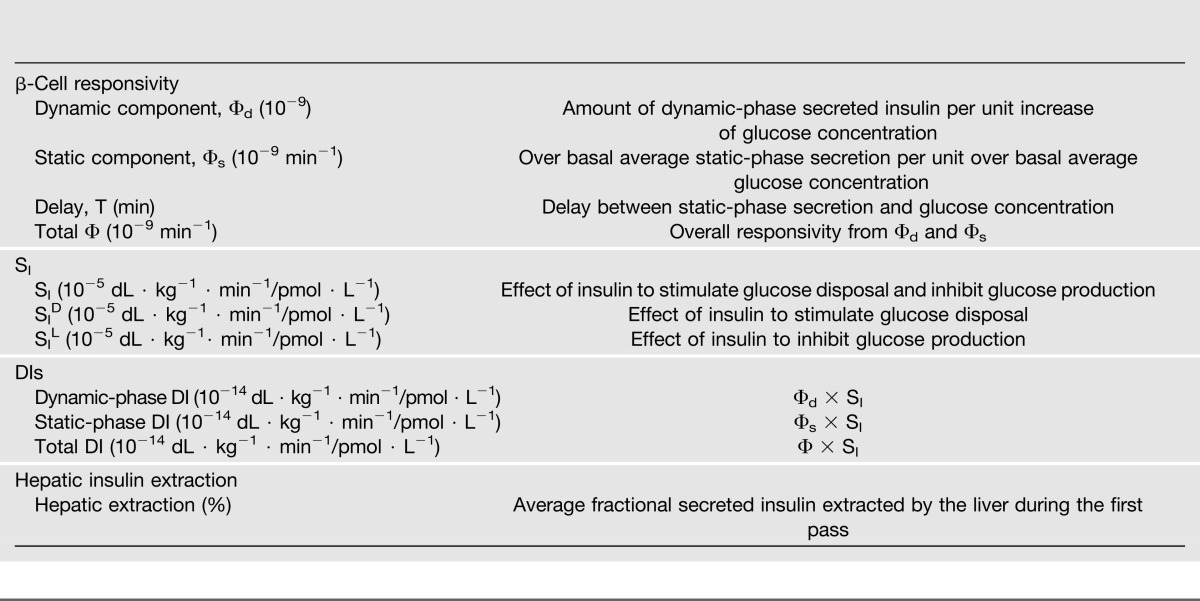
Insulin action, insulin secretion, and hepatic insulin extraction are important determinants of carbohydrate, fat, and protein metabolism. Ideally, these should be assessed using a single, simple physiologic test in the presence of glucose, amino acids, incretins, and neural signals. The oral minimal model method can simultaneously measure SI, β-cell responsivity, and hepatic insulin extraction from an MTT/OGTT. Reproducibility of the oral indices of SI and β-cell responsivity are comparable to those obtained with IVGTT and is between 20 and 30% (9). Adding a tracer to the glucose dose significantly enhances the insulin action portrait by segregating insulin action into the ability of insulin to suppress hepatic glucose production and stimulate glucose uptake. Table 1 summarizes the wealth of quantitative information provided by the oral minimal method.
Table 1.
Oral minimal model indices
In conclusion, the oral method, by quantitatively portraying the complex relationships between the major players of glucose metabolism, has provided novel insights into the regulation of postprandial metabolism in nondiabetic and diabetic humans. Unlike Mahler, who thought that “my time will come when his [Johann Strauss’] is over,” we believe that the oral minimal model method’s strengths make it a useful alternative to the present tests (clamp and IVGTT) to measure insulin secretion and action in vivo.
Article Information
Funding. This work was supported by funding from the National Institutes of Health (NIH) (DK29953) (to R.R. and R.B.) and the National Center for Advancing Translational Sciences (UL1 TR000135), a component of NIH. C.C. and C.D.M. have been partially funded by the Italian Ministero dell'Istruzione, dell'Università e della Ricerca (Progetto FIRB 2009).
Duality of Interest. No potential conflicts of interest relevant to this article were reported.
Author Contributions. C.C. wrote the manuscript. C.D.M., G.T., R.B., A.V., and R.R. reviewed and edited the manuscript. C.C. is the guarantor of this work and, as such, had full access to all the data in the study and takes responsibility for the integrity of the data and the accuracy of the data analysis.
Footnotes
See accompanying article, p. 1188.
References
- 1.Dalla Man C, Bock G, Giesler PD, et al. Dipeptidyl peptidase-4 inhibition by vildagliptin and the effect on insulin secretion and action in response to meal ingestion in type 2 diabetes. Diabetes Care 2009;32:14–18 [DOI] [PMC free article] [PubMed] [Google Scholar]
- 2.Sathananthan A, Dalla Man C, Zinsmeister AR, et al. A concerted decline in insulin secretion and action occurs across the spectrum of fasting and postchallenge glucose concentrations. Clin Endocrinol (Oxf) 2012;76:212–219 [DOI] [PMC free article] [PubMed] [Google Scholar]
- 3.Pisprasert V, Ingram KH, Lopez-Davila MF, Munoz AJ, Garvey WT. Limitations in the use of indices using glucose and insulin levels to predict insulin sensitivity: impact of race and gender and superiority of the indices derived from oral glucose tolerance test in African Americans. Diabetes Care 2013;36:845–853 [DOI] [PMC free article] [PubMed] [Google Scholar]
- 4.Reaven GM. What do we learn from measurements of HOMA-IR? Diabetologia 2013;56:1867–1868 [DOI] [PubMed] [Google Scholar]
- 5.Bergman RN, Ider YZ, Bowden CR, Cobelli C. Quantitative estimation of insulin sensitivity. Am J Physiol 1979;236:E667–E677 [DOI] [PubMed] [Google Scholar]
- 6.Caumo A, Vicini P, Zachwieja JJ, et al. Undermodeling affects minimal model indexes: insights from a two-compartment model. Am J Physiol 1999;276:E1171–E1193 [DOI] [PubMed] [Google Scholar]
- 7.Dalla Man C, Caumo A, Basu R, Rizza R, Toffolo G, Cobelli C. Measurement of selective effect of insulin on glucose disposal from labeled glucose oral test minimal model. Am J Physiol Endocrinol Metab 2005;289:E909–E914 [DOI] [PubMed] [Google Scholar]
- 8.Basu R, Dalla Man C, Campioni M, et al. Effects of age and sex on postprandial glucose metabolism: differences in glucose turnover, insulin secretion, insulin action, and hepatic insulin extraction. Diabetes 2006;55:2001–2014 [DOI] [PubMed] [Google Scholar]
- 9.Cobelli C, Toffolo GM, Dalla Man C, et al. Assessment of beta-cell function in humans, simultaneously with insulin sensitivity and hepatic extraction, from intravenous and oral glucose tests. Am J Physiol Endocrinol Metab 2007;293:E1–E15 [DOI] [PubMed] [Google Scholar]
- 10.Toffolo G, De Grandi F, Cobelli C. Estimation of beta-cell sensitivity from intravenous glucose tolerance test C-peptide data. Knowledge of the kinetics avoids errors in modeling the secretion. Diabetes 1995;44:845–854 [DOI] [PubMed] [Google Scholar]
- 11.Toffolo G, Campioni M, Basu R, Rizza RA, Cobelli C. A minimal model of insulin secretion and kinetics to assess hepatic insulin extraction. Am J Physiol Endocrinol Metab 2006;290:E169–E176 [DOI] [PubMed] [Google Scholar]
- 12.Dalla Man C, Campioni M, Polonsky KS, et al. Two-hour seven-sample oral glucose tolerance test and meal protocol: minimal model assessment of beta-cell responsivity and insulin sensitivity in nondiabetic individuals. Diabetes 2005;54:3265–3273 [DOI] [PubMed] [Google Scholar]
- 13.Cobelli C, Caumo A, Omenetto M. Minimal model SG overestimation and SI underestimation: improved accuracy by a Bayesian two-compartment model. Am J Physiol 1999;277:E481–E488 [DOI] [PubMed] [Google Scholar]
- 14.Dalla Man C, Caumo A, Cobelli C. The oral glucose minimal model: estimation of insulin sensitivity from a meal test. IEEE Trans Biomed Eng 2002;49:419–429 [DOI] [PubMed] [Google Scholar]
- 15.Dalla Man C, Caumo A, Basu R, Rizza R, Toffolo G, Cobelli C. Minimal model estimation of glucose absorption and insulin sensitivity from oral test: validation with a tracer method. Am J Physiol Endocrinol Metab 2004;287:E637–E643 [DOI] [PubMed] [Google Scholar]
- 16.Dalla Man C, Yarasheski KE, Caumo A, et al. Insulin sensitivity by oral glucose minimal models: validation against clamp. Am J Physiol Endocrinol Metab 2005;289:E954–E959 [DOI] [PubMed] [Google Scholar]
- 17.Bock G, Dalla Man C, Campioni M, et al. Effects of nonglucose nutrients on insulin secretion and action in people with pre-diabetes. Diabetes 2007;56:1113–1119 [DOI] [PubMed] [Google Scholar]
- 18.Pillonetto G, Caumo A, Sparacino G, Cobelli C. A new dynamic index of insulin sensitivity. IEEE Trans Biomed Eng 2006;53:369–379 [DOI] [PubMed] [Google Scholar]
- 19.Pillonetto G, Caumo A, Cobelli C. Dynamic insulin sensitivity index: importance in diabetes. Am J Physiol Endocrinol Metab 2010;298:E440–E448 [DOI] [PMC free article] [PubMed] [Google Scholar]
- 20.Breda E, Cavaghan MK, Toffolo G, Polonsky KS, Cobelli C. Oral glucose tolerance test minimal model indexes of beta-cell function and insulin sensitivity. Diabetes 2001;50:150–158 [DOI] [PubMed] [Google Scholar]
- 21.Van Cauter E, Mestrez F, Sturis J, Polonsky KS. Estimation of insulin secretion rates from C-peptide levels. Comparison of individual and standard kinetic parameters for C-peptide clearance. Diabetes 1992;41:368–377 [DOI] [PubMed] [Google Scholar]
- 22.Pedersen MG, Toffolo GM, Cobelli C. Cellular modeling: insight into oral minimal models of insulin secretion. Am J Physiol Endocrinol Metab 2010;298:E597–E601 [DOI] [PubMed] [Google Scholar]
- 23.Pedersen MG, Corradin A, Toffolo GM, Cobelli C. A subcellular model of glucose-stimulated pancreatic insulin secretion. Philos Trans A Math Phys Eng Sci 2008;366:3525–3543 [DOI] [PubMed] [Google Scholar]
- 24.Basu A, Pedersen MG, Cobelli C. Prediabetes: evaluation of β-cell function. Diabetes 2012;61:270–271 [DOI] [PMC free article] [PubMed] [Google Scholar]
- 25.Mari A, Schmitz O, Gastaldelli A, Oestergaard T, Nyholm B, Ferrannini E. Meal and oral glucose tests for assessment of beta -cell function: modeling analysis in normal subjects. Am J Physiol Endocrinol Metab 2002;283:E1159–E1166 [DOI] [PubMed] [Google Scholar]
- 26.Steil GM, Hwu CM, Janowski R, et al. Evaluation of insulin sensitivity and beta-cell function indexes obtained from minimal model analysis of a meal tolerance test. Diabetes 2004;53:1201–1207 [DOI] [PubMed] [Google Scholar]
- 27.Campioni M, Toffolo G, Shuster LT, Service FJ, Rizza RA, Cobelli C. Incretin effect potentiates beta-cell responsivity to glucose as well as to its rate of change: OGTT and matched intravenous study. Am J Physiol Endocrinol Metab 2007;292:E54–E60 [DOI] [PubMed] [Google Scholar]
- 28.Bergman RN, Phillips LS, Cobelli C. Physiologic evaluation of factors controlling glucose tolerance in man: measurement of insulin sensitivity and beta-cell glucose sensitivity from the response to intravenous glucose. J Clin Invest 1981;68:1456–1467 [DOI] [PMC free article] [PubMed] [Google Scholar]
- 29.Denti P, Toffolo GM, Cobelli C. The disposition index: from individual to population approach. Am J Physiol Endocrinol Metab 2012;303:E576–E586 [DOI] [PubMed] [Google Scholar]
- 30.Dalla Man C, Micheletto F, Sathananthan A, Rizza RA, Vella A, Cobelli C. A model of GLP-1 action on insulin secretion in nondiabetic subjects. Am J Physiol Endocrinol Metab 2010;298:E1115–E1121 [DOI] [PMC free article] [PubMed] [Google Scholar]
- 31.Campioni M, Toffolo GM, Basu R, Rizza RA, Cobelli C. Minimal model assessment of hepatic insulin extraction during an oral test from standard insulin kinetic parameters. Am J Physiol Endocrinol Metab 2009;297:E941–E948 [DOI] [PMC free article] [PubMed] [Google Scholar]
- 32.De Nicolao G, Sparacino G, Cobelli C. Nonparametric input estimation in physiological systems: problems, methods, case studies. Automatica 1997;33:851–870 [Google Scholar]
- 33.Dalla Man C, Toffolo G, Basu R, Rizza RA, Cobelli C. Use of labeled oral minimal model to measure hepatic insulin sensitivity. Am J Physiol Endocrinol Metab 2008;295:E1152–E1159 [DOI] [PMC free article] [PubMed] [Google Scholar]
- 34.Dalla Man C, Piccinini F, Basu R, Basu A, Rizza RA, Cobelli C. Modeling hepatic insulin sensitivity during a meal: validation against the euglycemic-hyperinsulinemic clamp. Am J Physiol Endocrinol Metab 2013;304:E819–E825 [DOI] [PMC free article] [PubMed] [Google Scholar]
- 35.Nair KS, Rizza RA, O’Brien P, et al. DHEA in elderly women and DHEA or testosterone in elderly men. N Engl J Med 2006;355:1647–1659 [DOI] [PubMed] [Google Scholar]
- 36.Petersen KF, Dufour S, Feng J, et al. Increased prevalence of insulin resistance and nonalcoholic fatty liver disease in Asian-Indian men. Proc Natl Acad Sci USA 2006;103:18273–18277 [DOI] [PMC free article] [PubMed] [Google Scholar]
- 37.Sunehag AL, Dalla Man C, Toffolo G, Haymond MW, Bier DM, Cobelli C. beta-Cell function and insulin sensitivity in adolescents from an OGTT. Obesity (Silver Spring) 2009;17:233–239 [DOI] [PubMed] [Google Scholar]
- 38.Cali AM, Dalla Man C, Cobelli C, et al. Primary defects in beta-cell function further exacerbated by worsening of insulin resistance mark the development of impaired glucose tolerance in obese adolescents. Diabetes Care 2009;32:456–461 [DOI] [PMC free article] [PubMed] [Google Scholar]
- 39.Chandler-Laney PC, Phadke RP, Granger WM, et al. Adiposity and β-cell function: relationships differ with ethnicity and age. Obesity (Silver Spring) 2010;18:2086–2092 [DOI] [PMC free article] [PubMed] [Google Scholar]
- 40.Bock G, Dalla Man C, Campioni M, et al. Pathogenesis of pre-diabetes: mechanisms of fasting and postprandial hyperglycemia in people with impaired fasting glucose and/or impaired glucose tolerance. Diabetes 2006;55:3536–3549 [DOI] [PubMed] [Google Scholar]
- 41.Bock G, Chittilapilly E, Basu R, et al. Contribution of hepatic and extrahepatic insulin resistance to the pathogenesis of impaired fasting glucose: role of increased rates of gluconeogenesis. Diabetes 2007;56:1703–1711 [DOI] [PubMed] [Google Scholar]
- 42.Basu A, Dalla Man C, Basu R, Toffolo G, Cobelli C, Rizza RA. Effects of type 2 diabetes on insulin secretion, insulin action, glucose effectiveness, and postprandial glucose metabolism. Diabetes Care 2009;32:866–872 [DOI] [PMC free article] [PubMed] [Google Scholar]
- 43.Saad A, Dalla Man C, Nandy DK, et al. Diurnal pattern to insulin secretion and insulin action in healthy individuals. Diabetes 2012;61:2691–2700 [DOI] [PMC free article] [PubMed] [Google Scholar]
- 44.Hinshaw L, Dalla Man C, Nandy DK, et al. Diurnal pattern of insulin action in type 1 diabetes: implications for a closed-loop system. Diabetes 2013;62:2223–2229 [DOI] [PMC free article] [PubMed] [Google Scholar]
- 45.Hodson K, Dalla Man C, Smith FE, et al. Mechanism of insulin resistance in normal pregnancy. Horm Metab Res 2013;45:567–571 [DOI] [PubMed] [Google Scholar]
- 46.Bock G, Man CD, Micheletto F, et al. The effect of DPP-4 inhibition with sitagliptin on incretin secretion and on fasting and postprandial glucose turnover in subjects with impaired fasting glucose. Clin Endocrinol (Oxf) 2010;73:189–196 [DOI] [PMC free article] [PubMed] [Google Scholar]
- 47.Smushkin G, Sathananthan M, Piccinini F, et al. The effect of a bile acid sequestrant on glucose metabolism in subjects with type 2 diabetes. Diabetes 2013;62:1094–1101 [DOI] [PMC free article] [PubMed] [Google Scholar]


