

Abstract
Purpose.
The single nucleotide variant (SNV), rs613872, in the transcription factor 4 (TCF4) gene was previously found to be strongly associated (P = 6 × 10⁻²⁶) with Fuchs' endothelial corneal dystrophy (FECD). Subsequently, an intronic expansion of the repeating trinucleotides, TGC, was found to be even more predictive of disease. We performed comprehensive sequencing of the TCF4 gene region in order to identify the best marker for FECD within TCF4 and to identify other novel variants that may be associated with FECD.
Methods.
Leukocyte DNA was isolated from 68 subjects with FECD and 16 unaffected individuals. A custom capture panel was used to isolate the region surrounding the two previously validated markers of FECD. Sequencing of the TCF4 coding region, introns and flanking sequence, spanning 465 kb was performed at >1000× average coverage using the Illumina HiSequation 2000.
Results.
TGC expansion (>50 repeats) was present in 46 (68%) FECD-affected subjects and one (6%) normal subject. A total of 1866 variants, including 1540 SNVs, were identified. Only two previously reported SNVs resided in the TCF4 coding region, neither of which segregated with disease. No variant, including TGC expansion, correlated perfectly with disease status. Trinucleotide repeat expansion was a better predictor of disease than any other variant.
Conclusions.
Complete sequencing of the TCF4 genomic region revealed no single causative variant for FECD. The intronic trinucleotide repeat expansion within TCF4 continues to be more strongly associated with FECD than any other genetic variant.
Keywords: Fuchs' dystrophy, transcription factor 4, TCF4, trinucleotide, repeat expansion
Complete sequencing of the TCF4 gene was performed in 68 patients with Fuchs' dystrophy and 16 controls. No variant was a perfect predictor of disease or was more strongly associated with Fuchs' than TGC trinucleotide repeat expansion, suggesting the role of repeat expansion in disease pathogenesis.
Introduction
Fuchs' endothelial corneal dystrophy (FECD) is a very common, familial, degenerative disease affecting the internal, endothelial cell monolayer of the cornea.1 Guttae, which are microscopic collagenous excrescences of the endothelial basement membrane, are the clinical hallmark of the disease and allow easy phenotyping of affected individuals.2 In severe cases, extensive guttae and endothelial cell loss lead to failure of the fluid pumping function of the endothelium, resulting in corneal edema and vision loss, and allogeneic transplantation is the only available therapeutic alternative. In the United States3 and other predominantly Caucasian countries,4,5 FECD is the most common indication for corneal transplantation. Furthermore, FECD is a relative contraindication to refractive surgery, and routine cataract extraction with its inherently low but unavoidable rate of endothelial cell loss can hasten disease progression.6,7 The influence of genetic factors on FECD is well-recognized, and several gene variants, including AGBL1,8 COL8A2,9 SLC4A11,10 ZEB1,11 and LOXHD1,12 have been associated with a small proportion of FECD patients. Disease associated with COL8A2 mutations occurs at an earlier age and is clinically distinct from the common, older-onset FECD.9
Our previous work has identified the most reproducible and robust genetic markers for FECD available at this time, the single nucleotide variant (SNV) rs61387213 and a TGC trinucleotide repeat (TNR) expansion.14 Both of these reside in introns of the transcription factor 4 (TCF4; not to be confused with T-cell factor 4, aka TCF7L2) gene on chromosome 18, which codes for an ubiquitous basic, helix-loop-helix transcription factor, the E2-2 protein. TCF4 has a complex pattern of expression that can produce both positive and negative acting isoforms (depending on tissue specificity, dimeric binding with other basic, helix-loop-helix transcription factors, promoters, and splice junctions).15 In the context of FECD, it is notable that TCF4 is known to regulate the expression of ZEB1 (also a transcription factor), both of which are intimately involved in epithelial-to-mesenchymal transition.16 Additionally, ZEB1 is implicated in the regulation of COL8A2,17,18 thus implicating TCF4 as an excellent candidate gene in FECD pathogenesis.
The TGC expansion was found in 52 out of 66 FECD cases and only 2 of 63 controls and had a higher predictive value for FECD than rs613872. FECD is an autosomal dominant,19 late onset disease with a prevalence that is similar to the frequency of the TNR expansion in the general population.20,21 These considerations suggest that the repeat could be pathogenic through a gain-of-function mechanism. Nevertheless, we have noted that in a small minority of samples, there is some discordance between the expansion of this TGC repeat and the occurrence of disease, even within a family. These observations raise the possibility that the repeat expansion is merely tightly linked to a causative variant. Definitively distinguishing between these two possibilities is critical to setting the path for future functional work.
To address the possibility that a novel, uncharacterized variant tightly linked to both rs613872 and CTG18.1 might actually be pathogenic, we have now conducted an in depth custom capture next generation sequencing (NGS) study of the TCF4 locus in a cohort of 84 unrelated subjects, including 68 affected and 16 control cases.
Methods
Patient Population
Affected and control participants were recruited from the clinical practices of the two clinician investigators (KHB and SVP) after informed consent. Corneas were examined by slit lamp biomicroscopy and graded for the presence/absence of endothelial guttae by using a 0 to 6 modified Krachmer scale (0 = no guttae; 6 = confluent guttae with corneal edema).22 The demographic and clinical characteristics of the subjects chosen for inclusion are shown in Table 1. Control and affected subjects were closely matched in age and sex balance. Subjects were chosen with prior knowledge of their FECD and TNR status. Because the central hypothesis to be tested was that there were previously undescribed pathogenic variants that reside within the TCF4 gene, we oversampled from the pool of affected subjects that lacked repeat expansions. From our initial studies, approximately 80% of FECD patients had TGC repeat expansions greater than 50 repeats. In the samples used for this study, only 46 of 68 affected patients (68%) had a repeat length greater than 50 (Table 1). All subjects were treated in accordance with the Declaration of Helsinki.
Table 1.
Demographics and TCF4 Repeat Sizes for the Patient Population
|
Subjects |
N |
Sex |
Mean FECD Grade (Range) |
Mean Age, y (SD) |
TGC Repeat Expansion (>50 Repeats) |
TGC Repeat Length |
||
|
Yes |
No |
Range |
Median |
|||||
| FECD | 68 | 24% M | 5 (2–6) | 70 (±12) | 46 (68%) | 22 (32%) | 12–∼2600 | 85 |
| 76% F | ||||||||
| Controls | 16 | 25% M | 0 | 71 (±10) | 1 (6%) | 15 (94%) | 15–74 | 18 |
| 75% F | ||||||||
Assay of TGC Repeat Status
TGC repeat status was determined using the short tandem repeat assay described in detail by Wieben et al.14 Briefly, the repeat was amplified by PCR using one fluorescently labeled primer, and the products were sized by electrophoresis using the ABI 3730XL DNA Analyzer (Applied Biosystems, Foster City, CA, USA).
Custom Capture and Sequencing
All studies were performed at the Mayo Clinic Medical Genome Facility. Three micrograms of lymphocyte-derived DNA in 120 μL TE buffer was fragmented using the Covaris E210 sonicator to a fragment size mode of between 150 and 200 base pairs (bp). The ends were repaired and phosphorylated using Klenow, T4 polymerase, and T4 polynucleotide kinase, after which an “A” base was added to the 3′ ends of double-stranded DNA using Klenow exo- (3′–5′ exo minus). Paired end Index DNA adaptors (Agilent, Santa Clara, CA, USA) with a single “T” base overhang at the 3′ end were ligated and the resulting constructs are purified using Agencourt AMPure SPRI beads (Beckman Coulter, Brea, CA, USA). The adapter-modified DNA fragments were enriched by four cycles of PCR using SureSelect forward and SureSelect Pre-Capture Indexing reverse (Agilent) primers. The concentration and size distribution of the libraries are determined on an Agilent Bioanalyzer DNA 1000 chip.
Custom capture was carried out using the Agilent Bravo liquid handler following the protocol for Agilent's SureSelect XT. Seven hundred fifty nanograms of the prepped library was incubated with the custom biotinylated RNA capture baits spanning chromosome 18 for 24 hours at 65°C. The captured DNA:RNA hybrids were recovered using Dynal Dynabeads MyOne Streptavidin T1 (Invitrogen/Life Technologies, Grand Island, NY, USA). The DNA was eluted from the beads, purified using AMPure XP beads from Agencourt, and amplified using the SureSelect Post-Capture Indexing forward and Index PCR reverse primers (Agilent) for 12 cycles. Libraries were validated and quantified on the Agilent Bioanalyzer, pooled at equimolar concentrations, and loaded onto paired end flow cells at concentrations of 7 to 8 pM to generate cluster densities of 600,000 to 800,000/mm2 following Illumina's standard protocol using the Illumina cBot and HiSeq Paired end cluster kit version 3 (Illumina, San Diego, CA, USA). Each lane of a HiSeq flow cell produced 21 to 39 Gbases of sequence.
The flow cells were sequenced as 101 × 2 paired end reads on an Illumina HiSequation 2000 using TruSeq SBS sequencing kit version 3 and HiSeq data collection version 2.0.12.0 software. Base-calling was performed using Illumina's RTA version 1.17.21.3.
The TCF4 gene spans approximately 416 kb on the long arm of Chromosome 18 (Fig. 1). This entire coding region of the TCF4 gene, including all the introns, was included in the capture design. Our capture design covered 465 kb, including approximately 36 kb of 5′ flanking and 15 kb of 3′ flanking sequence.
Figure 1.
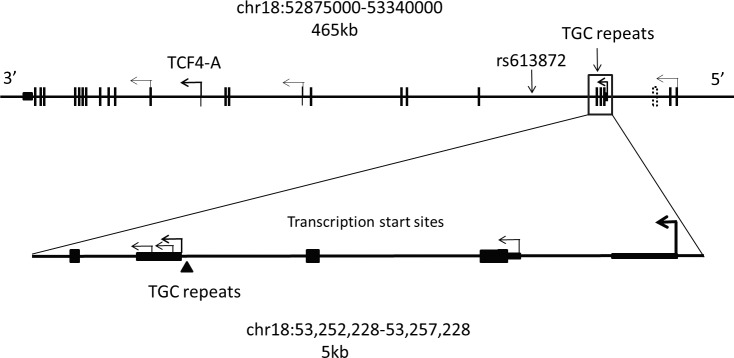
Structure of the TCF4 gene region on chromosome 18. The 465-kb region targeted by an Agilent custom capture panel is shown. Exons of the TCF4 gene are shown as vertical lines. Transcription of this gene proceeds from right to left. The major transcription start sites within this gene are depicted by bent arrows. The location of the region not captured is shown by a dashed box near the 5′ end of the gene. An expanded view of the TCF4 gene structure in the immediate vicinity of the TNR is shown below the diagram of gene structure. There are at least five transcription start sites in this small region. Noncoding regions are shown as thin rectangles while coding exons are shown as wider rectangles. The location of the TGC repeats is shown with an arrowhead.
The paired-end reads were analyzed using Genome_GPS, our in-house analysis pipeline for DNA sequencing data. Raw FASTQ formatted reads were aligned using Novoalign version 2.08.01 (http://novocraft.com; provided in the public domain by Novocraft), and the aligned Sequence Alignment Map (SAM) files were converted to a coordinate sorted binary SAM (BAM) file using SAMtools 0.1.19.23 BAM files 12 were then processed through mark duplicates, indel realignment, and recalibration steps in this order with Genome Analysis Toolkit (GATK, Broad Institute, Cambridge, MA, USA) 2.7-4-g6f46d11.24 The raw variants were called using GATK's UnifiedGenotyper walker version 2.7-4-g6f46d11 with default parameters. The output from this pipeline was filtered to remove calls with a quality score of less than 20. This threshold represents a calculated call accuracy of 99%. This has been confirmed experimentally by others.25
Statistical Analysis
Variants were filtered using Genotype Quality score < 20, call rates < 95%, and minor allele frequencies < 0.02. Hardy Weinberg Equilibrium (HWE) was calculated using all samples. Logistic regression analysis was run using Plink (http://pngu.mgh.harvard.edu/∼purcell/plink/contact.shtml#cite; provided in the public domain by Harvard, Cambridge, MA, USA) assuming a dominant model for the SNVs and biallelic indels.
Results
Sequencing
We achieved an average coverage across this 465-kb region in excess of 1000-fold (Fig. 2). This high level of coverage resulted in a minimum coverage in excess of 30× across the entire region. Only one small region in an intron near the 5′ end of the gene was completely uncovered by reads in this experiment (see Figs. 1, 2). This reference sequence for this low complexity, AT-rich region that lies 9.5 kb from the nearest exon contains only 13 GC bp over a span of 384 bp (see dotted box in Fig. 1; 53,288,672–53,289,056).
Figure 2.
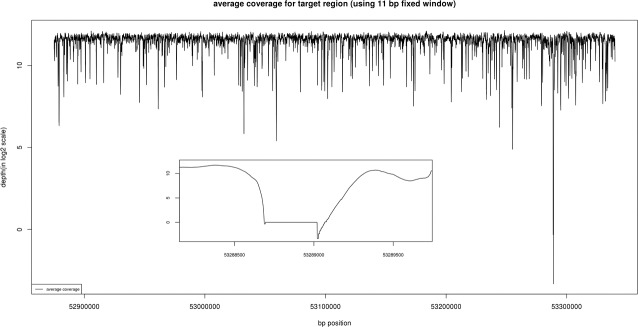
The average coverage for the targeted region is shown. Coverage was computed using an 11 bp fixed window. Note that only one region between 53,288,672 and 53,289,056 has an average coverage below 30-fold.
The sequencing revealed a total of 1540 positions where an SNV was present in at least one of the 84 samples. Of these, 523 were “private” SNVs observed in only one sample. The pipeline also identified 326 small insertions or deletions (indels) in this region (see Fig. 3). After removing variants that did not pass quality metrics or had multiple called alleles, there were 1458 SNVs and 205 biallelic indels that were used for further statistical analysis. A standard case/control association analysis was run using these variants (Dominant model). The top 25 variants are summarized in Table 2.
Figure 3.
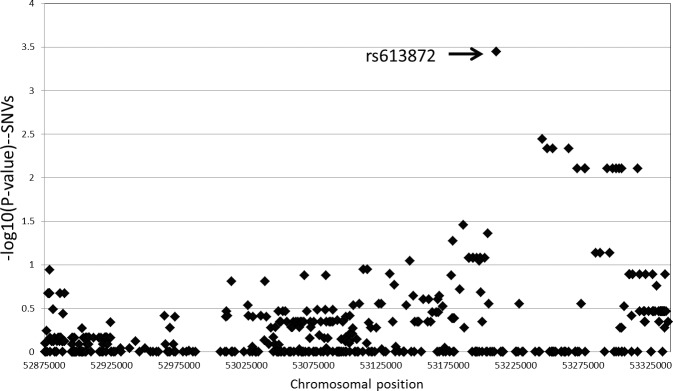
Odds ratios for SNVs across the targeted region. Odds ratios for individual SNVs across the capture region were calculated using a dominant model. Five hundred forty-six SNVs that passed filters and had a minor allele frequency of >5% are shown. The SNV with the highest odds ratio was rs613872, which has previously been associated with FECD by Baratz et al.13
Table 2.
Logistic Regression Results for Variants in the Target Region
|
Chromosome |
Base Pair |
Reference Allele |
Alternate Allele |
dbSNP Identifier |
SNV vs. Insertion/ Deletion (Indel) |
Alternate Allele Frequency |
Odds Ratio |
Confidence Range |
P |
|
|
Fuchs' |
Control |
|||||||||
| 18 | 53210302 | G | T | rs613872 | SNV | 0.4779 | 0.125 | 12.04 | 3.2–47.2 | 0.0004 |
| 18 | 53244414 | A | T | rs2924322 | SNV | 0.3731 | 0.1 | 10.25 | 2.1–49.2 | 0.004 |
| 18 | 53244442 | TAA | T | rs33980799 | Indel | 0.375 | 0.125 | 7.0 | 1.8–26.9 | 0.005 |
| 18 | 53248151 | T | C | rs618869 | SNV | 0.375 | 0.125 | 7.0 | 1.8–26.9 | 0.005 |
| 18 | 53264343 | A | G | rs596668 | SNV | 0.375 | 0.125 | 7.0 | 1.8–26.9 | 0.005 |
| 18 | 53252388 | G | A | rs599550 | SNV | 0.375 | 0.1562 | 7.0 | 1.8–26.9 | 0.005 |
| 18 | 53308061 | AT | A | rs59006454 | Indel | 0.6912 | 0.4375 | 7.273 | 1.7–31.4 | 0.008 |
| 18 | 53276116 | T | A | rs12458118 | SNV | 0.6912 | 0.4375 | 7.273 | 1.7–31.4 | 0.008 |
| 18 | 53276523 | G | A | rs9951280 | SNV | 0.6912 | 0.4375 | 7.273 | 1.7–31.4 | 0.008 |
| 18 | 53299460 | G | A | rs12103984 | SNV | 0.6912 | 0.4375 | 7.273 | 1.7–31.4 | 0.008 |
| 18 | 53315397 | T | A | rs17089911 | SNV | 0.6912 | 0.4375 | 7.273 | 1.7–31.4 | 0.008 |
| 18 | 53270531 | T | C | rs682245 | SNV | 0.6912 | 0.4688 | 7.273 | 1.7–31.4 | 0.008 |
| 18 | 53292908 | T | C | rs8090341 | SNV | 0.6985 | 0.4375 | 7.273 | 1.7–31.4 | 0.008 |
| 18 | 53296927 | G | A | rs12457157 | SNV | 0.6985 | 0.4375 | 7.273 | 1.7–31.4 | 0.008 |
| 18 | 53301527 | A | C | rs6566169 | SNV | 0.6985 | 0.4375 | 7.273 | 1.7–31.4 | 0.008 |
| 18 | 53303546 | T | G | rs35691742 | SNV | 0.6985 | 0.4375 | 7.273 | 1.7–31.4 | 0.008 |
| 18 | 53186092 | T | C | rs627685 | SNV | 0.7868 | 0.5938 | 7.615 | 1.2–50.2 | 0.035 |
| 18 | 53204136 | A | C | rs658905 | SNV | 0.5147 | 0.4375 | 3.291 | 1.0–10.5 | 0.044 |
| 18 | 52904858 | G | GC | rs36069440 | Indel | 0.2721 | 0.09375 | 3.852 | 1.0–14.7 | 0.049 |
| 18 | 53178061 | G | A | rs67387556 | SNV | 0.6176 | 0.625 | 4.2 | 1.0–18.0 | 0.053 |
| 18 | 53284109 | A | G | rs616580 | SNV | 0.3088 | 0.5625 | 0.2923 | 0.1–1.1 | 0.073 |
| 18 | 53287570 | C | T | rs1642313 | SNV | 0.3088 | 0.5625 | 0.2923 | 0.1–1.1 | 0.073 |
| 18 | 53294569 | T | C | rs644279 | SNV | 0.3088 | 0.5625 | 0.2923 | 0.1–1.1 | 0.073 |
| 18 | 53193029 | C | CT | rs11441646 | Indel | 0.4853 | 0.4062 | 2.748 | 0.9–8.6 | 0.083 |
| 18 | 53190188 | G | A | rs9948513 | SNV | 0.4853 | 0.4062 | 2.748 | 0.9–8.6 | 0.083 |
A dominant model association test was performed for each variant shown. Logistic regression statistics and odds ratios for FECD are shown for the 25 variants with the lowest P values. The SNV that confers the highest odds ratio for FECD is rs613872, with an odds ratio of 12 in these samples.
The variant with the strongest association for a positive risk for disease status is rs613872 (chr18:53210302), with a calculated odds ratio of 12 in this sample set. This is the same SNV identified by Baratz et al.13 in a full genome wide association study and subsequently validated by others.26–32
Importantly, we did not identify any novel SNVs that appear to be causative for FECD. In particular, none of the top 25 SNVs with the strongest association with disease status resides in the coding region of any of the 48 transcripts produced from this gene (Ensembl). In fact, we observed only two SNVs in the coding region of TCF4 in this cohort (rs8766 and rs611326) and only the latter is nonsynonymous (A10P, for which the allele frequency of the “variant” is 0.99).
Similarly, none of the biallelic indels identified in this cohort were statistically correlated to disease status. Of the 326 total indels, 121 had more than two alleles called by our standard pipeline, confounding an unbiased statistical analysis. Included in this group with multiple alleles is the previously described TGC repeat that is associated with FECD. We noted most of the indels were found in similar frequencies in both the affected and unaffected sample cohorts, but some were preferentially called in either the affected or control samples. To gain some insight into the distribution of indels in the two study groups, we plotted the differences in allele distribution between affected and control samples for every indel allele (Fig. 4). This simply provides a visualization tool illustrating which indel alleles called by the pipeline exhibit a skewed distribution between samples from patients and controls subjects. The indel that has the largest differential between affected and unaffected samples in this analysis was the TGC repeat expansion. An expanded TGC allele was identified by our standard NGS pipeline in 48 of 68 affected samples (71%) and 2 of 16 controls (12%). This compared well to 50 samples in this cohort that had been shown by other methods to have a TGC repeat length greater than the 26 repeats seen in the reference sequence. The two control samples with called insertions actually did have repeat lengths of 49 and 74.
Figure 4.
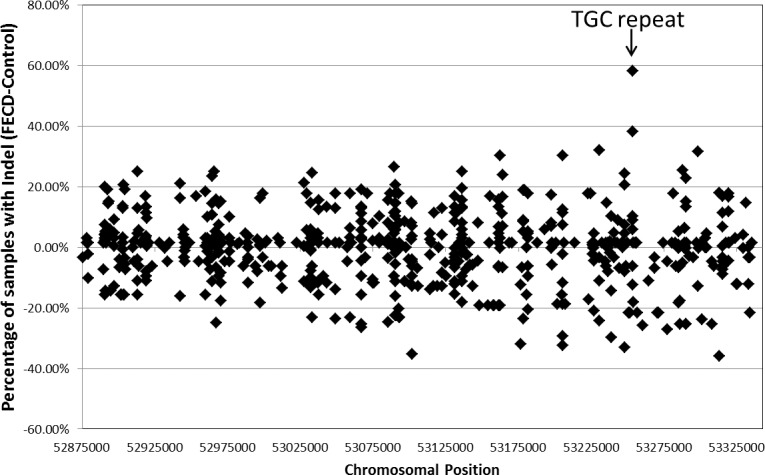
Distribution of indels in samples from FECD patients and controls. The difference in the percentage of affected and control samples that were called by the default NGS analysis pipeline to contain a specific indel allele at a specific location is shown. The TGC repeat expansion (marked) was called in 71% of affected samples and only 12% of controls.
Variants Within the TGC Repeat
Reliable assessment of SNVs within the TGC repeat sequence is difficult due to low sequence complexity (for NGS) and the high degree of length polymorphism in this region (for Sanger sequencing). However, we have not seen length polymorphism within the first 12 repeats, so assessment of variants in that region is quite reliable by either NGS or Sanger sequencing. We did note that there is a common SNV that is located within the 10th TGC repeat (rs143743309). This SNV converts the 10th TGC repeat to a TGG. This variant has been confirmed by Sanger sequencing, and this variant was seen in both affected and unaffected samples. It is interesting that in each of the four affected samples that contained this variant, this SNV was located on the allele that did not have the repeat expansion.
The NGS sequencing also identified a 3-bp CAT deletion that overlaps the first TGC repeat (Fig. 5A). This deletion is seen on the allele with the repeat expansion. This deletion was confirmed by Sanger sequencing (Fig. 5B). It is notable that this novel deletion was found in the single sample from the unaffected group that contains an TGC repeat that exceeds the 50-repeat threshold we have set for increased disease risk.
Figure 5.

Identification of a three-base deletion at the beginning of the TGC repeat in one control sample with an expanded repeat. Both the NGS results (A) and Sanger sequencing results (B) for this sample are shown. This sample from an unaffected individual contains 74 TGC repeats. The heterozygous three-base deletion is confirmed by Sanger sequencing.
Discussion
In most familial cases of FECD, the inheritance is autosomal dominant, consistent with the hypothesis that a gain of function mutation contributes to disease susceptibility. Previous work identified both rs61387213,26–32 and a TNR expansion14,32 as the major risk variants for FECD. These two variants are located in different TCF4 introns. Neither has yet been shown to have any direct functional consequences for the structure or function of TCF4 protein (E2-2), and neither is a perfect predictor for FECD. Furthermore, Riazuddin et al.30 discovered no coding sequence variants within TCF4 to be linked with FECD. The experiments presented here were designed to interrogate the entire TCF4 gene to determine if previously uncharacterized variants might directly impact the pathogenesis of FECD.
Our high coverage, targeted sequencing study encompassing essentially the entire TCF4 locus confirms that rs613872 is the SNV most highly associated with FECD. No new SNVs or indels throughout the 465 kb that was interrogated were found to be better markers for disease. Because the study design did not include the additional 500 kb of sequence identified as associated with FECD in the original GWAS,13 it remains possible that additional variants in that area could be important in the genetics of this condition.
The samples for this study were selected with prior knowledge of their TGC repeat status, and we intentionally oversampled from affected individuals without repeat expansions. Thus, it is not meaningful to use these data to assess the impact of the repeat expansion on disease. However, it remains a useful comparator within this data set. In that context, it is notable that none of the other indels identified in this study were better markers for disease status than the TGC repeat.
Our previous work has shown that the TGC expansion is a better marker for disease status than rs613872,14 and this has also been confirmed independently by others.32 Taken together with the current findings, it is clear that the TNR expansion is the best marker for FECD across the genomic region covered here. These findings are entirely consistent with the hypothesis that FECD joins the list of diseases that are actually a consequence of expanded TNRs. Like FECD, many of these TNR expansion diseases also display dominant inheritance, preferentially affect nonreplicating tissue, and are manifested later in life.
These findings do not directly address the issue of incomplete penetrance of FECD in individuals with expanded alleles. Even within some families, we and others have found that the repeat expansions can occur in both affected and unaffected individuals. Age may be a contributing factor to reduced penetrance, but even some individuals over age 70 with more than 80 TGC repeats remain unaffected. There are numerous factors that could be important in determining the penetrance of an expanded TGC repeat, including the influence of repeat size, possible mosaicism of repeat sizes in different tissues, the fidelity of the repeat sequence expansions, and the possibility that other genes can influence the pathogenic processes. All of these mechanisms have been implicated as affecting penetrance in TNR expansion diseases, but further work in the context of FECD will be required to determine if any of these possibilities influence penetrance in this disease.
Spinocerebellar ataxia type 8 (SCA8) can be caused by an identical repeat expansion in the ATXN8OS gene. That repeat expansion is transcribed into an RNA, which directs the production of homopolymeric proteins.33 In this context, it is interesting that the TGC repeat in the TCF4 gene actually begins with an ATG triplet, which could facilitate translation. In the one sample from an unaffected individual that did have an expansion >50 repeats in this study, we found that the ATG triplet at the beginning of the TGC repeat was deleted on the expanded allele. Of course, much additional work will be required to determine if this change in the DNA sequence at the beginning of the expanded repeats influences events critical to the development of FECD. However, this result emphasizes the possibility that pathogenesis of FECD might involve mechanisms that involve the biology of expanded repeats instead of (or in addition to) having direct effects on the function of the TCF4 gene where the TGC repeats are found.
The limitations of this study include the relatively small patient population studied; however, we are confident in the categorization of affected versus control subjects, given the ease with which the phenotypic hallmark of the disease can be identified and graded. Additionally, we did not examine variants beyond the 465-kb region of the TCF4 gene, bringing up the unlikely possibility of the causative genetic defect being in adjacent loci.
Acknowledgments
Supported by the Biomarker Discovery Program of the Mayo Clinic Center for Individualized Medicine; Research to Prevent Blindness, Inc., New York, New York, United States (through an unrestricted departmental grant and SVP as an Olga Keith Wiess Special Scholar); and National Institutes of Health #UL1 RR024150 (Bethesda, MD, USA).
Disclosure: E.D. Wieben, P; R.A. Aleff, P; B.W. Eckloff, None; E.J. Atkinson, None; S. Baheti, None; S. Middha, None; W.L. Brown, None; S.V. Patel, None; J.-P.A. Kocher, None; K.H. Baratz, P
References
- 1. Wilson SE, Bourne WM. Fuchs' dystrophy. Cornea. 1988; 7: 2–18 [PubMed] [Google Scholar]
- 2. Chi HH, Teng CC, Katzin HM. Histopathology of primary endothelial-epithelial dystrophy of the cornea. Am J Ophthalmol. 1958; 45: 518–535 [DOI] [PubMed] [Google Scholar]
- 3. Eye Bank Association of America. 2012 Eye Banking Statistical Report. Washington, DC: EBAA; 2013. [Google Scholar]
- 4. Tan JC, Holland SP, Dubord PJ, Moloney G, McCarthy M, Yeung SN. Evolving indications for and trends in keratoplasty in British Columbia, Canada, from 2002 to 2011: a 10-year review. Cornea. 2014; 33: 252–256 [DOI] [PubMed] [Google Scholar]
- 5. Keenan TD, Jones MN, Rushton S, Carley FM. Trends in the indications for corneal graft surgery in the United Kingdom: 1999 through 2009. Arch Ophthalmol. 2012; 130: 621–628 [DOI] [PubMed] [Google Scholar]
- 6. Doors M, Berendschot TT, Touwslager W, Webers CA, Nuijts RM. Phacopower modulation and the risk for postoperative corneal decompensation: a randomized clinical trial. JAMA Ophthalmol. 2013; 131: 1443–1450 [DOI] [PubMed] [Google Scholar]
- 7. Yamazoe K, Yamaguchi T, Hotta K, et al. Outcomes of cataract surgery in eyes with a low corneal endothelial cell density. J Cataract Refract Surg. 2011; 37: 2130–2136 [DOI] [PubMed] [Google Scholar]
- 8. Riazuddin SA, Vasanth S, Katsanis N, Gottsch JD. Mutations in AGBL1 cause dominant late-onset Fuchs corneal dystrophy and alter protein-protein interaction with TCF4. Am J Hum Genet. 2013; 93: 758–764 [DOI] [PMC free article] [PubMed] [Google Scholar]
- 9. Gottsch JD, Sundin OH, Liu SH, et al. Inheritance of a novel COL8A2 mutation defines a distinct early-onset subtype of Fuchs corneal dystrophy. Invest Ophthalmol Vis Sci. 2005; 46: 1934–1939 [DOI] [PubMed] [Google Scholar]
- 10. Vithana EN, Morgan P, Sundaresan P, et al. Mutations in sodium-borate cotransporter SLC4A11 cause recessive congenital hereditary endothelial dystrophy (CHED2). Nature Genet. 2006; 38: 755–757 [DOI] [PubMed] [Google Scholar]
- 11. Riazuddin SA, Zaghloul NA, Al-Saif A, et al. Missense mutations in TCF8 cause late-onset Fuchs corneal dystrophy and interact with FCD4 on chromosome 9p. Am J Hum Genet. 2010; 86: 45–53 [DOI] [PMC free article] [PubMed] [Google Scholar]
- 12. Riazuddin SA, Parker DS, McGlumphy EJ, et al. Mutations in LOXHD1, a recessive-deafness locus, cause dominant late-onset Fuchs corneal dystrophy. Am J Hum Genet. 2012; 90: 533–539 [DOI] [PMC free article] [PubMed] [Google Scholar]
- 13. Baratz KH, Tosakulwong N, Ryu E, et al. E2-2 protein and Fuchs's corneal dystrophy. N Eng J Med. 2010; 363: 1016–1024 [DOI] [PubMed] [Google Scholar]
- 14. Wieben ED, Aleff RA, Tosakulwong N, et al. A common trinucleotide repeat expansion within the transcription factor 4 (TCF4, E2-2) gene predicts Fuchs corneal dystrophy. PLoS One. 2012; 7: e49083 [DOI] [PMC free article] [PubMed] [Google Scholar]
- 15. Sepp M, Kannike K, Eesmaa A, Urb M, Timmusk T. Functional diversity of human basic helix-loop-helix transcription factor TCF4 isoforms generated by alternative 5′ exon usage and splicing. PLoS One. 2011; 6: e22138 [DOI] [PMC free article] [PubMed] [Google Scholar]
- 16. Cano A, Portillo F. An emerging role for class I bHLH E2-2 proteins in EMT regulation and tumour progression. Cell Adh Migr. 2010; 4: 528–544 [DOI] [PMC free article] [PubMed] [Google Scholar]
- 17. Lechner J, Dash DP, Muszynska D, et al. Mutational spectrum of the ZEB1 gene in corneal dystrophies supports a genotype-phenotype correlation. Invest Ophthalmol Vis Sci. 2013; 54: 3215–3223 [DOI] [PubMed] [Google Scholar]
- 18. Krafchak CM, Pawar H, Moroi SE, et al. Mutations in TCF8 cause posterior polymorphous corneal dystrophy and ectopic expression of COL4A3 by corneal endothelial cells. Am J Hum Genet. 2005; 77: 694–708 [DOI] [PMC free article] [PubMed] [Google Scholar]
- 19. Krachmer JH, Bucher KD, Purcell JJ, Young CW. Inheritance of endothelial dystrophy of the cornea. Ophthalmologica. 1980; 181: 301–313 [DOI] [PubMed] [Google Scholar]
- 20. Breschel TS, McInnis MG, Margolis RL, et al. A novel, heritable, expanding CTG repeat in an intron of the SEF2-1 gene on chromosome 18q21.1. Hum Mol Genet. 1997; 6: 1855–1863 [DOI] [PubMed] [Google Scholar]
- 21. Lorenzetti DW, Uotila MH, Parikh N, Kaufman HE. Central cornea guttata. Incidence in the general population. Am J Ophthalmol. 1967; 64: 1155–1158 [PubMed] [Google Scholar]
- 22. Krachmer JH, Purcell JJ Jr, Young CW, Bucher KD. Corneal endothelial dystrophy. A study of 64 families. Arch Ophthalmol. 1978; 96: 2036–2039 [DOI] [PubMed] [Google Scholar]
- 23. Li H, Handsaker B, Wysoker A, et al. The Sequence Alignment/Map format and SAMtools. Bioinformatics. 2009; 25: 2078–2079 [DOI] [PMC free article] [PubMed] [Google Scholar]
- 24. DePristo MA, Banks E, Poplin R, et al. A framework for variation discovery and genotyping using next-generation DNA sequencing data. Nature Genet. 2011; 43: 491–498 [DOI] [PMC free article] [PubMed] [Google Scholar]
- 25. Truong HT, Ramos AM, Yalcin F, et al. Sequence-based genotyping for marker discovery and co-dominant scoring in germplasm and populations. PLoS One. 2012; 7: e37565 [DOI] [PMC free article] [PubMed] [Google Scholar]
- 26. Eghrari AO, McGlumphy EJ, Iliff BW, et al. Prevalence and severity of Fuchs corneal dystrophy in Tangier Island. Am J Ophthalmol. 2012; 153: 1067–1072 [DOI] [PMC free article] [PubMed] [Google Scholar]
- 27. Igo RP Jr, Kopplin LJ, Joseph P, et al. Differing roles for TCF4 and COL8A2 in central corneal thickness and Fuchs endothelial corneal dystrophy. PLoS One. 2012; 7: e46742 [DOI] [PMC free article] [PubMed] [Google Scholar]
- 28. Kuot A, Hewitt AW, Griggs K, et al. Association of TCF4 and CLU polymorphisms with Fuchs' endothelial dystrophy and implication of CLU and TGFBI proteins in the disease process. Eur J Hum Genet. 2012; 20: 632–638 [DOI] [PMC free article] [PubMed] [Google Scholar]
- 29. Li YJ, Minear MA, Rimmler J, et al. Replication of TCF4 through association and linkage studies in late-onset Fuchs endothelial corneal dystrophy. PLoS One. 2011; 6: e18044 [DOI] [PMC free article] [PubMed] [Google Scholar]
- 30. Riazuddin SA, McGlumphy EJ, Yeo WS, Wang J, Katsanis N, Gottsch JD. Replication of the TCF4 intronic variant in late-onset Fuchs corneal dystrophy and evidence of independence from the FCD2 locus. Invest Ophthalmol Vis Sci. 2011; 52: 2825–2829 [DOI] [PMC free article] [PubMed] [Google Scholar]
- 31. Stamler JF, Roos BR, Wagoner MD, et al. Confirmation of the association between the CF4 risk allele and Fuchs endothelial corneal dystrophy in patients from the Midwestern United States. Ophthalmic Genet. 2013; 34: 32–34 [DOI] [PubMed] [Google Scholar]
- 32. Mootha VV, Gong X, Ku HC, Xing C. Association and familial segregation of CTG18.1 trinucleotide repeat expansion of TCF4 gene in Fuchs' endothelial corneal dystrophy. Invest Ophthalmol Vis Sci. 2014; 55: 33–42 [DOI] [PMC free article] [PubMed] [Google Scholar]
- 33. Daughters RS, Tuttle DL, Gao W, et al. RNA gain-of-function in spinocerebellar ataxia type 8. PLoS Genet. 2009; 5: e1000600 [DOI] [PMC free article] [PubMed] [Google Scholar]