

Abstract
Multi-variate pattern analysis (MVPA) applied to BOLD-fMRI has proven successful at decoding complicated fMRI signal patterns associated with a variety of cognitive processes. One cognitive process, not yet investigated, is the mental representation of “Yes/No” thoughts that precede the actual overt response to a binary “Yes/No” question. In this study, we focus on examining: (1) whether spatial patterns of the hemodynamic response carry sufficient information to allow reliable decoding of “Yes/No” thoughts; and (2) whether decoding of “Yes/No” thoughts is independent of the intention to respond honestly or dishonestly. To achieve this goal, we conducted two separate experiments. Experiment 1, collected on a 3T scanner, examined the whole brain to identify regions that carry sufficient information to permit significantly above-chance prediction of “Yes/No” thoughts at the group level. In Experiment 2, collected on a 7T scanner, we focused on the regions identified in Experiment 1 to examine the capability of achieving high decoding accuracy at the single subject level. A set of regions—namely right superior temporal gyrus, left supra-marginal gyrus, and left middle frontal gyrus—exhibited high decoding power. Decoding accuracy for these regions increased with trial averaging. When 18 trials were averaged, the median accuracies were 82.5%, 77.5%, and 79.5%, respectively. When trials were separated according to deceptive intentions (set via experimental cues), and classifiers were trained on honest trials, but tested on trials where subjects were asked to deceive, the median accuracies of these regions still reached 66%, 75%, and 78.5%. These results provide evidence that concealed “Yes/No” thoughts are encoded in the BOLD signal, retaining some level of independence from the subject’s intentions to answer honestly or dishonestly. These findings also suggest the theoretical possibility for more efficient brain-computer interfaces where subjects only need to think their answers to communicate.
Keywords: dorsolateral prefrontal cortex, fMRI, multivariate pattern analysis, searchlight, deception
Introduction
Despite Blood Oxygenation Level Dependent (BOLD) functional Magnetic Resonance Imaging (fMRI) being an indirect, relatively low-resolution measure of neural activity (Buxton, 2012; Fox et al., 2012; Logothetis et al., 2001), the spatiotemporal response patterns reflected in fMRI signals contain detailed information about mental processes. In fact, using a variety of multivariate pattern analysis (MVPA)(Norman et al., 2006), researchers have successfully decoded the category of viewed objects from BOLD signals in the ventral temporal cortex (Haxby et al., 2001); the subjective mnemonic status of visual stimuli using the BOLD patterns from a distributed network of parietal and frontal regions (Rissman et al., 2010); a sound category associated with sound-implying, silent, visual stimuli looking solely at patterns within the auditory cortex (Meyer et al., 2010); and free choices of abstract intentions from patterns in the medial prefrontal and parietal cortices (Soon et al., 2013). All this evidence suggests that although fMRI signal has insufficient temporal and spatial resolution to depict fine-scale neuronal events, spatiotemporal hemodynamic response patterns recorded via fMRI permit successful and robust decoding of low- to high-level representations of information (Haynes and Rees, 2006; Xu et al., 2012; Yang et al., 2012).
In this study, we attempt to decode one type of high-level information: An individual’s concealed true thoughts when answering questions. Previous psychological research has established that when answering a question, a true thought is always generated and kept in mind; even when people intend to lie (Johnson et al., 2004; Langleben et al., 2002; Spence et al., 2001; Spence et al., 2004; Sun et al., 2013). Here, the definition of “true thought” is subjective, in the sense that the individual’s thoughts may or may not be objectively correct (e.g., inaccurate knowledge may lead a subject to believe New York is the capital of the U.S. For this subject this is a “true thought”, despite Washington, DC being the objectively correct answer). Moreover, in the context of this work, a true thought is not a verbal or motoric response, but a piece of information that is generated by a cognitive process and represented as signature patterns of brain activity. When one intends to lie, a true thought can be intentionally superseded to form an overt lie (Spence et al. 2001; 2004). The possibility of being able to reliably decode such (concealed) true thoughts directly from mental activity could have deep implications for the legal community, as well as, for the development of efficient brain-computer interfaces that could open new means of communication with locked-in patients (Monti et al., 2010; Owen et al., 2006).
Previous functional neuroimaging studies of deception have focused mainly on detecting the neural correlates of the complex cognitive processes that convert true thoughts into lies (Christ et al., 2009; Johnson et al., 2004; Langleben et al., 2005; Langleben et al., 2002; Sip et al., 2010), and on segregating honest and dishonest intentions from the neuroimaging data (Spence et al., 2001; Sun et al., 2013). Here, we take a different approach and focus on the mental representations of the true thoughts that precede honest or dishonest overt responses. In particular, we are interested in examining whether spatial patterns of fMRI signals contain sufficient information to reliably detect the neural response that follows questioning; and whether the intention to deceive affects the robustness of these patterns.
As a proof-of-principle, here we examine the theoretical possibility of decoding true “Yes/No” thoughts to simple binary questions independently of one’s honest/dishonest intentions when generating overt responses. Precisely, we try to address two specific questions: 1) Whether spatial patterns of hemodynamic responses carry sufficient information to allow reliable decoding of true “Yes/No” thoughts? 2) To what extent is decoding of these “Yes/No” thoughts independent of the honest/dishonest intentions for generating an explicit overt answer?
To address these questions, we adopt a two-step experimental approach, as previously suggested by Etzel et al. (2013). First, in Experiment 1, we conduct an exploratory analysis to identify brain regions that contain sufficient information to permit decoding of true “Yes/No” thoughts with accuracy significantly above chance at the group-level. This first experiment is akin to a “functional localizer” session (see (Cukur et al., 2013; Fox et al. 2009) for examples of this approach). To identify these target regions, we adopted a well-established task-cueing paradigm (Barber and Carter, 2005; Meiran et al., 2000) and a MVPA searchlight procedure (Hampton and O’Doherty, 2007; Haynes et al., 2007; Kriegeskorte et al., 2006; Soon et al., 2008). In Experiment 2, using a completely independent dataset obtained at a higher magnetic field (7T), we evaluate the capability to achieve high decoding accuracy at the single-subject level. The decoding power is quantified by the decoding accuracies obtained at different levels of trial averaging. If true “Yes/No” thoughts generate consistent differentiable patterns of hemodynamic activity in any of the target regions detected in Experiment 1, trial averaging should produce an increase in decoding accuracy as noise decreases. Conversely, if these regions do not contain such stable and differentiable patterns, averaging should not produce any significant changes in decoding accuracy. Finally, in Experiment 2 we also evaluate how deceiving intentions for overt responses affect decoding accuracy.
In Experiment 1 we found a series of 8 regions—namely left para-hippocampal gyrus, left middle frontal gyrus, left inferior frontal gyrus, right inferior frontal gyrus, left medial frontal gyrus, left supra-marginal gyrus, right superior temporal gyrus, and left superior temporal gyrus–which performed significantly above chance at the group level. In Experiment 2, a subset of these regions—namely right superior temporal gyrus, left supra-marginal gyrus, and left middle frontal gyrus–were found to provide median decoding accuracies of 82.5%, 77.5%, and 79.5%, respectively, when 18 trials were averaged regardless of deceiving intentions (mixed-intentions analysis). When decoding was attempted in a cross-intention setup (e.g., classifier was trained only with “Honest” trials, but decoding was attempted in “Dishonest” trials), classification accuracy for these regions still stayed at 66%, 75%, and 78.5% (median values across subjects). Overall, our results suggest that decoding of true “Yes/No” thoughts from fMRI may be possible, yet achievable decoding accuracies with the current approach is not yet sufficient for real world applications.
Materials and Methods
Experiment 1
Participants
Ten right-handed college students (6 females, age range 20–29 years, mean age = 25) participated in this experiment. All participants had normal or corrected-to-normal vision and had no history of neurological or psychiatric disorder. After a full description of the study, written informed consent was obtained for each participant following a protocol approved by the Ethical Committee at Institute of Psychology, Chinese Academy of Sciences.
Experimental Materials
We composed 160 “Yes/No” questions (binary questions) about simple facts (e.g., “Is one minute 60 seconds?”; “Is Beijing the capital of China?”). The questions were stated in Chinese using 5 to 12 characters. Half the questions were expected to produce “Yes” true thoughts on average.
Experimental Paradigm
Prior to entering the scanner, all participants answered all 160 questions to the best of their knowledge by filling out a paper questionnaire. We used these responses to ensure participants understood the questions and to have a record of what each subject considered the true answers to the questions (based on their prior knowledge and experiences). We used these recorded responses to label trials during the analysis. Each question was presented twice inside the scanner.
The experimental paradigm for the functional runs in Experiment 1 was constructed on the basis of a fast event-related task-cueing paradigm previously developed for studies about overcoming existing response tendencies (Barber and Carter, 2005; Meiran et al., 2000). As shown in Fig. 1, each trial starts with an intentional cue (2 seconds) that informs the subjects whether they should answer the following question honestly or dishonestly. The word “Honest” was used to instruct participants to answer the following question honestly, while the word “Dishonest” was used to instruct participants to overtly respond the opposite of what they consider true. This cue was followed by a visually presented question (4 seconds). Participants were instructed to read the question but not to respond immediately. After a variable delay period (2, 4, or 6 seconds), during which the question was no longer visible, a “Please Answer” prompt appeared for 2 seconds on the screen. Participants were instructed to respond using an MRI compatible response box at that moment. Subjects were instructed to use the right thumb to answer “Yes” and the left thumb to answer “No”. Button assignment remained constant for the whole duration of this experiment, but was counter-balanced across subjects. Recorded responses were used to eliminate invalid trials in which participants did not complete the task successfully.
Figure 1.
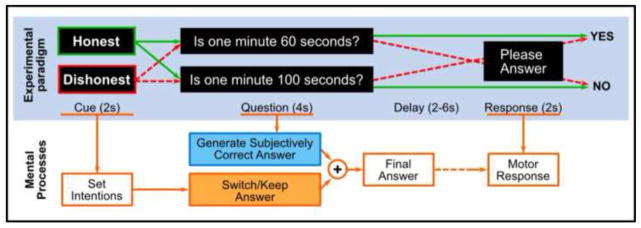
One trial of experimental paradigm for Experiment 1. At the beginning of each trial, an instruction cue is displayed for 2s, asking subjects to be either honest or dishonest when answering the following question. Then a question on simple facts is presented for 4s. The question is a binary question expecting either “Yes” or “No” answer. After a random delay period of 2–6s, an instruction is displayed asking subjects to report the final answer with MRI compatible button boxes. The mental processes that accompany task performance are summarized below the paradigm. With this task, subjects generate a true thought to the question, process it according to the instructed “Honest” or “Dishonest” intention, and report the final answer when prompted to make motor response.
Each participant had to answer a total of 320 questions distributed across 10 functional runs (32 trials per run). Trial types were counter-balanced so that each run contained 8 trials in which the expected true thought was “Yes” and subjects were instructed to be honest (“Honest-Yes”), 8 trials in which the expected true thought was “Yes” and subjects were instructed to be dishonest (“Dishonest-Yes”), 8 trials in which the expected true thought was “No” and subjects were instructed to be honest (“Honest-No”), and 8 trials in which the expected true thought was “No” and subjects were instructed to be dishonest (“Dishonest-No”). Stimuli were programmed with E-Prime (Psychology Software Tools, Inc., Pittsburgh, PA, USA). Stimuli presentations were driven by scanner trigger signals so the onsets of the cues, questions, and response prompts were all synchronized to the acquisitions of volumes. Prior to the fMRI scan, the participants received a 20-minute training session to get familiar with the task.
Data acquisition
A Siemens 3T Trio scanner (Siemens, Erlangen, Germany), equipped with a standard head coil, was used in Experiment 1. Functional scans were obtained using a gradient-echo EPI sequence (33 slices, TR/TE = 2000/30ms, slice thickness = 5mm, FOV = 192mm, flip angle = 90°, image matrix: 64×64, 266 volumes) covering the whole brain. A high-resolution anatomical scan was acquired for each participant (MPRAGE; TR/TE/TI=2530/3.39/1100ms, FA=7°, FOV=256×256mm, 128 sagittal slices, slice thickness/gap=1.33/0mm, in-plane resolution= 1×1mm). The entire experiment lasted for approximately 1.8 hours. The stimuli were presented via a video projector (resolution 1024×768 pixel, 60 Hz) onto a screen located behind the scanner bore. Participants viewed the stimuli through mirror glasses.
Preprocessing/Response Estimation
The correct button-press response for each trial was generated combining the answer provided in the pre-scan questionnaire with the given intentional cue. Incorrect trials were excluded from further analysis (see Results).
Image preprocessing was conducted using AFNI (Cox, 1996) (http://afni.nimh.nih.gov/afni). For functional scans, the first five volumes in each run were discarded. Pre-processing steps included: slice time correction, head motion correction, and intensity normalization (e.g., signal percent change). No spatial smoothing was performed. Co-registration transformations between high-resolution anatomical scans and functional images were estimated. The high-resolution anatomical scans were transformed into Talairach coordinate space (Talairach and Tournoux, 1988) using the Talairach template provided with the AFNI software. Parameters for spatial normalization of the functional images were then obtained by combining the co-registration and the anatomical spatial normalization transformations. Spatial normalization was applied to the regression coefficient maps (see below).
Each functional run for each subject was subsequently input to a separate regression analysis using a finite impulse response (FIR) model. The FIR model uses six Dirac delta functions (each for a time bin) centered at acquisitions times (TRs) ranging from cue onset to 8s after question onset. Each trial type (“Honest-Yes”, “Honest-No”, “Dishonest-Yes”, “Dishonest-No”) was modeled separately. Additionally the FIR model was also used to model the two possible motor responses (“Yes” or “No”). This procedure estimated hemodynamic response patterns (beta coefficient maps) for each of the six time bins following cue onset and for each trial type. Motion parameters obtained during head motion correction were used as additional nuisance regressors. Because each run was analyzed separately, we obtained ten different estimations (beta coefficient maps) at each time bin for each trial type. These maps were then transformed into Talairach space using the parameters estimated above and resampled to 3×3×3mm3.
Searchlight Decoding
To identify brain regions carrying predictive information for distinguishing between true “Yes” and “No” thoughts, we used a MVPA searchlight procedure (Kriegeskorte et al., 2006) based on a Gaussian Naïve Bayesian (GNB) classifier implemented in the Princeton MVPA toolbox (http://code.google.com/p/princeton-mvpa-toolbox/) for MATLAB™ (MathWorks, Natick, MA). This approach allows searching for informative voxels in an unbiased manner across the whole brain at every time bin (Soon et al., 2008). The GNB classifier is a linear model that has been widely applied in both basic neuroscience research (Norman et al., 2006; Mitchell et al., 2004) and clinical applications (Coutanche et al., 2011). Several studies show that GNB is able to provide almost equal performance to the commonly used linear support vector machine (l-SVM) (Mitchell et al., 2004; Misaki et al., 2010); however, because of the relatively small computational cost of GNB, we decided to use this model for the current study.
In each of the 10 runs per subject the beta estimates resulted in four hemodynamic responses. The responses within each run for the “Honest-Yes” and “Dishonest-Yes” were averaged to create a mean beta-map hemodynamic response for true “Yes” thought. Similarly the responses for “Honest-No” and “Dishonest-No” were averaged to create a mean beta-map hemodynamic response for true “No” thought. The true “Yes” and “No” beta maps from the 10 runs (20 maps for each time bin) were input to a searchlight analysis, where classifiers were trained to distinguish between true “Yes” and “No” thoughts regardless of intentions. The general procedure described below was applied separately for each of the six time bins. A graphical description of the procedure is shown in Supplementary Fig. S1.
Around each voxel in the gray matter (a gray matter mask was obtained from the Colin atlas (Eickhoff et al., 2005) in AFNI with 34777 voxels), a spherical cluster with a radius of two voxels was defined (33 voxels). Voxels outside of the gray matter mask were removed from the spherical cluster. Within this spherical cluster, the 20 beta-maps representing true “Yes” and true “No” were used to train and test a GNB classifier that distinguishes the true thoughts. A 10-fold cross-validation procedure (leave-two-out) was conducted to measure the overall performance of the classifier. In each of the 10 iterations, the local beta-maps (within the spherical cluster) estimated from a run acted as the test dataset (two samples for test), while those from the other nine runs were used as the training datasets (18 samples for training). Overall performance for each voxel was calculated by averaging the ten classification accuracies from the 10-fold cross-validation. In this way, the classification accuracy on each voxel reflected the information carried in the local neighborhood.
Group-level significance was examined by voxel-wise t-tests comparing the mean accuracy maps (from the ten-fold cross-validation) against 50% (expected chance-level). The resultant group-level t-maps were thresholded with a voxel-wise significance of p<0.005. The multiple comparison error was corrected by applying a cluster size threshold derived from Monte Carlo simulations (Xiong et al., 1995) as implemented in AFNI program “AlphaSim”. The smoothness for the Monte Carlo simulation was estimated using AFNI program “3dFWHMx” from the residual time series of the regression analysis. Smoothness was computed separately for each run of each subject, and then these estimated values were averaged to compute a single smoothness value (mean=5.7mm, standard deviation=0.15mm). This resulted in a minimum cluster size threshold of 20 voxels (540 mm3) to reach a cluster level significance of p<0.05 (family-wise error, FWE).
For each time bin in the estimated hemodynamic response function, we conducted a separate group-level statistical test. Although there is temporal correlation in BOLD signals across time points, we decided to analyze time bins separately because: (1) several asynchronous mental processes are required to perform the task; (2) a number of studies have shown that time points other than the peak of the hemodynamic response can carry information about neural activity (Yacoub et al., 2001; Heeger and Ress, 2002); and (3) different regions respond with very different hemodynamic temporal patterns to the same task (Gonzalez-Castillo et al., 2012). Moreover, we decided not to correct for multiple comparisons across time to avoid incurring in an excessive number of false negatives during this initial explorative phase of the study. Although this approach help us identify as many target regions as possible for their further evaluation in Experiment 2, it also precludes us from making any specific inferences about the exact timing of events.
Confirming inter-subject consistency using ROI pattern classification analysis
To examine whether the ROIs identified by the group level t-tests were consistently informative in individual subjects, we performed ROI-based classification analyses to decode true “Yes/No” thoughts for individual subjects. For each ROI, we extracted a spatial pattern representing true “Yes” thought and one representing true “No” thought from the beta maps in each of the 10 runs. These 20 patterns were used to train a classifier to distinguish the true “Yes/No” thoughts. The 10-fold cross-validation procedure was identical to that used in the searchlight analyses, and an averaged decoding accuracy was obtained for each ROI in each subject.
We performed permutation tests to determine the significance of the decoding accuracies. Specifically, for each ROI in each subject, the “Yes/No” labels of the 20 spatial patterns were randomly permuted before the samples were used to train and test the classifiers. This procedure was repeated 1000 times to generate a null-distribution of the decoding accuracy. The significance of the original decoding accuracy for the given ROI was then determined using the null-distribution. For each of the ROIs identified in the searchlight analysis, we reported the number of subjects exhibiting significant decoding accuracy.
Experiment 2
Rationale
In order to verify the decoding performance of the informative brain regions identified in Experiment 1, an independent data set was used in Experiment 2. In this second experiment we opted for a slow event design that permitted us to average across trials without the need to enforce any a priori assumptions about response shape inherent to most fitting techniques. As previously mentioned, trial averaging was used to optimize the signal-to-noise ratio of spatial patterns input to the classifier. If spatial patterns from a given region genuinely reflect responses evoked by the “Yes/No” thoughts, then decoding accuracy should increase towards the desirable goal of 100% as signal-to-noise ratio increases. If not, decoding accuracy should not change with the number of averaging. We tested this working hypothesis in all regions marked as informative in Experiment 1, as well as in a control region not expected to carry robust predictive information (see below). We also performed a permutation test, in which we randomized the “Yes/No” labels of the trials being averaged. This provided a second control condition to compare against.
Participants
Seven healthy volunteers (2 females, age range 22–43 years, mean age = 29) were recruited at National Institute of Mental Health, Bethesda, MD, USA. All participants had normal or corrected-to-normal vision and had no history of neurological or psychiatric disorder. After a full description of the study, written informed consent was obtained from each participant following a protocol approved by the Ethical Committee at National Institute of Mental Health, USA.
Experimental Materials
The visual stimuli and pre-scan questionnaire for this experiment were presented in English. One hundred and twenty-four “Yes/No” questions about simple facts were used. Most of these questions correspond to English translations of the questions used in Experiment 1. A small set of questions was substituted by completely new questions to fit cultural differences. For half of the questions (62 questions) the expected answer was “Yes”.
Experimental Paradigm
In this second experiment, the paradigm from Experiment 1 was modified to become a “slow” event-related design with constant long delay periods (12s). Thus, the regression step is no longer needed and hemodynamic responses for each trial type can be obtained by simple trial averaging (point-to-point averaging of the signal after the question onset). This paradigm is shown in Fig. 2. Each trial had the following structure: intentional cue (2s); simple-fact question (4s); delay period (8s); response prompt (2.3s); fixation period (11.7s). The intentional cue consisted of the word “Honest” written in a green font to instruct subjects to respond honestly, or the word “Dishonest” written in a red font to instruct subjects to respond dishonestly. During the question period, the question appeared in the center of the screen in white font. During the delay period, a fixation cross appeared at the center of the screen and subjects were instructed to keep their answer in mind. For the prompt to respond, one of two possible texts appeared in the center of the screen: “Y N”, which instructed participants to use the button box in their left hands to answer “Yes” and the one in their right hands to answer “No”; or “N Y”, which corresponded to the opposite assignment of “Yes/No” to the right/left hands. Which prompt screen appeared at the end of each trial was randomized. This randomization precluded subjects from keeping their responses in mind during the delay period in terms of motor actions, as they don’t know which button signals “Yes” and which button signals “No” until the end of the delay period. The 124 questions (62 expecting a “Yes”, and 62 expecting a “No”) were randomly assigned into 6 runs. The intentions (“Honest/Dishonest”) and the two types of response prompts (“Y N” and “N Y”) were assigned to the questions in a counter-balance manner.
Figure 2.
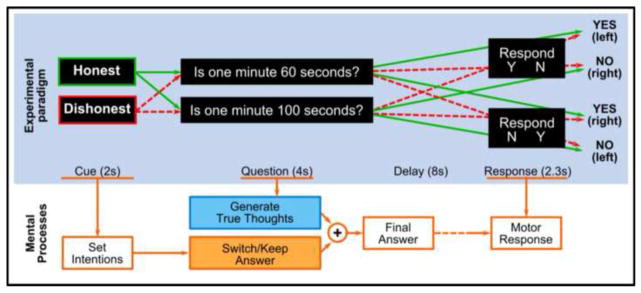
One trial of experimental paradigm for experiment 2. At the beginning of each trial, an instruction cue is displayed for 2s, asking subjects to be either honest or dishonest when answering the following question. Then a question on simple facts is presented for 4s. The question is a binary question expecting either “Yes” or “No” answer. After a delay period of 8s, an instruction is displayed asking subjects to report the final answer with MRI compatible button boxes. Two possible instructions may appear: “Y N” or “N Y”. The first type of instruction indicates the button box on the subject’s left hand signals “Yes”, and the left signals “No”. The second type of instruction indicates the opposite. The subjects do not know which button to press. The red and green arrows show all possible combinations across the stimuli types and indicate the expected response for all combinations. The mental processes that accompany task performance are summarized below the paradigm. With this task, subjects generate a mental responses to the question, process it according to the instructed “Honest” or “Dishonest” intention, and keep it in mind until the response instructions appear to make motor responses.
Data acquisition
A Siemens 7T scanner equipped with a 32-channel head coil was used in Experiment 2. Functional scans were obtained using a gradient-echo EPI sequence (54 slices, TR/TE = 2000/25ms, slice thickness = 2mm, FOV = 192 mm, flip angle = 50°, image matrix: 96×96, 343 volumes) covering the whole brain. An additional high-resolution anatomical scan was acquired in each participant (MPRAGE; TR/TE/TI=3000/3.88/1500ms, FA = 6°, FOV = 256×256mm, 192 sagittal slices, slice thickness/gap = 1.00/0.50 mm, in-plane resolution = 1×1mm). The stimuli were presented via a video projector (resolution 1024×768 pixel, 60 Hz) that projected from the head-end of the scanner onto a screen. Participants viewed the projection through mirror glasses. The data for subject 6 were acquired in two sessions; those for the other subjects were acquire in a single session.
Preprocessing
The correct button-press response for each trial was generated combining the answer provided in the pre-scan questionnaire, the given intentional cue, and the response instruction. Incorrect trials were excluded from further analysis (see Results). The data for one subject were excluded because the subject fell asleep during the scanning session.
High-resolution anatomical scans were corrected for coil inhomogeneity and transformed into the Talairach space (Talairach and Tournoux, 1988). Pre-processing steps for the functional scans included: discarding the first five volumes, slice time correction, head motion correction, co-registration to the anatomical scan following the procedures described in Gonzalez-Castillo et al. (2013), intensity normalization (e.g., signal percent change), drift removal (using 4th order polynomials), and regression of six motion estimates.
Regions of interest (ROIs) showing decoding accuracy significantly above chance at the group level in Experiment 1 were brought into each subject’s space using the inverse of the spatial transformation matrices computed during the alignment and spatial normalization steps. All matrices were combined into a single matrix to avoid multiple interpolation steps. Moreover, ROI masks were dilated by 1 voxel in subject’s space to account for anatomical variability across subjects. The union of all ROIs was regarded as an additional ROI in the analysis. This ROI allows us to examine the performance of the classifier when combining all ROIs into a single larger multivariate pattern, instead of treating each ROI independently.
For each trial, we extracted spatial patterns of the preprocessed signal for the time points corresponding to 2s, 4s, and 6s after question onset. According to Experiment 1, these time points were the most informative outside primary visual and motor. To normalize the intensity scales of the spatial patterns for trial averaging, the median value (across all voxels in all time points) was subtracted from each pattern and the results were then divided by the median absolute deviation. This scaling procedure does not affect the spatial patterns. We used median value instead of mean value to avoid the impact of outliers.
Mixed-Intention MVPA in regions of interest
Figure 3 provides a graphical demonstration of the following procedure. All trials were categorized into two classes according to the true thoughts (“Yes” vs. “No”), and no distinction was made between trials with “Honest” or “Dishonest” intentions in generating overt responses (mixed-intention scenario). GNB classifiers were trained and tested using the response patterns generated by averaging an increasing number (Navg = 1–18) of randomly selected trials. When averaging, trials of the same type (e.g., true “Yes”) were randomly chosen without replacement. We conducted classification following a leave-two-trials-out cross-validation scheme (see Fig. 3 for a demonstration with Navg = 2). For each ROI and Navg level, all the spatial patterns from the training trials were pooled together to train a classifier, with the three spatial patterns in each trial used as three samples in the training. The classifier was then used to predict the label for each spatial pattern in the test set. To generate a final prediction (“Yes” vs. “No”) for each trial (containing 3 patterns, one for each time point), an equal weight voting system was used to make a second-level decision, so that the label with the higher number of occurrences (e.g., 2 or 3) was assigned as the final prediction (see Fig. 3). Given the fixed number of experimental trials, the number of training samples decreased with the increase of Navg. The number of training samples ranged between 142 (for Navg=1) and 18 (for Navg=18). At all averaging levels, there were always 6 test samples (due to leave-two-trial-out cross-validation). Since the trials were randomly selected when averaging, we repeated the averaging and decoding procedure 50 times and obtained averaged accuracies and their 95% confidence intervals (computed across the 50 averaged accuracies so that the sample size is the same across Navg = 2–18).
Figure 3.
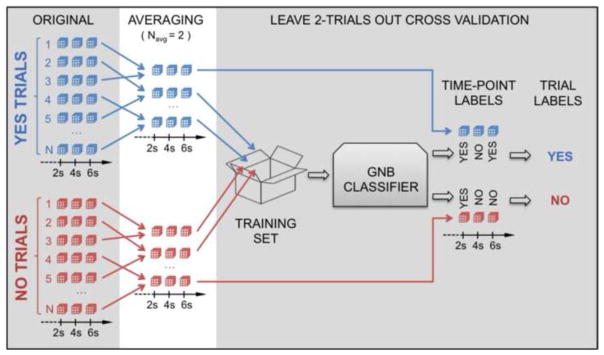
Illustration of the averaging and voting system used to compute decoding accuracies at the single-subject level in Experiment 2. The left most column (“ORIGINAL”) shows individual patterns of hemodynamic responses for “Yes” (blue) and “No” (red) trials for a given ROI as cubes. Patterns for the 3 time-points of interest (2s, 4s, and 6s after question onset) are depicted. The second column (“AVERAGING”) shows an exemplary permutation of how individual patterns are averaged for Navg = 2. The number of available trials for classification is reduced as a result of the averaging. To the right of the figure we can see how the leave-two-out cross-validation scheme proceeds. All averaged trials with the exception on one “No” trial and one “Yes” trial are used for classifier training. The excluded trials comprise the test set for this iteration. The right most part of the figure shows how the voting system works. In this particular case, when we test the classifier with the “Yes” test trial, the classifier decided “Yes” for time-points 2s and 6s, but “No” for 4s. Because “Yes” is the label with the higher number of occurrences, the final prediction for this trial becomes “Yes”. A similar scenario is shown for the “No” test trial which has two “No” labels for time-points 4s and 6s that translate into a “No” for the final prediction.
To summarize the decoding power of each ROI, we computed an area under curve (AUC) index for each ROI as:
where ACCNavg is the decoding accuracy obtained at the trial averaging level Navg, and 50% is the theoretical chance level of the decoding accuracy. This index represents the amount of total accuracy gain with increasing Navg. The higher AUC value for a given ROI, the higher the likelihood that such ROI contains an activity pattern that help reliably differentiate between true “Yes” and true “No” thoughts. ROIs were ranked according to this AUC index for presentation and discussion purposes.
Additionally, we performed two control analyses. These control analyses were performed under the null-hypothesis that the spatial pattern of a region does not carry information about the true “Yes/No” thoughts. For the first control condition, we performed the same analysis described above but using activity patterns from a primary visual cortex region of size equal to the smallest ROI discovered in Experiment 1. The AUC index for this control region was also computed and compared with the other ROIs. The second control analysis was conducted by randomizing class labels of the training response patterns. We did this for 30 permutations (each contained 50 repetitions with random trial averaging) for each combination of ROI and Navg level. This second control computation provides a null-distribution of accuracy under the hypothesis that there is no information for distinguishing true “Yes/No” thoughts in the spatial patterns.
Cross-intention MVPA in regions of interest
To investigate whether decoding performance of true “Yes/No” thoughts is modulated by intention to respond honestly or dishonestly, trials were first split into “Honest” and “Dishonest” trials according to the response intentions, and then a cross-intention MVPA was conducted. The rationale underlying this analysis is that if a classifier trained using “Honest” trials can accurately classify the “Yes/No” labels of the “Dishonest” trials, and verse visa, the spatial patterns representing the “Yes/No” thoughts should be highly similar across intentions. Specifically, the GNB classifiers were trained with only one type of trial (e.g., only “Honest” trials) to predict the true thought labels (“Yes” vs. “No”) for the other type of trial (e.g., only “Dishonest” trials). The same procedure described in the above section was employed. The accuracy of the classifiers was then determined by predicting the “Yes” vs. “No” labels of the “Dishonest” trials. The roles of the “Honest” and “Dishonest” trials were then switched, forming a two-fold cross-validation. The two resulting accuracies were averaged to obtain the final cross-intention decoding accuracy. Similar to the mixed-intention analysis, we computed the AUC index for each ROI to quantify the accuracy gain derived from trial averaging. To examine whether training classifiers with “Honest” trials and training classifiers with “Dishonest” trials could procedure similar decoding performance, we also studied the decoding accuracy for each of the two cross-validation iterations separately. The two control analyses described above were also conducted in this cross-intention decoding scenario.
Results
Experiment 1: Explore brain regions encoding “Yes/No” thoughts
The pre-scan inquiries showed that the true thoughts from all subjects agreed with the designed answers to the questions. On average, the responses in 94.9% (SD = 6.1%) of the trials agreed with those derived by combining the answers from the questionnaire and the given intentions. Invalid trials with incorrect responses were excluded from further analyses.
Figure 4 shows which regions contain information that produces decoding accuracies significantly above chance and at which time points the information can be decoded at the group level. The group mean decoding accuracies within these regions and the coordinates of the peak voxels are shown in Table 1. At the question onset, no region showed above-chance decoding accuracy. Two seconds after question onset, a region within the left para-hippocampal gyrus was identified (Fig. 4A). Six regions with accuracy significantly above chance, including the left middle frontal gyrus, left inferior frontal gyrus and its counterpart on the opposite hemisphere, left medial frontal gyrus, left supra-marginal gyrus, and right superior temporal gyrus, were identified at 4s after question onset (Fig. 4B). One of these regions, the left middle frontal gyrus, still contained sufficient information to produce accuracy significantly above chance at 6s after question onset. Additionally, a medial portion of the left superior temporal gyrus also appeared in the searchlight results for this moment in time (Fig. 4C). Finally, at 8s after question onset, a series of motor and visual areas appeared to convey information about the “Yes/No” thoughts, most likely as a result of contamination from the actual overt response period. To test the credibility of the searchlight procedure, we applied the same analysis at the onset of the cue. As expected, no region was found informative in decoding the true thoughts at this early time point. We also conducted t-tests to examine the univariate difference between the “Yes” and “No” thoughts, but failed to detect clusters showing significant difference between the two conditions.
Figure 4.

Group-level searchlight maps showing regions with decoding accuracy significantly above chance level. The colors indicate t statistics with a degree of freedom of 9. Each panel shows significant regions identified at different times (Panel A: 2s, B: 4s, C: 6s, and D: 8s) after question onset. (A) 2s after question onset: left para-hippocampal gyrus; (B) 4s after question onset: left middle frontal gyrus, left inferior frontal gyrus, right inferior frontal gyrus, left medial frontal gyrus, left supra-marginal gyrus, and right superior temporal gyrus; (C) 6s after question onset: left middle frontal gyrus and left superior temporal gyrus; (D) 8s after question onset: bilateral posterior parietal cortex and bilateral ventral occipital cortex. The maps are threshold at t>3.7, corresponding to voxel-wise significance of 0.005. The size of all clusters is larger than 20 voxels (540mm3), yielding a family-wise error (FWE) of p<0.05.
Table 1.
Mean decoding accuracies and peak voxel coordinates of the regions of interest showing significant above-chance accuracies in Experiment 1.
| Time bin | ROI | Size (mm3) | x (R-L) | Y (A-P) | z (I-S) | Mean accuracy (%) |
|---|---|---|---|---|---|---|
| 2s | Left para-hippocampal gyrus | 621 | 28.5L | 31.5P | 9.5I | 74.7 |
| 4s | Left supra-marginal gyrus | 3087 | 46.5L | 58.5P | 29.5S | 73.4 |
| Left middle frontal gyrus | 1593 | 40.5L | 7.5A | 41.5S | 72.0 | |
| Right superior temporal gyrus | 1566 | 55.5R | 49.5P | 14.5S | 70.4 | |
| Left inferior frontal gyrus | 891 | 46.5L | 22.5A | 23.5S | 73.2 | |
| Right inferior frontal gyrus | 756 | 55.5R | 16.5A | 23.5S | 70.2 | |
| Left medial frontal gyrus | 702 | 1.5L | 37.5A | 35.5S | 69.3 | |
| 6s | Left superior temporal gyrus | 1053 | 43.5L | 13.5A | 35.5S | 70.8 |
| Left middle frontal gyrus | 1026 | 49.5L | 34.5P | 2.5S | 69.5 | |
| 8s | Left para-hippocampal gyrus | 918 | 19.5L | 52.5P | 6.5I | 70.0 |
| Right fusiform gyrus | 918 | 19.5R | 70.5P | 6.5I | 73.1 | |
| Right posterior parietal cortex | 648 | 28.5R | 55.5P | 41.5S | 69.0 | |
| Left fusiform gyrus | 1782 | 4.5R | 64.5P | 8.5S | 68.4 | |
| Left posterior parietal cortex | 540 | 51.5L | 61.5P | 50.5S | 70.9 |
Note: The directions in the coordinates are reported using R (right), L (left), A (anterior), P (posterior), I (inferior), and S (superior) to avoid confusions with the “+/−” signs.
In addition to the group-level test, we conducted ROI analyses to evaluate whether the ROIs identified in the searchlight analysis are informative for decoding the true “Yes/No” thoughts in most individual subjects. Here we report the number of subjects for whom the individual classification accuracy is significantly above chance level (p<0.05): left para-hippocampal gyrus (2s): 8/10; left middle frontal gyrus (4s): 10/10; left inferior frontal gyrus (4s): 10/10; right inferior frontal gyrus (4s): 8/10; left medial frontal gyrus (4s): 10/10; left supra-marginal gyrus (4s): 7/10; right superior temporal gyrus (4s): 5/10; left middle frontal gyrus (6s): 8/10; and left superior temporal gyrus (6s): 8/10. These observations support the findings from the group-level test.
Experiment 2: Mixed-Intention Decoding Accuracy at the Single-Subject Level
The pre-scan inquiries showed that the true thoughts from all subjects agreed with the designed answers to the questions. Combining the designed answers to the questions, the given intentions, and the response rules indicating which button signals “Yes”, we derived the expected response for each trial. The trials whose responses did not agree with the expectations were excluded from further analyses. The ratio of valid trials was 88.2%–99.3% for the six subjects.
Figure. 5A shows AUC values (both individual subject and median values) for the different ROIs. The AUC value indicates the amount of total accuracy gain with the increasing number of averaged trials. The ROIs, including the union of all ROIs defined in Experiment 1 and the control region, were sorted according to median AUC values across all subjects. The union of all ROIs ranked first, suggesting that combining the information from all ROIs yields the highest decoding power. The right superior temporal gyrus (r-STG), the left supra-marginal gyrus (l-SMG), and the left middle frontal gyrus (l-MFG, including the two ROIs identified at 4s and 6s after question onset in Experiment 1) were ranked second to fifth. The two ROIs in the l-MFG showed the highest inter-subject consistency in AUC index. As expected, the control region was ranked last.
Figure 5.
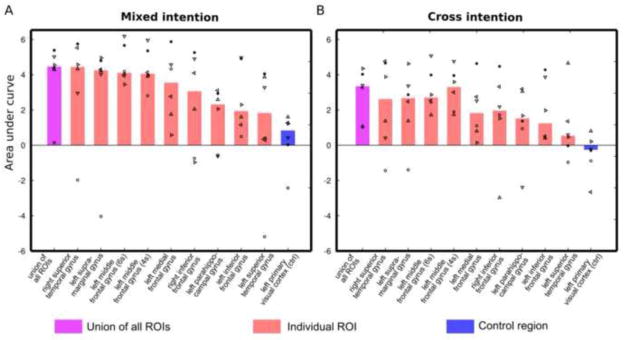
Group-level summary of decoding power for all ROIs in mixed-intention decoding (A) and cross-intention decoding (B). The ROIs are ranked according to the “area under curve” (AUC) in the mixed-intention decoding scenario (A). The AUC indicates the total gain of decoding accuracy with increasing levels of trial averaging (Navg). The bars indicate median value of AUC across six subjects. The AUC value for individual subjects are marked using different symbols. In the mixed intention decoding (A), the union of all ROIs (pink bar) has the highest median AUC, followed by the right superior temporal gyrus, the left supra-marginal gyrus, and the two ROIs at the left middle frontal gyrus (identified at 4s and 6s after the question onset in Experiment 1 respectively). As expected, the control region (blue bar) shows the lowest median AUC value that is close to zero. The two ROIs at the left middle front gyrus exhibit high AUC values for all subjects. In the cross-intention decoding scenario (B), the union of all ROIs (pink bar) still shows the highest median AUC. The left middle frontal gyrus (4s) shows comparable median AUC to the union of all ROIs. The individual AUC values are consistently high in this ROI.
Figure 6 shows the mean and 95% confidence intervals of decoding accuracy as a function of Navg for all ROIs in all subjects. Rows in the matrix correspond to subjects and columns represent all ROIs in the analysis. The ROIs were ordered according to the AUC rank in Fig. 5A. The right most column (blue lines) show results for left primary visual cortex, a region not identified as informative for time bins 2s–6s in Experiment 1. Grey areas show 95% confidence intervals of decoding accuracy in a permutation analysis where labels were randomized during classifier training. The precise accuracies, with significance levels, for Navg=1 and Navg=18 are reported in Supplementary Table 1.
Figure 6.

Single-subject decoding accuracy results for the mixed-intention scenario as a function of number of averaged trials (Navg). Each row corresponds to a different subject. Each column corresponds to a different ROI. The ROIs are ordered according to the median AUC rank presented in Figure 5A. Red lines represent accuracy results for regions identified as informative in Experiment 1. Purple lines are used to indicate the performance of the union of all ROIs. Gray lines represent results from a permutation control analysis where labels were randomized during classifier training. Blue lines represent results for an additional control region located in the left visual cortex. Each line shows average values in bold and 95% confidence intervals across 50 repetitions of random trial averaging as shaded regions. The ROIs at the left middle frontal gyrus show consist trend across all subjects.
Considerable cross-subject variability in decoding accuracy was observed in most ROIs. While most subjects showed decoding accuracy increasing with Navg for all (subject 1) or most regions (subjects 3–6), subject 2 showed increases only for a limited set of regions. The top-ranked ROIs in the AUC index (Fig. 5A), r-STG, l-SMG, l-MFG (4s), and l-MFG (6s), showed significant increases in decoding accuracy with increasing Navg. These tendencies were highly consistent across subjects. The median accuracy values for these ROIs were 82.5%, 77.5%, 78.5%, and 79.5%, respectively when Navg=18. In particular, the two l-MFG ROIs exhibited increasing accuracy as a function of Navg for all subjects. The single-trial (Navg=1) decoding accuracies for the l-MFG ranged 56% to 65% (Supplementary Table 1), and were significantly above chance for all subjects (p<0.01, determined using a null-distribution generated by pooling results from the permutation tests). When Navg = 18, the decoding accuracy for the l-MFG reached at least 76% in all subjects (significantly above chance, p<10−5), and raised above 90% for two subjects (see Supplementary Table 1). In contrast, the permutation analyses produced decoding accuracies around chance (50%) in all regions for all subjects and Navg levels. Meanwhile, no increasing trend in decoding accuracy was observed in the left visual cortex control region. When combining all nine ROIs (the union ROI), the decoding accuracy with Navg = 18 ranged from 71%–92% across subjects, except subject 2 (60%). These high accuracies obtained with Navg=18 indicate that, for these data, increasing the signal-to-ratio for individual trials has a greater impact on decoding performance than increasing the total number of training trials. A few regions in subject 2 exhibited decreasing performance far below chance level as Navg increased. This phenomenon has previously been observed in linear classifications systems and defined as “anti-learning phenomenon“ (Kowalczyk and Chapelle, 2005).
Experiment 2: Cross-Intention Decoding Accuracy at the Single-Subject Level
Similar to the mixed-intention analysis, we computed AUC for all ROIs and all subjects for the cross-intention condition. Results for this analysis are shown in Fig. 5B. For consistency, the ROIs are sorted according to the mixed-intentions AUC (Fig. 5.A). For this cross-intention scenario, the union of all ROIs still showed the highest median AUC value. Echoing the mix-intention analyses, the r-STG, l-SMG, and l-MFG showed relatively high median AUC values. Particularly, one l-MFG ROI (the one identified at 4s after question onset in Experiment 1) exhibited comparable median AUC to the union of all ROIs. Regarding the inter-subject consistency, the two l-MFG ROIs again showed high consistency across all subjects. The r-STG and the l-SMG showed larger inter-subject variability in decoding accuracy than the l-MFG ROIs.
Figure 7 presents the decoding accuracy curves as a function of Navg from the cross-intention decoding attempts. The figure is organized in a manner similar to Fig. 6. Both control conditions (permutation analysis and the visual cortex control region) produced chance-level decoding accuracies that remained steady with different levels of trial averaging. Similar to the mixed-intention scenario, the cross-intention decoding accuracies exhibited considerable inter-subject variability. Due to the potentially larger variability in trials used in training (“Honest” trials) and test (“Dishonest” trials), as well as a smaller number of samples in classifier training, the cross-intention decoding accuracies were lower than those in the mixed-intention scenario. The mean decoding accuracies at Navg = 1 and Navg = 18 for all ROIs and their union are presented in Supplementary Table 2. The single-trial decoding accuracy failed to achieve a significance level of p<0.01 for most ROIs in most subjects.
Figure 7.

Single-subject decoding accuracy results for the cross-intention scenario as a function of number of averaged trials (Navg). Each row corresponds to a different subject. Each column shows results for a different ROI. The ROIs are ordered according to the median AUC rank presented in Figure 5A. Red lines represent accuracy results for regions identified as informative in Experiment 1. Purple lines are used to indicate the performance of the union of all ROIs. Gray lines represent results from a permutation control analysis where labels were randomized during classifier training. Blue lines represent results for an additional control region located in the left visual cortex. Each line shows average values in bold and 95% confidence intervals across 50 repetitions of random trial-averaging as shaded regions. The ROIs at the left middle frontal gyrus show consist trend across all subjects.
However, the top-ranked ROIs still showed decoding accuracy that increased with Navg. The median accuracy values for the r-STG, l-SMG, l-MFG (4s), and l-MFG (6s) ROIs were 66%, 75%, 72%, and 78%, respectively when Navg=18. In particular, the two l-MFG ROIs exhibited consistency across all subjects, and achieved decoding accuracy of 68%–91% for all subjects when Navg = 18. These results suggest that the representations of the true “Yes/No” thoughts in the spatial activity patterns of the l-MFG are relatively robust across intention to respond truthfully or deceivingly (according to the intentional cue). The union of all ROIs gave accuracies greater than 74% in four of the six subjects (see Supplementary Table 2).
Figure 8 presents a summary of median decoding accuracy (when Navg = 18), which separates classification accuracies from the two predictions in the cross-intention decoding. In one true yes/no prediction, the classifier was trained only using the “Honest” trials and tested using the “Dishonest” trials; in the other prediction the roles of the “Honest” trials and “Dishonest” trials were switched. The grey band on Fig. 8 represents the 99.99% confidence interval derived from the permutation tests. The accuracies for individual subjects are presented in Supplementary Table 3. Figure 8 indicates that the inter-subject median accuracy values for all ROIs were very similar whether the classifier was trained on the “Honest” or “Dishonest” trials. This similarity was also observed in all ROIs and all subjects (Supplementary Table 3). These observations indicate that the accuracies obtained in the cross-intention decoding when averaging across conditions in Figure 7 were due to a high classification accuracy in only one trial type. Thus, for the ROIs showing consistently high accuracies in the cross-intention decoding, the results presented here provide additional evidence that the intentions do not influence the spatial patterns representing true thoughts in these ROIs. This summary also shows that the median classification accuracies in both cross-intentional predictions in the r-STG, l-SMG, and l-MFG ROIs were significantly above chance level at Navg = 18.
Figure 8.

Inter-subject median of decoding accuracy from the two predictions in the cross-intention analysis. “H” indicates the inter-subject median of accuracies (when Navg = 18) obtained when the classifiers were trained only with “Honest” trials to predict the true thoughts in “Dishonest” trials. “D” indicates the median accuracy (when Navg = 18) obtained when the classifiers were trained only with the “Dishonest” trials to predict the true thoughts in the “Honest” trials. For all ROIs, the median values in “H” and “D” predictions high agree, indicating that the cross-intention accuracies shown in Figure 7 are not biased by a single prediction scheme (“H” or “D”).
Discussion
This work aims to examine the possibility of decoding true “Yes/No” thoughts elicited in response to binary common-knowledge questions using fMRI and MVPA at the single-subject level. It also evaluates the impact of honest/dishonest intentions in making explicit responses on the decoding of the true thoughts. A searchlight analysis (Experiment 1) first revealed several distributed cortical regions whose hemodynamic patterns produced decoding accuracy significantly above chance at the group level, and revealed that these spatial patterns were most informative at 2s–6s after the beginning of the trials. Nonetheless, the exploratory nature of Experiment 1 does not allow drawing solid conclusions about which brain regions carry accurate information to decode true thoughts. With the a priori information found in Experiment 1, Experiment 2 further examined these cortical regions on an independent dataset acquired on a 7T scanner. This second experiment not only aimed to verify the findings from Experiment 1, but also evaluated the influence of the honest/dishonest intentions on the decoding of the true thoughts. Finally in this second experiment we also evaluated if trial averaging could help enhance decoding accuracy towards the goal of 100% at the single-subject level.
Our results revealed that a few regions, namely r-STG, l-SMG, and l-MFG, were able to produce significant above-chance decoding accuracies for the true “Yes/No” thoughts (median accuracy around 80% when Navg=18). More importantly, our results also reveal that accuracy can be greatly enhanced with trial averaging (Fig. 5A and Fig. 6). This indicates that the spatial activity patterns in these ROIs contain robust response differences between the true “Yes” and “No” thoughts.
When classification accuracy was computed using a cross-intention approach (training conducted with “Honest” and testing with “Dishonest” trials, and vice-versa), the r-STG, l-SMG, and l-MFG ROIs still exhibited accuracy that improved with trial averaging, achieving median values around 75% (Navg=18). These observations further suggest that the encodings of true thoughts in these regions have some degree of independence from the subjects’ intentions to respond truthfully or deceivably, and that decoding performance can be enhanced with trial averaging. Further analyses are necessary to fully evaluate the actual level of independence regarding intentions, and how this independence may vary across subjects or type of questions. In the following sections, we focus the discussion on the r-STG, l-SMG, and l-MFG regions that showed high decoding power in both mixed-intention and cross-intention analyses (see Fig. 5 and Fig. 8).
Encoding of “Yes/No” thoughts in the l-MFG
The left dorsolateral prefrontal cortex (l-DLPFC), which encompasses the l-MFG region found in the present study, is known to be actively involved in perceptual decision-making about both simple (Kim and Shadlen, 1999) and complex objects (Heekeren et al., 2004). Perceptual decision-making models suggest that the l-DLPFC serves to generate decisions by comparing the inputs from different selectively-tuned, lower-level perceptual regions. Recent studies have demonstrated that this integrative role goes beyond simple perceptual decisions, and that the l-DLPFC is also involved in more cognitively demanding decisions—such as house/face discriminations (Heekeren et al., 2004) or delayed face recognition (Druzgal and D’Esposito, 2001)—and that its integrative role is independent of response and stimulus modality (Heekeren et al., 2006; Pleger et al., 2006). In the present work, we show that BOLD response patterns within the l-DLPFC can be used to detect true “Yes/No” thoughts. This suggests that the integrative capabilities of the l-DLPFC are more general than previously discussed, and that this region also plays an important role in integrating input, such as merging visually posed question with prior experiences and knowledge that the subjects possess.
Furthermore, our current observation that encoding of “Yes/No” thoughts in the l-MFG is somehow independent of intentional cues extends the findings from prior deception studies. The prefrontal cortex has been suggested to play a key role in deception, as reflected by its widespread activity during deceptive behavior (Christ et al., 2009). Researchers suggested that the prefrontal cortex may play a key role in suppressing true thoughts and permitting deception (Abe, 2009; Abe et al., 2008). Our current results provide understanding at a finer-scale; a portion of the l-DLPFC is not fully affected by intentional suppression, and that it encodes the initial “truthful” thoughts even when subjects are instructed to overtly deceive. Thus, this observation implies that different regions in the DLPFC may play different roles in deception, inviting investigation of DLPFC function at a finer scale. The psychological theory of deception proposed by Spence et al. (2004) defined deception as the process of constructing a lie while also withholding the truth. Our observations provide brain imaging evidence in support of this theory in that the true thoughts can be robustly decoded from brain activity under both honest and dishonest intentions when providing explicit answers. Thus, the existing true thought proposed in the theory is represented in the brain activity, parallel to the mental processes producing lies.
Encoding of “Yes/No” thoughts in the l-MFG
The l-SMG showed increasing decoding accuracy with trial averaging in five of the six subjects in Experiment 2 (Fig. 5 and Fig. 6). The accuracy for the other subject was influenced by “anti-learning phenomenon,” and, in theory, is correctable (see Supplementary Discussion). The l-SMG is known to play an important role in language processing (Jobard et al., 2003; Price, 2010; Simon et al., 2002), particularly in verbal working memory (Henson et al., 2000; Paulesu et al., 1993). It coordinates with Broca’s area to conform to an articulatory loop that allows us to keep words ‘in our heads’ (Paulesu et al., 1993). Consistent decoding accuracy of the l-SMG in the mixed-intention condition suggests that some components of the verbal working memory, as represented in the l-SMG, may be involved in maintaining responses in mind during the delay periods. The fact that decoding accuracy for the l-SMG was significantly greater than chance and increased with trial averaging in the cross-intention scenario presents a more striking result; it suggests that the true thoughts—which are necessary to construct a deceptive answer according to Spence et al. deception theory (Spence et al., 2004)—are also encoded in this parietal region. This further suggests that one still keeps in mind the true thoughts throughout the entire mental process for telling a lie. However, our results did not show that all key regions involved in working memory contained information about true thoughts. Further investigation is needed to better understand the role of different working memory regions on the maintenance of the true thoughts.
Encoding of “Yes/No” thoughts in the r-STG
The r-STG showed similar performance to the l-SMG. This region showed increasing decoding accuracy with trial averaging in five of the six subjects in the mixed-intention decoding scenario and exhibited larger inter-subject variability in the cross-intention decoding scenario. Previous studies have found that faces familiar to the subjects can evoke activation in this region (Gobbini and Haxby 2006, 2007). More recently, a comprehensive study combining fMRI and electrical physiology techniques investigated the spatial and temporal neural processing of deception on face familiarity (Sun et al., 2013). The authors suggested that r-STG is involved in early retrieval of truth, and that this early retrieval of truth is necessary in the deception process. Our observation that the true thought can be decoded in the activity of r-STG supports and provides further evidence for this theory. Nonetheless, further investigation is needed to clarify whether the r-STG is involved in visual processing of the “Yes/No” symbols in the task or the processing of higher-level information in our paradigm.
Decoding accuracy in other regions
Five additional regions showed accuracy significantly above chance at the group level in Experiment 1 (Fig. 4A–C). The decoding accuracy and behavior with trial averaging was considerably more variable across subjects. This higher inter-subject variability most likely reflects differences in cognitive strategy across subjects. Nonetheless, as shown in Fig. 5, when using spatial activity patterns within all these ROIs to decode true thoughts, the performance in most subjects was higher than that obtained only using an individual ROI. These findings suggest that these regions may also contribute to the decoding of true thoughts, although their contribution may be dependent on individual strategies.
Potential applications and limitations
The possibility of decoding true “Yes/No” thoughts on an individual subject basis with high accuracy may be attractive for those interested in clinical and legal applications. Clinically, it may provide an efficient way to communicate with locked-in patients and help diagnose different levels of consciousness. Recent research (Meiran et al., 2000; Naci et al., 2013; Owen et al., 2006) has shown that it is possible to use covert mental tasks with well-differentiated fMRI activation patterns, such as motor imaginary, mental spatial navigation, and selective attention, to attempt simple communication (i.e., “Yes/No” questions) with some members of this population. Our current results suggest that it may be possible in principle to bypass this intermediate “translation” step—i.e. motor imagery=“Yes”; spatial navigation=“No”—and ask subjects to simply keep “Yes” or “No” answers in their mind, which may greatly increase the efficiency, robustness, and ease of implementation of this technique. In the legal setting, our results may have some implications for deception detection. Most fMRI deception studies focus on understanding and detecting the act of deception (Johnson et al., 2004; Langleben et al., 2005; Phan et al., 2005; Sip et al., 2008). Here, guided by the detection theory of Spence et al. (Spence et al., 2004), we have focused our efforts on detecting where and when in the brain subjects may encode the true thoughts that are intrinsic and necessary to construct a lie. Our results suggest that a few brain regions may contribute to encoding this concealed truth; and that it might be possible, in principle, to use fMRI to directly decode truthful thoughts.
Given the legal and ethical implications associated with these two applications, caution must be exercised when interpreting the present results. Our findings can only be considered a proof-of-principle, and should not be interpreted as a usable technique for real-world applications. First, although we report decoding accuracies significantly above chance, we do not report perfect decoding accuracy (100%). Consequently our data do not suggest that decoding of truthful thoughts can be yet performed with the levels of robustness, efficiency, and accuracy that applications, such as the ones outlined above, may require. High decoding accuracy was only achieved after averaging several trials. Single-trial decoding failed to achieve satisfactory accuracy even when there were more samples for the classifier. Thus, our study does not show that a single-instance of decoding can produce an accurate estimation of true thoughts at signal-to-noise levels such as those present in our data. Second, our experimental setup presents important constraints that render it significantly different from real-world situations. These differences include motivation, stress levels of the subjects, and the types of questions considered.
Finally, several regions showed promising increases in decoding accuracy with trial averaging, suggesting that improvements in hardware and experimental design could translate, in the near future, into higher accuracies with fewer trials. From our results, it is not possible to infer whether decoding accuracy for data with higher quality will reach levels in the vicinity of 100%, or if saturation at a lower accuracy may occur.
Future Directions
There are still many questions to be answered beyond the current study. First, a general question in brain decoding is whether the information is best represented in individual voxels, fine-grained multi-voxel patterns, or general macroscopic patterns. The answer to this particular question is required to gain further understanding on how true thoughts are encoded in neural activity. Although we failed to detect any significant univariate differences between “Yes” and “No” thoughts in Experiment 1, a rigorous comparison between univariate and multivariate approaches need to be conducted. Furthermore, comparing decoding results with different levels of smoothing on the data can provide insights on how much information about the true thoughts is actually represented within fine-grained local voxel activity patterns. An even more interesting question is whether the neural encoding of the true thoughts is consistent across subjects. Cross-subject decoding may serve as a powerful tool to examine this question.
Conclusions
The present study shows it is possible to decode true “Yes/No” thoughts in response to binary questions in the presence of cues to answer honestly or dishonestly at the single-subject level. The l-MFG, r-STG, and l-SMG showed consistent above-chance decoding accuracy. The decoding accuracy can be enhanced with trial averaging. The decoding of true thoughts in these regions shows independence from the intention to overtly deceive.
Supplementary Material
Research Highlights.
True thoughts precede the overt responses to questions and are decoded from fMRI
The left middle frontal gyrus showed 76%–93% accuracy for true “Yes/No” decoding
The decoding accuracy of this region increases with trial averaging
Brain activity patterns encoding true thoughts are similar in different intentions
Acknowledgments
The authors would like to thank Drs. Xuchu Weng, Gang Chen, John X. Zhang, Yi Jiang, Wen Zhou, Xi-Nian Zuo, Sundeep Teki, Chaogan Yan, and Ms. Laura Buchanan for their help in improving the manuscript. We thank Ms. Lijuan Cheng for helps in collecting the data in Experiment 1. This work was supported by the National Science Foundation of China (NSFC, No. 81270023 to ZY), the National Key Technologies R&D Program of China (No. 2012BAI36B01 to ZY), and the NIMH Intramural research program (ZY, JGC, and PAB).
Footnotes
Publisher's Disclaimer: This is a PDF file of an unedited manuscript that has been accepted for publication. As a service to our customers we are providing this early version of the manuscript. The manuscript will undergo copyediting, typesetting, and review of the resulting proof before it is published in its final citable form. Please note that during the production process errors may be discovered which could affect the content, and all legal disclaimers that apply to the journal pertain.
References
- Abe N. The neurobiology of deception: evidence from neuroimaging and loss-of-function studies. Curr Opin Neurol. 2009;22:594. doi: 10.1097/WCO.0b013e328332c3cf. [DOI] [PubMed] [Google Scholar]
- Abe N, Okuda J, Suzuki M, Sasaki H, Matsuda T, Mori E, Tsukada M, Fujii T. Neural correlates of true memory, false memory, and deception. Cereb Cortex. 2008;18:2811. doi: 10.1093/cercor/bhn037. [DOI] [PMC free article] [PubMed] [Google Scholar]
- Barber AD, Carter CS. Cognitive control involved in overcoming prepotent response tendencies and switching between tasks. Cereb Cortex. 2005;15:899–912. doi: 10.1093/cercor/bhh189. [DOI] [PubMed] [Google Scholar]
- Buxton RB. Dynamic models of BOLD contrast. Neuroimage. 2012;62:953–961. doi: 10.1016/j.neuroimage.2012.01.012. [DOI] [PMC free article] [PubMed] [Google Scholar]
- Christ SE, Van Essen DC, Watson JM, Brubaker LE, McDermott KB. The contributions of prefrontal cortex and executive control to deception: evidence from activation likelihood estimate meta-analyses. Cereb Cortex. 2009;19:1557–1566. doi: 10.1093/cercor/bhn189. [DOI] [PMC free article] [PubMed] [Google Scholar]
- Coutanche MN, Thompson-Schill SL, Schultz RT. Multi-voxel pattern analysis of fMRI data predicts clinical symptom severity. Neuroimage. 2011;57:113–123. doi: 10.1016/j.neuroimage.2011.04.016. [DOI] [PMC free article] [PubMed] [Google Scholar]
- Cox RW. AFNI: software for analysis and visualization of functional magnetic resonance neuroimages. Comput Biomed Res. 1996;29:162–173. doi: 10.1006/cbmr.1996.0014. [DOI] [PubMed] [Google Scholar]
- Çukur T, Nishimoto S, Huth AG, Gallant JL. Attention during natural vision warps semantic representation across the human brain. Nat Neurosci. 2013;16:763–770. doi: 10.1038/nn.3381. [DOI] [PMC free article] [PubMed] [Google Scholar]
- Druzgal TJ, D’Esposito M. A neural network reflecting decisions about human faces. Neuron. 2001;32:947–955. doi: 10.1016/s0896-6273(01)00519-0. [DOI] [PubMed] [Google Scholar]
- Eickhoff SB, Stephan KE, Mohlberg H, Grefkes C, Fink GR, Amunts K, Zilles K. A new SPM toolbox for combining probabilistic cytoarchitectonic maps and functional imaging data. Neuroimage. 2005;25:1325–1335. doi: 10.1016/j.neuroimage.2004.12.034. [DOI] [PubMed] [Google Scholar]
- Etzel JA, Zacks JM, Braver TS. Searchlight analysis: promise, pitfalls, and potential. Neuroimage. 2013;78:261–269. doi: 10.1016/j.neuroimage.2013.03.041. [DOI] [PMC free article] [PubMed] [Google Scholar]
- Fox CJ, Iaria G, Barton JJS. Defining the face processing network: optimization of the functional localizer in fMRI. Hum Brain Mapp. 2009;30:1637–1651. doi: 10.1002/hbm.20630. [DOI] [PMC free article] [PubMed] [Google Scholar]
- Fox PT. The coupling controversy. Neuroimage. 2012;62:594–601. doi: 10.1016/j.neuroimage.2012.01.103. [DOI] [PMC free article] [PubMed] [Google Scholar]
- Gonzalez-Castillo J, Saad ZS, Handwerker DA, Inati SJ, Brenowitz N, Bandettini PA. Whole-brain, time-locked activation with simple tasks revealed using massive averaging and model-free analysis. Proc Natl Acad Sci U S A. 2012;109:5487–5492. doi: 10.1073/pnas.1121049109. [DOI] [PMC free article] [PubMed] [Google Scholar]
- Gonzalez-Castillo J, Duthie KN, Saad ZS, Chu C, Bandettini PA, Luh WM. Effects of image contrast on functional MRI image registration. Neuroimage. 2013;67:163–174. doi: 10.1016/j.neuroimage.2012.10.076. [DOI] [PMC free article] [PubMed] [Google Scholar]
- Hampton AN, O’Doherty JP. Decoding the neural substrates of reward-related decision making with functional MRI. Proc Natl Acad Sci U S A. 2007;104:1377–1382. doi: 10.1073/pnas.0606297104. [DOI] [PMC free article] [PubMed] [Google Scholar]
- Haxby JV, Gobbini MI, Furey ML, Ishai A, Schouten JL, Pietrini P. Distributed and overlapping representations of faces and objects in ventral temporal cortex. Science. 2001;293:2425. doi: 10.1126/science.1063736. [DOI] [PubMed] [Google Scholar]
- Haynes JD, Rees G. Decoding mental states from brain activity in humans. Nat Rev Neurosci. 2006;7:523–534. doi: 10.1038/nrn1931. [DOI] [PubMed] [Google Scholar]
- Haynes JD, Sakai K, Rees G, Gilbert S, Frith C, Passingham RE. Reading hidden intentions in the human brain. Curr Biol. 2007;17:323–328. doi: 10.1016/j.cub.2006.11.072. [DOI] [PubMed] [Google Scholar]
- Heeger DJ, Ress D. What does fMRI tell us about neuronal activity? Nat Rev Neurosci. 2002;3:142–151. doi: 10.1038/nrn730. [DOI] [PubMed] [Google Scholar]
- Heekeren HR, Marrett S, Bandettini PA, Ungerleider LG. A general mechanism for perceptual decision-making in the human brain. Nature. 2004;431:859–862. doi: 10.1038/nature02966. [DOI] [PubMed] [Google Scholar]
- Heekeren HR, Marrett S, Ruff DA, Bandettini PA, Ungerleider LG. Involvement of human left dorsolateral prefrontal cortex in perceptual decision making is independent of response modality. Proc Natl Acad Sci U S A. 2006;103:10023–10028. doi: 10.1073/pnas.0603949103. [DOI] [PMC free article] [PubMed] [Google Scholar]
- Henson RN, Burgess N, Frith CD. Recoding, storage, rehearsal and grouping in verbal short-term memory: an fMRI study. Neuropsychologia. 2000;38:426–440. doi: 10.1016/s0028-3932(99)00098-6. [DOI] [PubMed] [Google Scholar]
- Gobbini MI, Haxby JV. Neural response to the visual familiarity of faces. Brain Res Bull. 2006;71:76–82. doi: 10.1016/j.brainresbull.2006.08.003. [DOI] [PubMed] [Google Scholar]
- Gobbini MI, Haxby JV. Neural systems for recognition of familiar faces. Neuropsychologia. 2007;45:32–41. doi: 10.1016/j.neuropsychologia.2006.04.015. [DOI] [PubMed] [Google Scholar]
- Jobard G, Crivello F, Tzourio-Mazoyer N. Evaluation of the dual route theory of reading: a metanalysis of 35 neuroimaging studies. Neuroimage. 2003;20:693–712. doi: 10.1016/S1053-8119(03)00343-4. [DOI] [PubMed] [Google Scholar]
- Johnson R, Jr, Barnhardt J, Zhu J. The contribution of executive processes to deceptive responding. Neuropsychologia. 2004;42:878–901. doi: 10.1016/j.neuropsychologia.2003.12.005. [DOI] [PubMed] [Google Scholar]
- Kim JN, Shadlen MN. Neural correlates of a decision in the dorsolateral prefrontal cortex of the macaque. Nat Neurosci. 1999;2:176–185. doi: 10.1038/5739. [DOI] [PubMed] [Google Scholar]
- Kowalczyk A, Chapelle O. An Analysis of the Anti-learning Phenomenon for the Class Symmetric Polyhedron. In: Jain S, Simon H, Tomita E, editors. Algorithmic Learning Theory. Springer; Berlin Heidelberg: 2005. pp. 78–91. [Google Scholar]
- Kriegeskorte N, Goebel R, Bandettini P. Information-based functional brain mapping. Proc Natl Acad Sci U S A. 2006;103:3863–3868. doi: 10.1073/pnas.0600244103. [DOI] [PMC free article] [PubMed] [Google Scholar]
- Langleben DD, Loughead JW, Bilker WB, Ruparel K, Childress AR, Busch SI, Gur RC. Telling truth from lie in individual subjects with fast event-related fMRI. Hum Brain Mapp. 2005;26:262–272. doi: 10.1002/hbm.20191. [DOI] [PMC free article] [PubMed] [Google Scholar]
- Langleben DD, Schroeder L, Maldjian JA, Gur RC, McDonald S, Ragland JD, O’Brien CP, Childress AR. Brain activity during simulated deception: an event-related functional magnetic resonance study. NeuroImage. 2002;15:727–732. doi: 10.1006/nimg.2001.1003. [DOI] [PubMed] [Google Scholar]
- Logothetis NK, Pauls J, Augath M, Trinath T, Oeltermann A. Neurophysiological investigation of the basis of the fMRI signal. Nature. 2001;412:150–157. doi: 10.1038/35084005. [DOI] [PubMed] [Google Scholar]
- Meiran N, Chorev Z, Sapir A. Component processes in task switching. Cogn Psychol. 2000;41:211–253. doi: 10.1006/cogp.2000.0736. [DOI] [PubMed] [Google Scholar]
- Meyer K, Kaplan JT, Essex R, Webber C, Damasio H, Damasio A. Predicting visual stimuli on the basis of activity in auditory cortices. Nat Neurosci. 2010;13:667–668. doi: 10.1038/nn.2533. [DOI] [PubMed] [Google Scholar]
- Mitchell T, Hutchinson R, Niculescu R, Pereira F, Wang X, Just M, Newman S. Learning to decode cognitive states from brain images. Mach Learn. 2004;13:667–668. [Google Scholar]
- Misaki M, Kim Y, Bandettini PA, Kriegeskorte N. Comparison of multivariate classifiers and response normalizations for pattern-information fMRI. NeuroImage. 2010;53:103–118. doi: 10.1016/j.neuroimage.2010.05.051. [DOI] [PMC free article] [PubMed] [Google Scholar]
- Monti MM, Vanhaudenhuyse A, Coleman MR, Boly M, Pickard JD, Tshibanda L, Owen AM, Laureys S. Willful modulation of brain activity in disorders of consciousness. N Engl J Med. 2010;362:579–589. doi: 10.1056/NEJMoa0905370. [DOI] [PubMed] [Google Scholar]
- Naci L, Cusack R, Jia VZ, Owen AM. The Brain’s Silent Messenger: Using Selective Attention to Decode Human Thought for Brain-Based Communication. J Neurosci. 2013;33:9385–9393. doi: 10.1523/JNEUROSCI.5577-12.2013. [DOI] [PMC free article] [PubMed] [Google Scholar]
- Norman KA, Polyn SM, Detre GJ, Haxby JV. Beyond mind-reading: multi-voxel pattern analysis of fMRI data. Trends Cogn Sci. 2006;10:424–430. doi: 10.1016/j.tics.2006.07.005. [DOI] [PubMed] [Google Scholar]
- Owen AM, Coleman MR, Boly M, Davis MH, Laureys S, Pickard JD. Detecting awareness in the vegetative state. Science. 2006;313:1402. doi: 10.1126/science.1130197. [DOI] [PubMed] [Google Scholar]
- Paulesu E, Frith CD, Frackowiak RS. The neural correlates of the verbal component of working memory. Nature. 1993;362:342–345. doi: 10.1038/362342a0. [DOI] [PubMed] [Google Scholar]
- Phan KL, Magalhaes A, Ziemlewicz TJ, Fitzgerald DA, Green C, Smith W. Neural correlates of telling lies: a functional magnetic resonance imaging study at 4 Tesla. Academic Radiol. 2005;12:164–172. doi: 10.1016/j.acra.2004.11.023. [DOI] [PubMed] [Google Scholar]
- Pleger B, Ruff CC, Blankenburg F, Bestmann S, Wiech K, Stephan KE, Capilla A, Friston KJ, Dolan RJ. Neural coding of tactile decisions in the human prefrontal cortex. J Neurosci. 2006;26:12596–12601. doi: 10.1523/JNEUROSCI.4275-06.2006. [DOI] [PMC free article] [PubMed] [Google Scholar]
- Price CJ. The anatomy of language: a review of 100 fMRI studies published in 2009. Ann N Y Acad Sci. 2010;1191:62–88. doi: 10.1111/j.1749-6632.2010.05444.x. [DOI] [PubMed] [Google Scholar]
- Rissman J, Greely HT, Wagner AD. Detecting individual memories through the neural decoding of memory states and past experience. Proc Natl Acad Sci U S A. 2010;107:9849–9854. doi: 10.1073/pnas.1001028107. [DOI] [PMC free article] [PubMed] [Google Scholar]
- Simon O, Mangin JF, Cohen L, Le Bihan D, Dehaene S. Topographical layout of hand, eye, calculation, and language-related areas in the human parietal lobe. Neuron. 2002;33:475–487. doi: 10.1016/s0896-6273(02)00575-5. [DOI] [PubMed] [Google Scholar]
- Sip K, Lynge M, Wallentin M, McGregor W, Frith C, Roepstorff A. The production and detection of deception in an interactive game. Neuropsychologia. 2010;48:3619–3626. doi: 10.1016/j.neuropsychologia.2010.08.013. [DOI] [PubMed] [Google Scholar]
- Sip K, Roepstorff A, McGregor W, Frith C. Detecting deception: the scope and limits. Trends Cogn Sci. 2008;12:48–53. doi: 10.1016/j.tics.2007.11.008. [DOI] [PubMed] [Google Scholar]
- Soon CS, Brass M, Heinze HJ, Haynes JD. Unconscious determinants of free decisions in the human brain. Nat Neurosci. 2008;11:543–545. doi: 10.1038/nn.2112. [DOI] [PubMed] [Google Scholar]
- Soon CS, He AH, Bode S, Haynes JD. Predicting free choices for abstract intentions. Proc Natl Acad Sci U S A. 2013;110:6217–6222. doi: 10.1073/pnas.1212218110. [DOI] [PMC free article] [PubMed] [Google Scholar]
- Spence SA, Farrow TF, Herford AE, Wilkinson ID, Zheng Y, Woodruff PW. Behavioural and functional anatomical correlates of deception in humans. Neuroreport. 2001;12:2849–2853. doi: 10.1097/00001756-200109170-00019. [DOI] [PubMed] [Google Scholar]
- Spence SA, Hunter MD, Farrow TF, Green RD, Leung DH, Hughes CJ, Ganesan V. A cognitive neurobiological account of deception: evidence from functional neuroimaging. Philos Trans R Soc Lond, Ser B: Biol Sci. 2004;359:1755–1762. doi: 10.1098/rstb.2004.1555. [DOI] [PMC free article] [PubMed] [Google Scholar]
- Sun D, Lee TM, Chan CC. Unfolding the spatial and temporal neural processing of lying about face familiarity. Cereb Cortex. 2013 doi: 10.1093/cercor/bht284. Epub ahead of print. [DOI] [PMC free article] [PubMed] [Google Scholar]
- Talairach J, Tournoux P. In: Co–planar stereotaxic atlas of the human brain. Thieme G, editor. Thieme Medical Publishers; Stuttgart; New York: 1988. [Google Scholar]
- Xiong J, Gao JH, Lancaster JL, Fox PT. Clustered pixels analysis for functional MRI activation studies of the human brain. Hum Brain Mapp. 1995;3:287–301. [Google Scholar]
- Xu G, Jiang Y, Ma L, Yang Z, Weng X. Similar spatial patterns of neural coding of category selectivity in FFA and VWFA under different attention conditions. Neuropsychologia. 2012;50:862–868. doi: 10.1016/j.neuropsychologia.2012.01.026. [DOI] [PubMed] [Google Scholar]
- Yang Z, Fang F, Weng X. Recent developments in multivariate pattern analysis for functional MRI. Neuroscience Bulletin. 2012;28:399–408. doi: 10.1007/s12264-012-1253-3. [DOI] [PMC free article] [PubMed] [Google Scholar]
- Yacoub E, Shmuel A, Pfeuffer J, Van De Moortele PF, Adriany G, Ugurbil K, Hu XP. Investigation of the initial dip in fMRI at 7 Tesla. NMR Biomed. 2001;14:408–412. doi: 10.1002/nbm.715. [DOI] [PubMed] [Google Scholar]
Associated Data
This section collects any data citations, data availability statements, or supplementary materials included in this article.