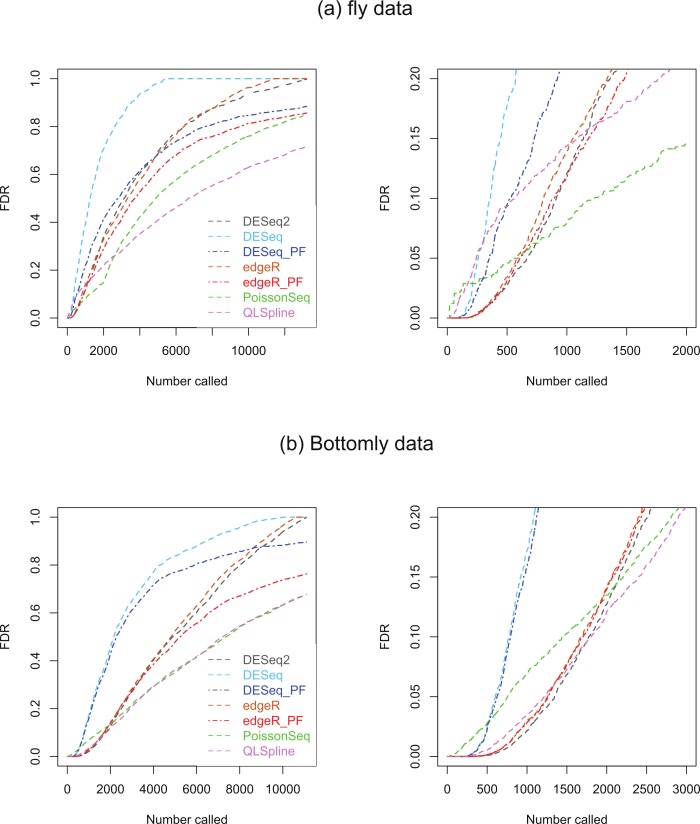
Figure 8. Estimated FDRs for (A) the fly data consisting of n = 2 vs. 2 biological replicates of fly-embryo RNA and a total of 13,258 genes, and (B) the Bottomly data consisting of n = 10 vs. 11 biological replicates of mouse RNA and a total of 11,123 genes.
The right hand plots are expanded views of the first few thousand called genes.

