

Abstract
Polycystic ovary syndrome is the major cause of infertility in reproductive aged women. Polycystic ovary syndrome is associated with high circulating levels of androgens and impaired metabolic function. The goal of this study was to understand how androgen signaling via the androgen receptor (AR) affects reproductive function. We knocked out the AR gene specifically in pituitary gonadotropes (PitARKO) to explore the role of androgen on the development of reproductive function in female mice. There was no difference in the age of puberty between control and PitARKO littermates, which was assessed by the ages of vaginal opening and first estrus. Cyclicity and fertility were also studied, and there was no significant difference between control and PitARKO mice. We observed a significant decrease in basal FSH serum and mRNA levels with no corresponding change in LH serum and mRNA levels. Although the numbers of litters born to control and PitARKO females were the same, the litter size was significantly smaller for PitARKO mice. The LH and FSH responses to ovariectomy was altered with reduced LH/FSH hormone and mRNA levels in PitARKO females. This reduction may be due to reduced expression of activin A/B and gnrhr. The preovulatory surge levels of LH and FSH were dramatically lower in PitARKO mice. The number of corpora lutea was decreased whereas the number of antral follicles was similar between control and PitARKO mice. Overall the pituitary AR contributes to the elaboration of the LH surge and normal reproductive function by regulating LH/FSH expression and secretion.
LH and FSH are synthesized and released by the pituitary gland and play essential roles in folliculogenesis, ovulation, and steroidogenesis. LH and FSH are tightly controlled by a complex of interactions between hypothalamic GnRH, autocrine/paracrine factors such as activin, inhibin, follistatin, bone morphogenetic proteins, and pituitary adenylate cyclase-activating polypeptide (PACAP) (1–5), as well as feedback signals by estradiol (E2) and androgens. Androgen receptor (AR), which is widely expressed in many tissues including the liver, pancreas, and the reproductive hypothalamus-pituitary-gonadal axis (6), is a member of the nuclear receptor superfamily that is encoded by the AR gene located on the X chromosome (7) and mediates the action of testosterone and dihydrotestosterone (8). Androgens and AR have well-defined roles in male reproduction (9), and global knockouts of the AR gene have revealed roles in female reproduction, producing mice with prolonged estrous cycles and fewer corpora lutea (CL) as well as premature ovarian failure and subfertility (10–12). A conditional knockout of the AR gene in mouse granulosa cells has also been developed (13), and these animals exhibited reproductive phenotypes that phenocopy the global androgen receptor knockout (ARKO) female mice. However, an extraovarian defect in gonadotropin regulation was also observed upon ovarian cross-transplantation between control and global ARKO mice (14), further emphasizing the potential role of pituitary or hypothalamic AR in female reproduction (6).
Androgens and AR modulate gonadotropin gene expression. Androgens/AR stimulate FSHβ promoter activity and augment FSHβ mRNA levels in both primary pituitary cell cultures and GnRH-deficient rats (3, 15–19). In contrast, androgens/AR have been shown to suppress LHβ expression via interactions with other transcription factors such as steroidogenic factor-1 (SF-1/Nr5A1) and specificity protein-1 (Sp-1) (20, 21). Elevated androgen levels are seen in animal models and reproductive aged women with infertility, implying that enhanced AR signaling contributes to abnormal follicle development, menstruation, and resultant fertility. However, the loci of action of testosterone in hyperandrogenic females are not fully known. The development of mice with a pituitary gonadotroph-specific knockout (PitARKO) provides an excellent tool to study the role of androgens in the female reproductive system. We report here that pituitary AR plays an important role in female fertility by regulating LH and FSH expression and secretion.
Materials and Methods
Generation of PitARKO mice
To generate PitARKO mice, we crossed AR heterozygous (fl/wt) female mice (22) with aGSU transgenic (αCre+/−) male mice (23) to generate F1: female mouse (ARfl/wt;αCre+/−) and male mouse (ARfl/Y;αCre−/−). F1 female and male mice were crossed to produce PitARKO female mouse (ARfl/fl;αCre+/−). Other female mice (ARfl/wt;αCre−/− and ARfl/fl;αCre−/−) were referred to as controls. All procedures were approved by the Johns Hopkins Animal Care and Use Committee.
Genotyping and DNA extraction
Primers for genotyping the floxed AR were described previously (22). Primers for aGSU (αCre+/−) were the following: mcGA-CRE-F, GCCACCACCGCCCTGCTTAAGTAA; and 3′-RT-PCR MIP-WIP-R, CATCTTCAGGTTCTGCGGGAAACC. DNA was extracted as described previously (24).
Puberty, cyclicity, and fertility assessments
Female mice were checked for vaginal opening beginning at 20 days of age and the first estrus was recorded after vaginal smear and estrous cyclicity were analyzed as described previously (24). Female mice at 2 months old were mated with proven wild-type (WT) male mice (ARwt/Y;αCre−/−) for 3 months, and litters and pups per litter were recorded and evaluated.
Hormone assays
Serum samples were collected by mandibular bleeding between 9 and 10 am on diestrus except for those specially addressed. Blood was also collected in the morning from mice 7 days after ovariectomy (OVX) and another 7 days after E2 (0.025 mg/pellet for 21 days; Innovative Research of America) replacement. Proestrus serum was collected at 3 pm and 8 pm just 1 hour before lights off. Blood was centrifuged for 15 minutes at 5000 relative centrifugal force. LH/FSH hormone levels were measured on a Luminex 200IS platform using a MILLIPLEX MAP Mouse Pituitary Magnetic Bead Panel (Millipore). The intraassay coefficients of variation (CV) for LH and FSH are 3.1% and 8.7%; The interassay CVs for LH and FSH are 7% to 8% and 9% to 11%. The detection limitations for LH and FSH are 12.2 and 61 pg/mL. Serum E2 levels were measured with a mouse/rat E2 kit from Calbiotech. The sensitivity of the assay is <3 pg/mL. Testosterone levels were measured by radioimmunoassay by the University of Virginia Ligand Assay Core (Charlottesville, Virginia). The intraassay CV for testosterone is 0.7% to 2.6%; the sensitivity of the assay is <5.5 ng/dL.
GnRH stimulation
GnRH analog (catalog no. L4513–1MG; Sigma-Aldrich) was diluted with PBS as a stock solution of 583.7 ng/μL and aliquoted to individual tubes for storage at −20°C. Just before injection, we further diluted the solution with PBS to a final working concentration (0.01, 0.04, or 0.2 ng/μL). GnRH was injected subcutaneously at the nape of the neck at a dose of 100, 400, or 2000 ng/kg body weight (BW) per mouse. Blood was collected at 20 minutes after injection and assayed as above.
Quantitative Real-Time PCR
RNA was extracted from the pituitary, hypothalamus, liver, and ovary and reverse transcribed to cDNA (25). mRNA levels of genes (AR, LHβ, FSHβ, gnrhr, and GAPDH) were measured by TaqMan quantitative PCR (Bioresearch Technologies). mRNA levels of genes (activin A, activin B, inhibin A, pacap1, Nr5a1, Nr5a2, StAR, Cyp17A1, Cyp19, and TSHβ) were measured by iQ SYBR Green Supermix (Bio-Rad). Primers and probes are listed in Supplemental Table 1.
Western blot
Pituitary, liver, and ovary were collected and immediately frozen in liquid N2. Measurements of protein concentrations and Western blot analysis of protein expression were performed as described previously (26). AR antibody (N-20) was purchased from Santa Cruz Biotechnology.
Histology and immunostaining
Ovary was dissected from diestrus mice and fixed in 10% formalin phosphate buffer and sectioned to 5-μm thickness in its entirety by the Johns Hopkins Medical Laboratories Histology Group (Baltimore, Maryland). Ovary was processed and analyzed as described previously (25). The genotypes of the mice from which the samples came were not known by the operator during the examination. Pituitary was fixed in 4% paraformaldehyde for 2 hours on ice and immersed into 30% sucrose overnight. Pituitary was then frozen in OCT at −20°C and sectioned to 6 μm. Sections of pituitary were incubated with goat anti-rabbit AR antibody (N-20) at 1:100 dilution for 30 hours and washed with PBS and incubated with antibody goat anti-guinea pig LH at a dilution of 1:1000 (from Dr Parlow, National Hormone & Peptide Program, Torrance, California) overnight at 4°C. Secondary antibodies goat anti-rabbit IgG Alexa Fluor 594 and goat anti-guinea pig IgG Alexa Fluor 488 were added at a 1:400 dilution for 1 hour 30 minutes at room temperature. Sections were photographed with an AxioCamAR camera and exported to AxioVision software.
Statistical analysis
Data were analyzed by a unpaired Student t test using GraphPad Prism (GraphPad Software). All results are expressed as means ± SEM. A value of P < .05 was defined as statistically significant.
Results
Generation of PitARKO mice
ARfl/fl mice were generated by mating heterozygous female mouse (ARfl/wt;αCre+/−) with male mouse (ARfl/Y;αCre−/−). Disrupted AR expression was determined by quantitative real-time PCR, Western blotting, and immunostaining. AR mRNA levels were significantly reduced by 50% in pituitary of PitARKO mice compared with that in their control littermates. Other tissues such as hypothalamus, ovary, and liver have similar levels of AR expression (Figure 1A). AR is knocked out only in pituitary and not in tail, hypothalamus, or liver as assessed by PCR of genomic DNA (Supplemental Figure 1). Expression of AR is reduced in the PitARKO mice, but not abolished. This is expected because 50% of secretory cells in the anterior pituitary express AR, and all the gonadotropes and some GH-secretory cells contain AR (27). Roughly 10% of the secretory cells in the anterior pituitary are gonadotropes (28). AR protein levels were examined by Western blotting, and the protein levels were also significantly reduced in pituitary of PitARKO mice compared with those in control mice; there was no change in AR protein expression levels in hypothalamus, ovary, and liver from control and PitARKO littermates (Figure 1, B (B1 and B2), and Supplemental Figure 2). We then performed immunostaining of AR in the pituitary glands of control and PitARKO mice, and AR is expressed exclusively in the pituitary anterior lobe. We observed AR (red fluorescence) localized in the nucleus of cytoplasmic LH staining (green fluorescence) in gonadotrope cells in control pituitary, and minimal AR was detected in the nucleus of cytoplasmic LH staining in PitARKO anterior pituitary (Figure 1C and Supplemental Figure 3). Because aGSU is also expressed in thyrotropes, we measured mRNA expression of TSHβ; we did not observe any significant difference between control and PitARKO mice (Supplemental Figure 4A).
Figure 1.

AR is reduced in the pituitary of PitARKO mice. A, the AR mRNA level was measured by quantitative RT-PCR in 4 different tissues, pituitary, hypothalamus (Hypo), ovary, and liver. AR was significantly reduced (50%) in the pituitary of PitARKO (KO) mice compared with that in control (Con) littermates, but no difference in AR expression was observed in other tissues. Data are means ± SEM (n = 6–20). B, Western blotting was performed, and AR protein levels were quantified by densitometry in 3 independent experiments. The AR protein level was reduced significantly in pituitary of KO mice (B1 and B2), whereas no change was observed in other tissues compared with those in controls. Data are means ± SEM (n = 6). C, Immunostaining of AR and LH, showing nuclear AR localized inside of cytoplasmic LH staining in the control mouse pituitary. Red fluorescence (AR) is expressed in the nucleus, green fluorescence (LH) is expressed mainly in cytoplasm, and blue fluorescence is nuclear 4,6-diamidino-2-phenylindole (DAPI). Arrows point to the nucleus in which AR and LH colocalize in the merged panel of control pituitary.
PitARKO mice showed same time of puberty and first estrus and similar pattern of estrous cyclicity
Vaginal opening and first estrus are 2 indicators of female puberty onset (29). Daily vaginal smears were obtained after vaginal opening to identify the age of first estrus. There was no significant difference in either vaginal opening (30.1 ± 1.3 [control] vs 28.6 ± 1.1 [PitARKO]) or first estrus (36.8 ± 1.8 [control] vs 36.1 ± 1.5 [PitARKO]) between the control and PitARKO groups (Figure 2A). To assess the ongoing reproductive cyclicity of the female mice, vaginal cytology was analyzed from adult female mice for 16 consecutive days; control and PitARKO groups both exhibited regular estrous cycles (Figure 2B) with an average of 6 days per cycle, although PitARKO mice spent a slightly higher percentage of time in estrus (P = .065).
Figure 2.

Female puberty and fertility. A, PitARKO (KO) females exhibited an age of puberty onset similar to that of control (Con) littermates (n = 10–16). B, Percentage of time spent in each stage was not significantly different between control and PitARKO mice (n = 10–21). C, Female mice were introduced with a proven fertile male WT mouse, and the total numbers of litters per female were recorded during the 90 days (n = 6). There was no significant difference between control and PitARKO groups. D, Numbers of pups per mouse per litter was significantly reduced in PitARKO mice with those in control mice during the 90 days (n = 6). Values are means ± SEM. NS, nonsignificant; P, proestrus; E, estrus; M, metestrus; D, diestrus.
PitARKO mice exhibited no difference in the numbers of litters but did have smaller litter sizes
Fertility was examined in a continuous mating protocol in control and PitARKO mice. Control or PitARKO female mice were mated with proven fertile male WT mice, and litters and pups per litter were recorded. During the 90-day mating period, there was no significant difference in the number of litters between the control (3.8 ± 0.2) and PitARKO (3.5 ± 0.2) groups (Figure 2C); however, the number of pups per litter that each dam bore was significantly reduced in the PitARKO mice compared with that in control littermates (10.5 ± 0.6 vs 6.5 ± 0.6) (Figure 2D).
PitARKO mice have lower FSH serum levels and reduced LH surge
Morning (9–10 am) serum LH levels were similar between control and PitARKO female mice for all the stages of the estrous cycle (Supplemental Figure 5A). However, FSH levels were significantly lower in PitARKO than in control mice through all the stages of the cycle (Supplemental Figure 5B). Blood was also collected at 9 am, 3 pm, and 8 pm on the day of proestrus. LH levels were increased slightly at 3 pm in PitARKO mice but were not significantly different between the groups (PitARKO, 0.77 ± 0.15 ng/mL; control, 0.44 ± 0.09 ng/mL) (Figure 3 A, middle column, P = .24). Although both control and PitARKO mice showed dramatically increased LH levels at 8 pm on proestrus, reflecting the peak of the gonadotropin surge, control mice have significantly higher LH levels (11.41 ± 3.30 ng/mL) than PitARKO littermates (2.58 ± 1.98 ng/mL) (Figure 3A, right column). A similar pattern was observed for FSH levels at 8 pm on proestrus: control mice had significantly higher levels of FSH (2.26 ± 0.36 ng/mL) at 8 pm than PitARKO littermates (1.04 ± 0.39 ng/mL) (Figure 3B, right column). To examine whether this difference in serum LH levels was due to differences in E2 secretion, E2 levels were also measured at 3 pm of diestrus and proestrus. Although both control and PitARKO mice had significantly higher E2 levels on proestrus than on diestrus, there was no significant difference between control (8.40 ± 0.77 pg/mL) and PitARKO (8.29 ± 0.69 pg/mL) mice (Figure 3C) at proestrus. In addition, no difference was observed in testosterone levels between control (14.01 ± 2.89) and PitARKO (13.78 ± 2.32) mice (Figure 3D) on proestrus. To confirm that this difference in serum LH levels was not due to differences in pituitary sensitivity to GnRH, GnRH stimulation tests were also performed at the morning basal level (metestrus/diestrus). The pituitaries from control and PitARKO mice exhibited equal responses to GnRH at doses of 100 ng/kg BW (1.07 ± 0.12 vs 1.08 ± 0.20 ng/mL), 400 ng/kg BW (1.58 ± 0.25 vs 1.37 ± 0.24 ng/mL), and 2000 ng/kg BW (4.43 ± 0.28 vs 4.13 ± 0.45 ng/mL) (Figure 3E). FSH was only significantly increased in both control and PitARKO mice at a dose of 2000 ng/kg BW after GnRH stimulation (3.87 ± 1.1 vs 1.08 ± 0.1 ng/mL) (Figure 3F).
Figure 3.

Hormone levels. A, LH levels were measured on the day of proestrus at 10 am, 3 pm, and 8 pm. There was a slight increase of LH in PitARKO (KO) mice compared with that in control (Con) mice at 3 pm. LH levels were dramatically increased at 8 pm in both groups, and LH levels of control mice were significantly increased compared with those at other time points; however, the increase in LH levels was significantly attenuated in PitARKO mice compared with that in control mice (n = 6–10). B, FSH levels were significantly increased in both control and PitARKO mice at 8 pm, and there were significantly higher FSH levels in control mice than in PitARKO mice (n = 8–15). C, E2 levels were measured at 3 pm of diestrus and proestrus, and there were no significant differences between control and PitARKO groups (n = 6–20). D, Testosterone levels were similar between control and PitARKO groups at 3 pm (n = 6–14). E and F, Pituitary response to GnRH stimulation was tested at 3 different doses. There was no significant difference in LH secretion in response to any of the doses in control and PitARKO groups. FSH was significantly increased in both control and PitARKO groups at the dose of 2000 ng/kg (n = 7–12). Values are means ± SEM. NS, nonsignificant.
PitARKO mice showed significantly reduced LH and FSH serum and mRNA levels after OVX and E2 replacement
Serum levels were measured 7 days after OVX and 7 days after E2 replacement (OVX+E2). In both control and PitARKO mice, LH and FSH serum levels after OVX were dramatically increased compared with basal levels; however, LH/FSH levels were significantly higher in control mice (3.69 ± 0.65/11.16 ± 1.30 ng/mL) than in PitARKO mice (1.37 ± 0.23/4.62 ± 0.98 ng/mL) (Figure 4, A and B, middle columns). After E2 replacement LH/FSH levels were dramatically reduced in both control (0.62 ± 0.03/3.30 ± 0.25 ng/mL) and PitARKO (0.41 ± 0.02/1.49 ± 0.41 ng/mL) mice although LH/FSH levels were still significantly higher in control mice than in PitARKO mice (Figure 4, A and B, right columns). The negative feedback is intact in both groups. mRNA levels of LH and FSH were also measured in the same paradigm. We observed the same pattern of LH and FSH mRNA expression as seen for serum LH and FSH levels: LH mRNA levels of intact mice were statistically the same; however, FSH mRNA levels of intact PitARKO mice were dramatically reduced by 50% compared with those of control mice. LH/FSH mRNA levels were increased significantly (3.41 ± 0.23/5.71 ± 0.51-fold) compared with those of PitARKO mice (1.64 ± 0.15/2.91 ± 0.68-fold) after OVX, and after E2 replacement, LH/FSH levels were reduced in both control (1.14 ± 0.10/1.29 ± 0.20-fold) and PitARKO (0.61 ± 0.08/0.65 ± 0.09-fold) mice (Figure 5, A and B).
Figure 4.
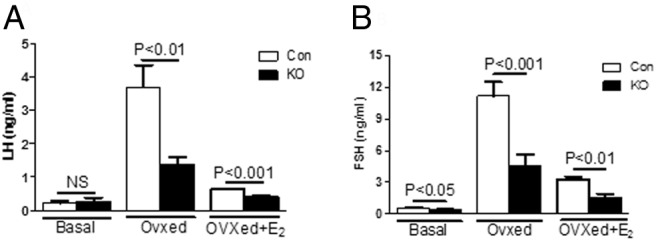
Hormone levels after gonadectomy. A, LH levels were measured at basal (metestrus/diestrus), 7 days after ovariectomy (OVXed), and 7 days after E2 replacement (OVXed+E2). There was no difference in basal LH levels. LH levels were increased in both groups after OVX; however, there was a significantly attenuated increase in ovariectomized PitARKO (KO) mice compared with that in control (Con) mice. After replacement with E2, negative feedback was restored in both control and PitARKO groups (n = 6–12). B, Basal FSH levels were significantly reduced in PitARKO mice compared with those in control mice. FSH levels showed a pattern similar to those of LH after OVX and E2 replacement (n = 6–21)
Figure 5.

Quantitative real-time PCR. A, LHβ mRNA was measured at basal, 7 days after OVX (OVXed), and 7 days after E2 replacement (OVXed+E2). There was no significant difference at basal; however, mRNA levels were increased significantly higher in control (Con) than in PitARKO (KO) mice after OVX. E2 replacement reduced mRNA levels dramatically in both groups (n = 9–24). B, FSHβ mRNA levels in PitARKO mice were significantly lower at basal and increased less after OVX compared to those in control mice. After E2 replacement, expression in both groups was restored to basal levels (n = 9–29). C, Activin A mRNA levels were increased significantly in control mice compared with those in PitARKO mice after OVX. Activin A mRNA expression was equally suppressed after E2 replacement (n = 8–21). D, Activin B was significantly decreased in PitARKO but not in control mice after OVX; however, there was no difference in basal levels and after E2 replacement between control and PitARKO mice (n = 8–21). E, Inhibin A mRNA levels were not significantly different between control and PitARKO mice at basal, OVX, or E2 replacement (n = 6–11) F. pacap1 mRNA levels exhibited no difference between control and KO mice (n = 6–9). G, gnrhr mRNA was significantly reduced in PitARKO mice compared with those in control mice after OVX and E2 replacement (n = 6–11). H, Prolactin mRNA levels were similar between control and PitARKO mice (n = 6–11). Values are means ± SEM. NS, nonsignificant.
Reduced levels of LH and FSH in PitARKO mice are associated with alterations in pituitary activin/inhibin/gnrhr expression
Although deletion of AR did not alter the basal LH levels and the responses to GnRH stimulation, LH levels were reduced after OVX. AR alone or in interaction with other transcription factors could regulate LH/FSH expression. Several genes that regulate LHβ and FSHβ expression levels in pituitary were measured by quantitative real-time PCR. Activin A, activin B, inhibin-α and PACAP are important local regulators of LH/FSH synthesis and secretion (3, 5, 30–33). We did not observe any significant difference in mRNA levels (activin A, activin B, inhibin-α, pacap1 and prolactin, and gnrhr) between control and PitARKO gonad intact mice (Figure 5, C–H, left column). Surprisingly, although levels of LH/FSH are significantly increased after OVX in both WT and PitARKO mice compared with those in intact mice, we only observed a significant increase in activin A mRNA levels after OVX in WT mice and not in PitARKO mice (Figure 5C, middle column). Activin A, activin B, and gnrhr mRNA levels were all significantly higher in control mice than in to PitARKO mice after OVX (Figure 5, C, D, and G, middle columns). Meanwhile, there was no significant difference in inhibin-α mRNA levels between control and PitARKO mice after OVX (Figure 5E). There was no difference in pacap1 and prolactin mRNA levels between control and PitARKO mice after OVX. Interestingly, gnrhr expression is reduced in PitARKO vs WT mice, whereas mRNA levels of activin A, activin B, inhibin-α, pacap1, and prolactin show similar responses to E2 replacement between control and PitARKO mice (Figure 5, A–F and H, right columns). Expression levels of transcription factors that bind the LH/FSH promoter to increase LH/FSH mRNA expression were also measured by quantitative real-time PCR (Supplemental Figure 6). Nr5A1 of PitARKO was also significantly decreased compared with that of the control after OVX (Supplemental Figure 2A); BMP2 and Nr5A2 show similar patterns between control and PitARKO mice (Supplemental Figure 6, B and C).
PitARKO ovaries showed reduced numbers of CL and increased unhealthy antral follicles
Ovaries were compared between control and PitARKO mice. Histological analysis revealed that there were significantly reduced numbers of CL in PitARKO ovaries (11.8 ± 1.4) compared with those in control ovaries (16.6 ± 1.6). However, the numbers of antral follicles and preantral follicles (including primordial, primary, and secondary follicles) were not significantly different between control and PitARKO mice (Figure 6, A and B). When the antral follicles were examined in more detail, the PitARKO ovaries showed significantly increased numbers of pyknotic granulosa cells compared with those in the control ovaries (Figure 6, B and C). There were no significant differences in StAR, Cyp17A1, and Cyp19 gene expression levels between control and PitARKO mice as assessed by quantitative real-time PCR (Figure 6, D and E).
Figure 6.

Ovary follicle morphology and ovarian gene expression. A, CL, antral follicles, and preantral follicles (primodial, primary, and secondary follicles) were examined in control (Con) and PitARKO (KO) ovaries. Only PitARKO mice showed a significant reduction in CL (n = 6–12). B, Photomicrographs depicting the reduced number of CL in PitARKO ovaries. The antral follicle is bordered by a solid line, with higher magnification to the right. The antral follicle of the KO ovary had pyknotic granulosa cells that were not present in the antral follicle of the control ovary. C, Antral follicles were examined in detail, and PitARKO ovaries showed significantly increased numbers of pyknotic granulosa cells compared with those in the control ovaries. D and E, Steroidogenic enzyme mRNA expression: StAR, Cyp17, and Cyp19 mRNA levels were not significantly different between control and PitARKO groups (n = 8–15). NS, nonsignificant.
Discussion
By deleting the AR in pituitary gonadotropes, we have demonstrated a critical role for AR-mediated actions in the pituitary in females. Specifically, AR is important in the maintenance of basal FSH expression and secretion and for elaboration of the LH surge to trigger ovulation; its absence leads to impaired fertility.
Unlike global ARKO female mice with irregular cyclicity (10, 12), in the PitARKO female mice, we observed normal puberty and estrous cycling (Figure 2) compared with those in control littermates. This finding suggests that AR in gonadotropes is not essential for the cyclic variation in E2 levels that drives the vaginal cellular changes used to identify estrous cycle progress. Thus, the disrupted estrous cycle observed in the global ARKO mouse was probably due to absence of AR in the hypothalamus and/or gonad (6, 13). The serum LH levels were not different between control and PitARKO mice. We and other groups showed that WT serum LH levels were not different in any cycle stage in rodents when blood was collected in the morning (Supplemental Figure 5A and Ref. 34).
Like the global ARKO females (6), PitARKO females exhibit a significantly reduced ovulatory serum LH surge compared with that in the control females at late proestrus (1 hour before lights off) (Figure 3A), demonstrating that androgens/AR signaling in the pituitary are essential for normal ovulatory activity in female mice. These data agree with the results from other groups who have shown that global ARKO female mice exhibit disrupted ovulation (10–12). Studies in a variety of species have shown that androgens/AR play an important role in the full elaboration of the LH surge required for triggering ovulation. For example, the testosterone antagonist flutamide blocks ovulation and LH surges in laying hens (35), testosterone is required to facilitate GnRH stimulation of LHβ mRNA on proestrus in the female rat (1), both testosterone and dihydrotestosterone promote mouse follicular growth in vitro (36), and dihydrotestosterone treatment enhanced the ovulation rate in female pigs (37). Earlier studies have also shown that serum testosterone and pituitary AR increase on the afternoon of proestrus, coincident with the rise of LHβ mRNA (38, 39). Our data demonstrated that androgen signaling at the level of the pituitary is important in the priming and regulation of the preovulatory LH surge and ovulation. In our study, although E2 and testosterone secretion were significantly increased on the afternoon of proestrus (3 pm, 6 hours before lights off), our estradiol level is similar to those levels observed in WT proestrus mice as described in Cheng et al (6). We did not observe any differences in E2 and testosterone levels between control and PitARKO mice at 3 pm on proestrus (Figure 3, C and D). This implies that the pituitary response to steroids, rather than a difference in steroid levels, mediated the lack of ovulatory LH surge in the PitARKO animals. Likewise, the pituitary showed a similar response to exogenous GnRH as assessed by an increase in LH levels but, interestingly, not FSH levels (Figure 3, E and F). We also measured LH levels in a subset of mice at 8:30 pm (data not shown), and LH levels were slightly decreased in both WT and PitARKO mice compared with those at 8 pm. This finding suggests that the timing of the LH surge was not delayed in the PitARKO mice. Our PitARKO model and a complete ARKO model (6, 14) share a number of similarities in hormone regulation. These include reduced levels of LH after OVX (Figure 4A) and reduced surge levels of LH (Figure 3A) compared with those of controls. As in Cheng et al (6), we probed acute pituitary responsiveness to GnRH using a GnRH stimulation test (Figure 3E) and demonstrated that LH levels were equivalent between the PitARKO and control mice. Cheng et al (6) suggested that this finding indicates that neuroendocrine dysfunction was primarily at the level of the hypothalamus. However, our data conclusively demonstrate a role for pituitary AR in elaboration of the LH surge and for ovulation. A GnRH stimulation test provides information about acute responsiveness to GnRH but does not model the complex nature of the preovulatory gonadotropin surge, which is influenced by both GnRH secretion and gonadal steroid priming of the pituitary and perhaps other neuronal, autocrine, paracrine, and endocrine influences.
Interestingly, although morning serum LH levels (Figure 3A and Supplemental Figure 5A) are not different from those of controls, serum FSH levels in PitARKO mice are significantly reduced compared with those of control mice at all stages of the estrous cycle (Figure 3B and Supplemental Figure 5B). Although the surge of FSH during the preovulatory period is not as dramatic as the LH surge, FSH levels are also significantly lower in PitARKO mice than in control mice at late proestrus (8 pm, 1 hour before light off) and for the secondary FSH surge observed on the morning of estrus (Supplemental Figure 5B). These findings further demonstrate that androgens/AR signaling are important in the regulation of the preovulatory surge. ARKO females showed significantly higher FSH serum levels that control females on the morning of estrous (14), which opposes our observations in PitARKO females (Supplemental Figure 5B), demonstrating that AR in the pituitary, in contrast to the hypothalamus and or ovary, positively regulates FSH expression and secretion. Furthermore, after the loss of ovarian feedback by OVX, the LH/FSH levels of PitARKO females increased significantly compared with those of nonovariectomized females, but not to the extent experienced by control ovariectomized females (Figure 4, A and B). These attenuated levels of LH/FSH after OVX in PitARKO females demonstrate an AR-dependent regulation at the pituitary level. In ovariectomized mice replaced with E2 to provide constant E2 suppression, PitARKO females showed augmented negative feedback, resulting in lower LH secretion than that in control females (Figure 4). Similar findings were reported in studies performed in the complete ARKO mouse (14).
To investigate the mechanism underlying the differences in gonadotropin secretion between control and PitARKO females, local expression of LH and FSH and their regulatory factors were investigated. Previous studies in the rat showed that a high dose of testosterone, similar to male levels (1.86 ng/mL), decreased GnRH-stimulated LHβ mRNA expression and secretion in females, but proestrous levels of testosterone (0.42 ng/mL) increased GnRH-stimulated LHβ mRNA expression (1). In vitro, androgen suppresses GnRH-stimulated rat LHβ gene transcription in LβT2 cells and in cultured pituitaries of transgenic mice expressing an LHβ-luciferase reporter gene (20). In addition, AR suppresses the bovine LHβ promoter in cultured αT3–1 cells by interacting with SF1 (21). We did not observe any differences in intact basal LHβ mRNA expression between control and PitARKO females (Figure 5A). Although LHβ mRNA increased after OVX, we observed a more significant increase in LHβ mRNA expression in control than in PitARKO females. Upon E2 replacement, PitARKO females had lower levels of LHβ mRNA than control females in response to the constant suppression (Figure 5A). The LHβ and FSHβ mRNA expression pattern matched well with secretion of each hormone for each group, implying that AR acts via its effect on gonadotrope expression rather than secretion. To understand the regulation of expression of LH/FSHβ in the PitARKO mice by androgen and its receptor, we investigated several other factors that have been established to play an important role and either are regulated by or interacted with AR locally in the pituitary (4, 5, 19, 21, 40–42). Activin A, activin B, inhibin A, and follistatin are important regulators of LH/FSH synthesis and secretion (4, 30, 32, 43), particularly for FSH, and their effects are likely to be autocrine and paracrine (3). AR works with activins to regulate FSHβ (32–36). Although intact FSHβ mRNA was significantly lower in PitARKO females than in controls, we did not observe any difference in the expression of activin A/B and inhibin A between control and PitARKO females (Figure 5, C–E). Perhaps the mechanism of AR regulation is directly at the level of the FSH promoter to regulate FSH synthesis and secretion (19, 40). The FSHβ promoter has AR binding sites, HRE1 and HRE2, to which AR can bind to regulate promoter activation FSHβ expression (3). The LHβ promoter has no clear high-affinity AR binding site (44). Gnrhr expression has also been shown to be regulated by AR in vitro (20), and studies using a luciferase reporter demonstrate that AR regulates the proximal 1.2 kb of the gnrhr gene (41). The decreased morning FSH secretion we observed was not seen in the global ARKO female mouse (6). This could be due to lack of androgen/AR negative feedback at the hypothalamic level of the global ARKO and thus increased GnRH signaling, compensating for reduced expression of FSHβ at the pituitary level due to the absence of AR or could be due to differences in sensitivity of the FSH assays used in the different studies. We measured mRNA expression of SF1 and SF2 transcription factors that have been reported to regulate LHβ and expression (Supplemental Figure 6, A and C). We saw no significant differences in expression of these transcription factors in intact mice. Thus, we propose that AR is serving as a transcription factor regulating FSHβ expression.
To test whether changes in central feedback might be mediating the effects, we examined gnrh mRNA levels in the anteroventral periventricular nucleus of hypothalamus of PitARKO and control mice and found that they were equally increased in the 2 groups after OVX (Supplemental Figure 7). The hypothalamus is important in the regulation of the surge, and we did not impair the function of the hypothalamus. After OVX, both LH and FSHβ mRNA expression and secretion were significantly lower in PitARKO females than in control females. There are a number of common transcription factors that may regulate both LH and FSH expression (45, 46). In contrast to what we observed in intact mice (Figure 5, C and D, left column), after OVX, we observed that activin A was significantly increased in control mice compared with that in PitARKO mice and that activin B was significantly decreased in PitARKO mice relative to that of controls (Figure 5, C and D, middle columns). No difference was observed between PitARKO and control mice for inhibin-α mRNA levels after OVX (Figure 5E). Although in rat, hamster, sheep, and cow, gnrhr mRNA expression is increased after OVX (47) in the mouse, we and others (47) have observed significantly decreased expression of gnrhr after OVX, and this decreased expression was further reduced in PitARKO females (Figure 5G, middle column). Previous studies showed that at least 20% occupancy of intact gnrhr in rat pituitary is sufficient to produce the maximal LH response (48). Therefore, the control ovariectomized mice may still have sufficient gnrhr (50% of intact) to fully respond to GnRH stimulation, whereas the PitARKO females, with only 20% gnrhr expression, may not be able to elaborate a complete response to GnRH. Taken together, the decreased activin A/B and reduced gnrhr expression after OVX in PitARKO females may explain the reduced expression and secretion of LH and FSH. It is interesting to note that the observed deficits were not due to a global decline in anterior pituitary function as a number of other factors (Figure 5, F and H) examined did not differ between control and PitARKO mice. These data may indicate a ligand-independent role for AR either in the regulation of the signaling pathways or directly at the level of AR binding sites in the promoters of the genes.
We do not see impaired follicular development in PitARKO mice. We observed similar numbers of preantral (primodial, primary, and secondary follicles) and antral follicles (Figure 6A). However, the numbers of CL were significantly reduced in PitARKO females relative to those of controls (Figure 6, A and B). We showed increased numbers of unhealthy antral follicles in PitARKO ovaries (Figure 6, B and C). This finding may be due to the lower basal and surge levels of FSH in PitARKO mice, important for influencing the maturation of antral follicles. Confirming that neither the floxed AR allele nor the CRE transgene were affecting the reproductive phenotype, no difference was observed between ARfl/wt;acre− and ARfl/fl;acre− mice or between WT and cre+ mice (Supplemental Figure 4). We propose that AR regulates FSH directly in intact nice, and that without AR, it will decrease FSH synthesis and pituitary secretion, resulting in unhealthy follicles and impairing ovulation. As discussed before, androgen signaling may be involved in pituitary self-priming for the preovulatory surge, which leads to the reduced LH surge levels in PitARKO mice. The impaired preovulatory surge and fewer ovulations results in reduced numbers of pups (Figure 2) and impaired reproductive function.
In summary, gonadotrope AR is important for the regulation of gonadotropin synthesis and secretion and is essential for the elaboration of the preovulatory gonadotropin surge and ovulation. These studies reveal a novel role for androgen signaling in female reproduction and may contribute to our understanding of the impact of hyperandrogenism in women.
Additional material
Supplementary data supplied by authors.
Acknowledgments
We gratefully acknowledge the advice of Drs Sally Radovick and Fred Wondisford.
This work was supported by the National Institutes of Health (Grants K99HD068130 to S.W. and U01 HD066432 to A.W.). Technical support was provided by the Integrated Physiology Core of the Baltimore DRTC (P60DK079637) and the University of Virginia Ligand Assay Core.
Disclosure Summary: The authors have nothing to disclose.
Footnotes
- AR
- androgen receptor
- ARKO
- androgen receptor knockout
- BW
- body weight
- CL
- corpora lutea
- CV
- coefficient of variation
- E2
- estradiol
- OVX
- ovariectomy
- PACAP
- pituitary adenylate cyclase-activating polypeptide
- PitARKO
- pituitary gonadotroph-specific knockout
- WT
- wild type.
References
- 1. Yasin M, Dalkin AC, Haisenleder DJ, Marshall JC. Testosterone is required for gonadotropin-releasing hormone stimulation of luteinizing hormone-β messenger ribonucleic acid expression in female rats. Endocrinology. 1996;137:1265–1271. [DOI] [PubMed] [Google Scholar]
- 2. Gregory SJ, Kaiser UB. Regulation of gonadotropins by inhibin and activin. Semin Reprod Med. 2004;22:253–267. [DOI] [PubMed] [Google Scholar]
- 3. Bernard DJ, Fortin J, Wang Y, Lamba P. Mechanisms of FSH synthesis: what we know, what we don't, and why you should care. Fertil Steril. 2010;93:2465–2485. [DOI] [PubMed] [Google Scholar]
- 4. Thackray VG, Mellon PL, Coss D. Hormones in synergy: regulation of the pituitary gonadotropin genes. Mol Cell Endocrinol. 2010;314:192–203. [DOI] [PMC free article] [PubMed] [Google Scholar]
- 5. Grafer CM, Halvorson LM. Androgen receptor drives transcription of rat PACAP in gonadotrope cells. Mol Endocrinol. 2013;27:1343–1356. [DOI] [PMC free article] [PubMed] [Google Scholar]
- 6. Cheng XB, Jimenez M, Desai R, Middleton LJ, Joseph SR, Ning G, Allan CM, Smith JT, Handelsman DJ, Walters KA. Characterizing the neuroendocrine and ovarian defects of androgen receptor-knockout female mice. Am J Physiol Endocrinol Metab. 2013;305:E717–E726. [DOI] [PubMed] [Google Scholar]
- 7. Lubahn DB, Joseph DR, Sullivan PM, Willard HF, French FS, Wilson EM. Cloning of human androgen receptor complementary DNA and localization to the X chromosome. Science. 1988;240:327–330. [DOI] [PubMed] [Google Scholar]
- 8. Gelmann EP. Molecular biology of the androgen receptor. J Clin Oncol. 2002;20:3001–3015. [DOI] [PubMed] [Google Scholar]
- 9. Abbott DH, Padmanabhan V, Dumesic DA. Contributions of androgen and estrogen to fetal programming of ovarian dysfunction. Reprod Biol Endocrinol. 2006;4:17. [DOI] [PMC free article] [PubMed] [Google Scholar]
- 10. Hu YC, Wang PH, Yeh S, et al. Subfertility and defective folliculogenesis in female mice lacking androgen receptor. Proc Natl Acad Sci USA. 2004;101:11209–11214. [DOI] [PMC free article] [PubMed] [Google Scholar]
- 11. Shiina H, Matsumoto T, Sato T, et al. Premature ovarian failure in androgen receptor-deficient mice. Proc Natl Acad Sci USA. 2006;103:224–229. [DOI] [PMC free article] [PubMed] [Google Scholar]
- 12. Walters KA, Allan CM, Jimenez M, et al. Female mice haploinsufficient for an inactivated androgen receptor (AR) exhibit age-dependent defects that resemble the AR null phenotype of dysfunctional late follicle development, ovulation, and fertility. Endocrinology. 2007;148:3674–3684. [DOI] [PubMed] [Google Scholar]
- 13. Sen A, Hammes SR. Granulosa cell-specific androgen receptors are critical regulators of ovarian development and function. Mol Endocrinol. 2010;24:1393–1403. [DOI] [PMC free article] [PubMed] [Google Scholar]
- 14. Walters KA, McTavish KJ, Seneviratne MG, et al. Subfertile female androgen receptor knockout mice exhibit defects in neuroendocrine signaling, intraovarian function, and uterine development but not uterine function. Endocrinology. 2009;150:3274–3282. [DOI] [PMC free article] [PubMed] [Google Scholar]
- 15. Haisenleder DJ, Burger LL, Aylor KW, et al. Testosterone stimulates follicle-stimulating hormone β transcription via activation of extracellular signal-regulated kinase: evidence in rat pituitary cells. Biol Reprod. 2005;72:523–529. [DOI] [PubMed] [Google Scholar]
- 16. Gharib SD, Leung PC, Carroll RS, Chin WW. Androgens positively regulate follicle-stimulating hormone β-subunit mRNA levels in rat pituitary cells. Mol Endocrinol. 1990;4:1620–1626. [DOI] [PubMed] [Google Scholar]
- 17. Dalkin AC, Paul SJ, Haisenleder DJ, Ortolano GA, Yasin M, Marshall JC. Gonadal steroids effect similar regulation of gonadotrophin subunit mRNA expression in both male and female rats. J Endocrinol. 1992;132:39–45. [DOI] [PubMed] [Google Scholar]
- 18. Winters SJ, Ishizaka K, Kitahara S, Troen P, Attardi B. Effects of testosterone on gonadotropin subunit messenger ribonucleic acids in the presence or absence of gonadotropin-releasing hormone. Endocrinology. 1992;130:726–734. [DOI] [PubMed] [Google Scholar]
- 19. Thackray VG, McGillivray SM, Mellon PL. Androgens, progestins, and glucocorticoids induce follicle-stimulating hormone β-subunit gene expression at the level of the gonadotrope. Mol Endocrinol. 2006;20:2062–2079. [DOI] [PMC free article] [PubMed] [Google Scholar]
- 20. Curtin D, Jenkins S, Farmer N, et al. Androgen suppression of GnRH-stimulated rat LHβ gene transcription occurs through Sp1 sites in the distal GnRH-responsive promoter region. Mol Endocrinol. 2001;15:1906–1917. [DOI] [PubMed] [Google Scholar]
- 21. Jorgensen JS, Nilson JH. AR suppresses transcription of the LHβ subunit by interacting with steroidogenic factor-1. Mol Endocrinol. 2001;15:1505–1516. [DOI] [PubMed] [Google Scholar]
- 22. Yeh S, Tsai MY, Xu Q, et al. Generation and characterization of androgen receptor knockout (ARKO) mice: an in vivo model for the study of androgen functions in selective tissues. Proc Natl Acad Sci USA. 2002;99:13498–13503. [DOI] [PMC free article] [PubMed] [Google Scholar]
- 23. Brothers KJ, Wu S, DiVall SA, et al. Rescue of obesity-induced infertility in female mice due to a pituitary-specific knockout of the insulin receptor. Cell Metab. 2010;12:295–305. [DOI] [PMC free article] [PubMed] [Google Scholar]
- 24. Wu S, Divall S, Hoffman GE, Le WW, Wagner KU, Wolfe A. Jak2 is necessary for neuroendocrine control of female reproduction. J Neurosci. 2011;31:184–192. [DOI] [PMC free article] [PubMed] [Google Scholar]
- 25. Wu S, Divall S, Nwaopara A, et al. Obesity induced infertility and hyperandrogenism are corrected by deletion of the insulin receptor in the ovarian theca cell. Diabetes. 2014;63:1270–1282. [DOI] [PMC free article] [PubMed] [Google Scholar]
- 26. Wu S, Divall S, Wondisford F, Wolfe A. Reproductive tissues maintain insulin sensitivity in diet-induced obesity. Diabetes. 2012;61:114–123. [DOI] [PMC free article] [PubMed] [Google Scholar]
- 27. Pelletier G. Localization of androgen and estrogen receptors in rat and primate tissues. Histol Histopathol. 2000;15:1261–1270. [DOI] [PubMed] [Google Scholar]
- 28. Yeung CM, Chan CB, Leung PS, Cheng CH. Cells of the anterior pituitary. Int J Biochem Cell Biol. 2006;38:1441–1449. [DOI] [PubMed] [Google Scholar]
- 29. Safranski TJ, Lamberson WR, Keisler DH. Correlations among three measures of puberty in mice and relationships with estradiol concentration and ovulation. Biol Reprod. 1993;48:669–673. [DOI] [PubMed] [Google Scholar]
- 30. Corrigan AZ, Bilezikjian LM, Carroll RS, et al. Evidence for an autocrine role of activin B within rat anterior pituitary cultures. Endocrinology. 1991;128:1682–1684. [DOI] [PubMed] [Google Scholar]
- 31. DePaolo LV, Bald LN, Fendly BM. Passive immunoneutralization with a monoclonal antibody reveals a role for endogenous activin-B in mediating FSH hypersecretion during estrus and following ovariectomy of hypophysectomized, pituitary-grafted rats. Endocrinology. 1992;130:1741–1743. [DOI] [PubMed] [Google Scholar]
- 32. Zheng W, Jimenez-Linan M, Rubin BS, Halvorson LM. Anterior pituitary gene expression with reproductive aging in the female rat. Biol Reprod. 2007;76:1091–1102. [DOI] [PubMed] [Google Scholar]
- 33. Garrel G, Simon V, Denoyelle C, et al. Unsaturated fatty acids disrupt Smad signaling in gonadotrope cells leading to inhibition of FSHβ gene expression. Endocrinology. 2014;155:592–604. [DOI] [PubMed] [Google Scholar]
- 34. Helena CV, de Oliveira Poletini M, Sanvitto GL, et al. Changes in alpha-estradiol receptor and progesterone receptor expression in the locus coeruleus and preoptic area throughout the rat estrous cycle. J Endocrinol. 2006;188:155–165. [DOI] [PubMed] [Google Scholar]
- 35. Rangel PL, Sharp PJ, Gutierrez CG. Testosterone antagonist (flutamide) blocks ovulation and preovulatory surges of progesterone, luteinizing hormone and oestradiol in laying hens. Reproduction. 2006;131:1109–1114. [DOI] [PubMed] [Google Scholar]
- 36. Cárdenas H, Pope WF. Administration of testosterone during the follicular phase increased the number of corpora lutea in gilts. J Anim Sci. 1994;72:2930–2935. [DOI] [PubMed] [Google Scholar]
- 37. Murray AA, Gosden RG, Allison V, Spears N. Effect of androgens on the development of mouse follicles growing in vitro. J Reprod Fertil. 1998;113:27–33. [DOI] [PubMed] [Google Scholar]
- 38. Rush ME, Blake CA. Serum testosterone concentrations during the 4-day estrous cycle in normal and adrenalectomized rats. Proc Soc Exp Biol Med. 1982;169:216–221. [DOI] [PubMed] [Google Scholar]
- 39. Handa RJ, Reid DL, Resko JA. Androgen receptors in brain and pituitary of female rats: cyclic changes and comparisons with the male. Biol Reprod. 1986;34:293–303. [DOI] [PubMed] [Google Scholar]
- 40. Spady TJ, Shayya R, Thackray VG, Ehrensberger L, Bailey JS, Mellon PL. Androgen regulates follicle-stimulating hormone β gene expression in an activin-dependent manner in immortalized gonadotropes. Mol Endocrinol. 2004;18:925–940. [DOI] [PMC free article] [PubMed] [Google Scholar]
- 41. Burger LL, Haisenleder DJ, Wotton GM, Aylor KW, Dalkin AC, Marshall JC. The regulation of FSHβ transcription by gonadal steroids: testosterone and estradiol modulation of the activin intracellular signaling pathway. Am J Physiol Endocrinol Metab. 2007;293:E277–E285. [DOI] [PubMed] [Google Scholar]
- 42. Thackray VG, Mellon PL. Synergistic induction of follicle-stimulating hormone β-subunit gene expression by gonadal steroid hormone receptors and Smad proteins. Endocrinology. 2008;149:1091–1102. [DOI] [PMC free article] [PubMed] [Google Scholar]
- 43. Duval DL, Ellsworth BS, Clay CM. Is gonadotrope expression of the gonadotropin releasing hormone receptor gene mediated by autocrine/paracrine stimulation of an activin response element? Endocrinology. 1999;140:1949–1952. [DOI] [PubMed] [Google Scholar]
- 44. Keri RA, Wolfe MW, Saunders TL, et al. The proximal promoter of the bovine luteinizing hormone β-subunit gene confers gonadotrope-specific expression and regulation by gonadotropin-releasing hormone, testosterone, and 17β-estradiol in transgenic mice. Mol Endocrinol. 1994;8:1807–1816. [DOI] [PubMed] [Google Scholar]
- 45. Blumenfeld Z, Ritter M. Inhibin, activin, and follistatin in human fetal pituitary and gonadal physiology. Ann NY Acad Sci. 2001;943:34–48. [DOI] [PubMed] [Google Scholar]
- 46. Coss D, Thackray VG, Deng CX, Mellon PL. Activin regulates luteinizing hormone β-subunit gene expression through Smad-binding and homeobox elements. Mol Endocrinol. 2005;19:2610–2623. [DOI] [PMC free article] [PubMed] [Google Scholar]
- 47. Clayton RN, Detta A, Naik SI, Young LS, Charlton HM. Gonadotrophin releasing hormone receptor regulation in relationship to gonadotrophin secretion. J Steroid Biochem. 1985;23:691–702. [DOI] [PubMed] [Google Scholar]
- 48. Naor Z, Clayton RN, Catt KJ. Characterization of gonadotropin-releasing hormone receptors in cultured rat pituitary cells. Endocrinology. 1980;107:1144–1152. [DOI] [PubMed] [Google Scholar]
Associated Data
This section collects any data citations, data availability statements, or supplementary materials included in this article.