Abstract
Deviations from ‘normal’ locomotion exhibited by humans and laboratory animals may be determined using automated systems that capture both temporal and spatial gait parameters. Although many measures generated by these systems are unrelated and independent, some may be related and dependent, representing redundant assessments of function. To investigate this possibility, a treadmill-based system was used to capture gait parameters from normal and ataxic rats, and a multivariate analysis was conducted to determine deviations from normal. Rats were trained on the treadmill at two speeds, and gait parameters were generated prior to and following lesions of the olivocerebellar pathway. Control (non-lesioned) animals exhibited stable hindlimb gait parameters across assessments at each speed. Lesioned animals exhibited alterations in multiple hindlimb gait parameters, characterized by significant increases in stride frequency, braking duration, stance width, step angle, and paw angle and decreases in stride, stance, swing and propulsion durations, stride length and paw area. A principal component analysis of initial hindlimb measures indicated 3 uncorrelated factors mediating performance, termed rhythmicity, thrust and contact. Deviation in the performance of each animal from the group mean was determined for each factor and values summed to yield the Cumulative Gait Index (CGI), a single value reflecting variation within the group. The CGI for lesioned animals increased 2.3-fold relative to unlesioned animals. This study characterizes gait alterations in laboratory rats rendered ataxic by destruction of the climbing fiber pathway innervating Purkinje cells and demonstrates that a single index can be used to describe overall gait impairments.
Keywords: ataxia, treadmill gait analysis, olivocerebellar-lesioned rats, DigiGait™ Imaging System
1. Introduction
Gait analysis has been used for more than 30 years to assess the effects of physical and chemical perturbations on walking and running in laboratory animals [1, 2]. Initial assessments were conducted using the ‘painted footprint’ procedure, and typically provided measures of stride length and stance width. This led to the development of a basic apparatus that extended measures to include stride frequency and velocity [3]. Since that time, several systems have been developed that provide information at different walking speeds, critical for understanding both coordination and balance, as well as for assessing the efficacy of possible therapeutic regimens for movement disorders [4].
Results from studies to date characterizing gait alterations in ataxic laboratory animals are difficult to reconcile because of two confounds, viz., the effect of speed on gait parameters and the interdependency of gait parameters. For example, although increased hindpaw stance width has been shown to be manifest by two unrelated transgenic ataxic mouse models [5, 6], this alteration was not present in other studies using a ‘Lurcher-like’ mouse or following cerebellar lesions [7, 8]. A careful analysis of these studies indicates that for the former, animals were tested at a treadmill speed of 35 cm/s, whereas for the latter, animals were run at 22 and 15 cm/s, respectively. The idea that walking speed is a prime consideration determining gait parameters is underscored by evidence that gait alterations in Lurcher mice, who walk considerably slower than their wild-type counterparts (<15 cm/s compared with >25 cm/s), were obviated when walking speed was taken into account [9].
In addition to speed, the interdependency of gait parameters must also be considered. Although laboratory animal studies have not addressed this issue, clinical studies have indicated that many gait parameters are highly related and interdependent, and may represent similar aspects of the same general function [10]. To isolate and identify combinations of gait parameters that are strongly associated with the variance in the data, but are uncorrelated to one another, a principal component analysis (PCA) may be used. Although the mathematics of this process are complex [11–13], the purpose of a PCA is to reduce the dimensionality of a data set consisting of several interrelated variables, while retaining the variation present in the data [12–13]. Thus, redundant aspects of the original data set are consolidated into a smaller number of principal components. Clinicians have used PCA to analyze gait and have demonstrated that 16 independent gait parameters could be used to describe gait patterns in humans, and based on these values, a ‘normalcy index’ could be calculated that reflected gait patterns that deviated from normal [14], a concept that has been validated [15] and extended [16] in the clinical literature. A similar strategy has not been applied to laboratory animal studies, an approach that would be highly beneficial for translational investigations.
Therefore, the goals of this study were to: characterize gait abnormalities in olivocerebellar-lesioned rats; use a PCA to identify independent aspects of gait performance; calculate a single quantifiable index of gait; and determine how this index is altered following destruction of the olivocerebellar pathway. To accomplish this, the DigiGait™ Imaging System (Mouse Specifics, Boston, MA) was used to determine temporal and spatial gait parameters in normal rats and rats rendered ataxic following olivocerebellar lesions [17]. Although this system has been used to assess gait parameters in rats following spinal cord injury [18–20], peripheral nerve injury or inflammation [21, 22], and damage to the brain [23, 24], this is the first study to describe a single index reflecting gait pattern impairment in laboratory rats rendered ataxic by destruction of the climbing fiber pathway innervating Purkinje cells.
2. Materials and Methods
2.1 Animals and lesions
Male Sprague-Dawley rats (225–250 grams and 52–60 days old, Harlan Industries, Indianapolis, IN) were acclimated to the vivarium for 1 week and housed 2 per cage in a temperature and humidity-controlled vivarium on a 12:12 hr (7 am:7 pm) light-dark cycle; experiments were conducted between 10 am and 2 pm to minimize variability in behavior. The care and use of animals were approved in accordance with guidelines set by the University of South Florida Institutional Animal Care and Use Committee and the National Institutes of Health Guide for the Care and Use of Laboratory Animals.
Lesions of the olivocerebellar pathway were induced by the administration of 3-acetylpyridine (3-AP; 70 mg/kg, i.p.) followed by an injection of nicotinamide (300 mg/kg, i.p.) 3.5 hours later; chemicals were obtained from Sigma-Aldrich Co. (St. Louis, MO). This injection paradigm has been demonstrated to localize the resulting neurotoxicity primarily to the inferior olive, with weak effects on other brain regions involved in motor control [25–27]. In addition, studies in our laboratory have demonstrated that this injection paradigm leads to the loss of 85% of inferior olivary neurons in rats, and results in impaired performance on the rotorod, balance beam, and in the open field [17].
2.2 Apparatus and behavioral paradigm
Prior to initial recordings, rats were trained on the DigiGait™ treadmill for 5 consecutive days. Preliminary studies indicated that a speed of 25 cm/s represented a ‘comfortable’ walking speed for rats, in general agreement with prior reports [28, 29]. Further, initial studies indicated that at a lower speed of 15 cm/s, rats did not perform adequately for gait analysis, whereas at a more challenging speed of 35 cm/s, representing a fast walk, performance was consistent; speeds faster than 35 cm/s may have been too challenging for animals with olivocerebellar lesions to walk consistently for analysis purposes (unpublished observations). Each training day consisted of a single 2 minute trial at each speed, with trials separated by 1–2 hours, and with the lower speed always run first. The treadmill belt and enclosure were wiped with 70% ethanol between each trial.
For training, each animal was secured inside the apparatus and the treadmill was started immediately at 25 cm/s. For training at 35 cm/s, the treadmill belt was started at 25 cm/s, and increased to 35 cm/s at a rate of 1 cm/s. A majority of animals exhibited rhythmic gait, and quickly learned to walk comfortably on the treadmill, while some animals did not walk adequately, and exhibited avoidance behaviors, such as turning or rearing. When this occurred, these behaviors were corrected by ‘nudging’ the animals using the plastic bumper at either end of the apparatus, changing the direction of the treadmill, or slowing the treadmill speed followed by gradually increasing it as the animal learned the task.
Initial behavioral assessments were conducted 2 days following completion of training. Rats were placed in the apparatus and a 2 minute trial at both speeds was recorded. Animals who did not complete a minimum of 6 uninterrupted strides at either 25 or 35 cm/s were retested at that speed. At 2 days following initial recordings, animals meeting criteria were assigned randomly to either unlesioned (control) or lesioned groups (Fig. 1), with a balanced distribution of ages within each group. The unlesioned group was used to ascertain the stability of gait parameters over time, thereby detecting any alterations that may have occurred as a consequence of acclimation or habituation to the apparatus. Animals in the lesioned group received injections of 3-AP/nicotinamide. All animals were reassessed 7 days later for 2 minutes at both speeds.
Fig. 1.
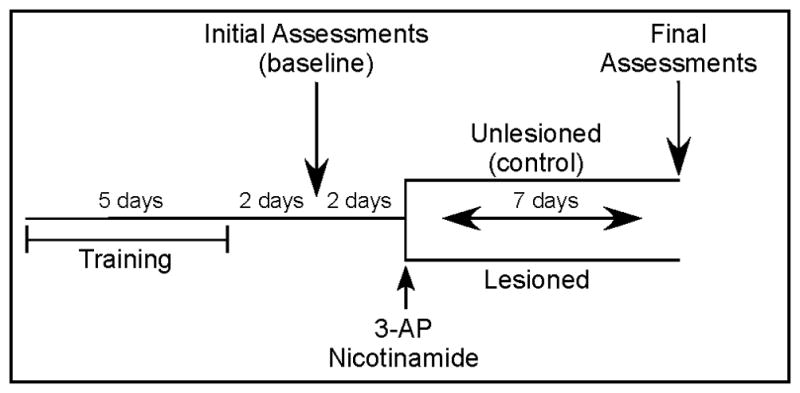
Experimental paradigm. Rats were trained to walk on the DigiGait™ system at 25 and 35 cm/s for 5 consecutive days. Initial behavioral assessments were conducted 2 days following training by recording baseline performance for 2 minutes at both speeds. At 2 days following initial recordings, animals were assigned randomly to either unlesioned (control) or lesioned groups, and the latter received injections of 3-AP/nicotinamide. All animals were reassessed 7 days later for 2 minutes at both speeds.
2.3 Data capture and analysis
DigiGait™ Imaging software (version 12.2) was used to generate temporal and spatial gait parameters. The videos generated by the system were analyzed by a rater blinded to the group assignment of each animal. Sequences for analysis were chosen by the blinded rater based on: the positioning of the animal relative to the boundaries of the apparatus to ensure that the gait of the animal was unimpeded; and the ability of the rater to clearly discern all 4 paws. The number of sequences containing ≥6 but ≤11 strides within a 2 minute trial was counted, i.e., animals completing 12 consecutive strides completed 2 sequences. Approximately 5% of all animals (3 animals) walked throughout the entire 2 minute trial; the remaining animals walked sporadically throughout the trial, typically completing between 10 and 20 6-stride sequences within each trial. Strides were not counted when animals were in contact with the plastic bumpers, when animals were hopping, or when the speed of the treadmill was increased from 25 to 35 cm/s. Data were analyzed using a one-way analysis of variance (ANOVA), with Dunnett’s test post hoc to compare final and initial assessments.
Although the DigiGait™ system generated more than 40 indices of gait dynamics and posture, the measures analyzed included stride duration, stride frequency, stance duration, swing duration, braking duration, propulsion duration, step angle, stride length, stance width, paw angle, and paw area (Fig. 2). In addition, the software calculates the variability associated with each spatial parameter, which was also included for analysis; percentages and ratio calculations were not included for analysis. A representative sequence was chosen for analysis, 6–8 strides within this sequence were analyzed, and an average value generated for each parameter. Data indicated that the lesion affected gait parameters in both forelimbs and hindlimbs, albeit the magnitude of change for most parameters was greater in the latter, in agreement with our prior study [17]. In addition, for control rats, not all forelimb gait parameters were stable across measurements, likely reflecting the dual functionality of the forelimbs, which are involved not only in ambulation, but also in tactile sampling and gaining proprioceptive information [30]; thus, only values generated from hindlimbs were reported. Further, left and right hindlimb parameters did not differ significantly (p>0.05 as per paired t-tests) at each speed or assessment timepoint, indicating that gait was symmetrical, and thus, measures from right and left hindlimbs were pooled.
Fig. 2.
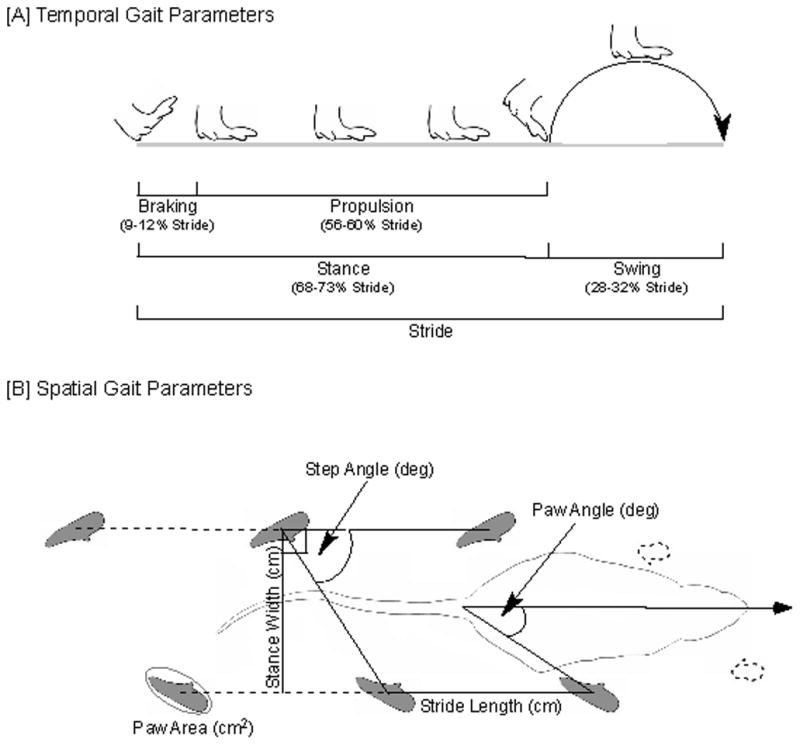
Representation of gait parameters. Diagrammatic representation of temporal and spatial gait parameters analyzed.
Data obtained from controls or animals subsequently lesioned with 3-AP were analyzed by a 2 × 2 repeated measures ANOVA with treadmill speed (25 and 35 cm/s) and assessment (initial and final) as variables. Subsequently, independent t-tests were used to investigate differences between treadmill speeds, and paired samples t-tests were used to determine differences between timepoints.
A PCA was performed to determine whether the individual components of gait were interrelated and whether redundant aspects of the original data set could be consolidated into principal components. This analysis provided and isolated combinations of the original measures that were uncorrelated, representing distinct components of the data set. Varimax rotation was used to derive orthogonal factor scores and the minimum Eigenvalue for extraction was set at 1. Factor loadings were analyzed using data from both treadmill speeds, and items that met a minimum loading of ≥ ± 0.5 were considered relevant. The cumulative gait index (CGI) was determined as described [14] with minor modification. Briefly, the mean (μ) and standard deviation (σ) of each measure, at each speed, were determined using the initial values from all animals in the study. A Z-transformation ( ) was applied to the data from each animal at both speeds and assessment timepoints. To generate the individual factor values, the associated factor loadings (α) derived from the PCA were used to weight the Z-transformed data and these values were summed and the absolute value taken (|Σαz|). The resulting values were averaged across speeds to generate a factor value at each assessment timepoint. These factor values were summed to yield the CGI, representing the total deviation from typical gait for each animal. Individual factors and the CGI were analyzed by a mixed factor ANOVA with assessment as a repeated measure; Tukey’s test was used post hoc to ascertain group differences.
Correlational analyses (Pearson’s r) at each assessment timepoint and each treadmill speed were used to determine whether there were any relationships among gait parameters, as well as whether treadmill speed and/or 3-AP administration altered these relationships.
Statistical analyses were performed using GraphPad Prism version 6.0 (GraphPad Software, Inc., San Diego, CA) and SPSS version 21.0 (SPSS Inc., Chicago, IL). A level of p<0.05 was accepted as evidence of a significant effect.
3. Results
3.1 Ability to walk on the treadmill
A total of 63 animals were subjected to the 5 day training procedure and underwent initial assessment. At this time, 3 rats would not walk on the treadmill at either speed, 1 rat would not walk at 35 cm/s, and 3 rats failed to complete at least 1 sequence containing 6–11 strides at both speeds. Thus, 7 of the rats were not used for further study because they failed to meet criteria upon initial assessment. The 56 remaining animals were assigned to either the unlesioned (n=11) or lesioned (n=45) groups with the latter containing 4 times as many animals as the former because a wide range of behavioral deficits occurs as a consequence of the lesion [17].
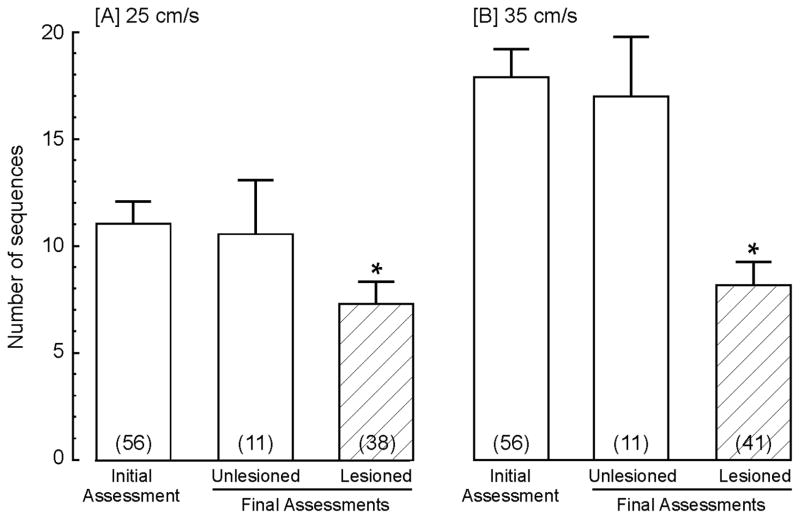
To determine whether the ability of animals to walk on the treadmill was stable over time and whether the lesion affected walking ability, the number of sequences containing 6–11 uninterrupted strides within each trial was counted. The number of sequences upon initial assessment ranged from 1–31 at 25 cm/s and 1–44 at 35 cm/s, with averages of 11 and 18, respectively (Fig. 3). For unlesioned animals, performance was stable over time. For lesioned rats, 7/45 and 4/45 animals did not complete a 6–11 stride sequence at treadmill speeds of 25 and 35 cm/s, respectively. The remaining animals (38 at 25 cm/s and 41 at 35 cm/s) exhibited significantly (p<0.05) fewer sequences at both 25 cm/s [F (3,105) = 3.173] and 35 cm/s [F (3,108) = 14.19] with 34% and 54% decreases relative to initial values, respectively. Based on studies demonstrating reduced locomotor activity of these animals in the open field [17], it is likely that this decreased number of step sequences reflects a performance deficit and not a lack of compliance. The 11 animals that did not complete a 6–11 stride sequence at either speed (see above) did complete a 3–5 stride sequence. Analysis of gait parameters generated from these truncated sequences indicated that they did not differ significantly (p>0.05) from those generated by animals who completed 6–11 uninterrupted strides. Thus, data were pooled for analyses of gait parameters.
Fig. 3.
Effects of olivocerebellar lesions on treadmill performance. The number of uninterrupted sequences containing 6–11 strides within a 2 minute segment at treadmill speeds of [A] 25 cm/s and [B] 35 cm/s were determined at baseline (initial assessment) and 9 days later (final assessment) for both unlesioned and 3-AP lesioned animals. Bars represent mean values + s.e.m.; the number of animals per group is shown in parentheses. The asterisks denote significant (p < 0.05) differences.
3.2 Effects of treadmill speed on gait parameters
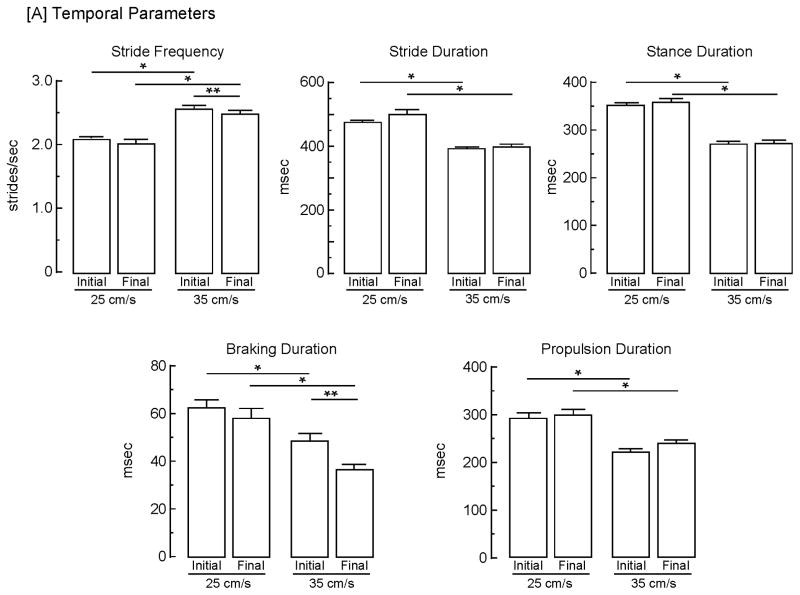
Unlesioned (control) animals were studied to determine the effects of treadmill speed on gait, ascertain whether gait measures were stable over time, and characterize the gait cycle in these rats. Results of a 2 × 2 repeated measures ANOVA revealed a significant (p<0.05) main effect of speed on 5 temporal parameters (Fig. 4A). Increasing treadmill speed from 25 to 35 cm/s resulted in a 21% increase in stride frequency [F (1, 10) = 109.8], an 18% decrease in stride duration [F (1, 10) = 102.2], a 23% decrease in stance duration [F (1, 10) = 88.8], a 28% decrease (reflecting a 21% decrease for initial and a 34% decrease for final assessments) in braking duration [F (1, 10) = 12.6], and a 21% decrease in propulsion duration [F (1, 10) = 50.8]; there was no difference between swing duration at 25 cm/s and 35 cm/s (data not shown). Although each of these parameters was altered by treadmill speed, the relative proportion of time spent in each phase of the gait cycle was constant (Fig. 2). Additionally, a 2 × 2 repeated measures ANOVA indicated a significant (p<0.05) main effect of assessment timepoint (initial vs final) at 35 cm/s for stride frequency [F (1, 10) = 5.15] and braking duration [F (1, 10) = 8.00], with a 4% decrease for the former and a 22% decrease for the latter.
Fig. 4.
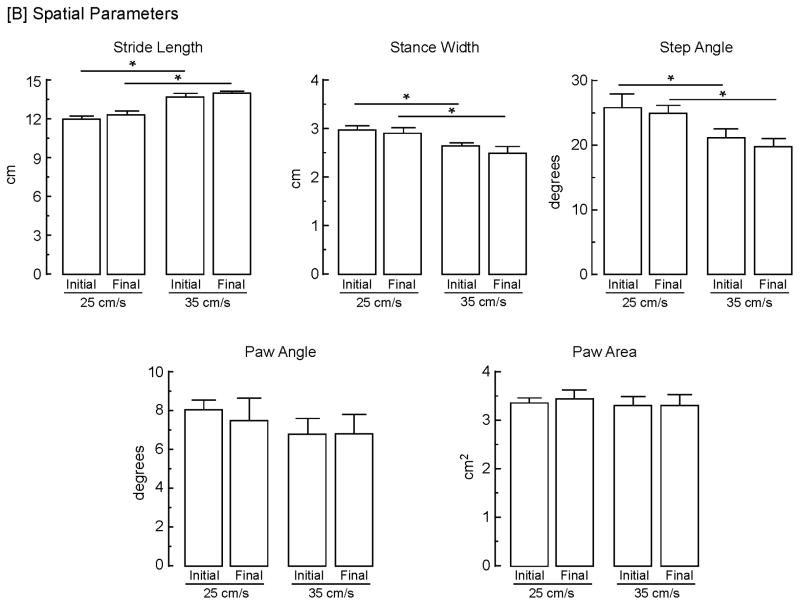
Stability of gait measures and effects of treadmill speed. Both [A] temporal and [B] spatial gait parameters were determined from a representative stride sequence exhibited by control (unlesioned) animals at treadmill speeds of both 25 and 35 cm/s at 2 days following training and 9 days later. Bars represent mean values + s.e.m. of determinations from 11 animals. Data were analyzed using a 2 × 2 (speed x assessment timepoint) repeated measures ANOVA with t-tests post hoc to assess differences. The asterisks indicate significant (p < 0.05) differences between speeds for: stride frequency, initial [t (20) = 5.97] and final [t (20) = 5.97]; stride duration, initial [t (20) = 6.02] and final [t (20) = 5.84]; stance duration, initial [t (20) = 8.28] and final [t (20) = 6.99]; braking duration, initial [t (20) = 2.23] and final [t (20) = 3.06]; propulsion duration, initial [t (20) = 5.34] and final [t (20) = 5.20]; stride length, initial [t (20) = 5.58] and final [t (20) = 4.29]; and step angle, final [t (20) = 2.56]. The double asterisks indicate significant (p < 0.05) differences between assessments for stride frequency [t (10) = 2.25] and braking duration [t (10) = 2.52].
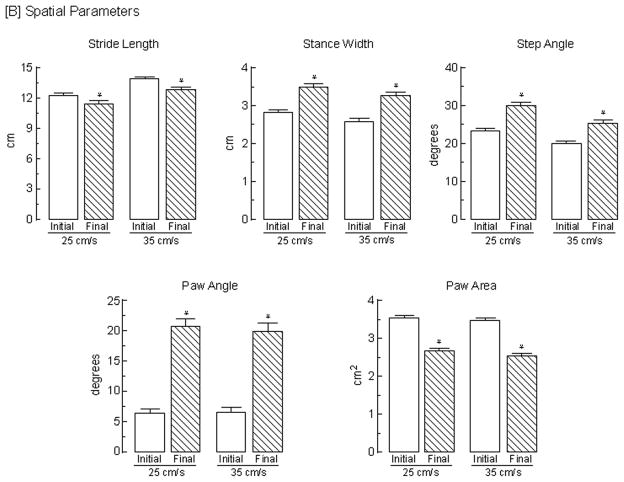
The spatial parameters significantly (p<0.05) affected by speed (Fig. 5B) were stride length, which increased by 16% [F (1, 10) = 76.3], stance width, which decreased by 9% [F (1,10) = 9.07), and step angle, which decreased by 22% [F (1, 10) = 8.20]. Although paw angle decreased by 15%, this was not significant; paw area was unaltered. There was no main effect of speed on the calculated variability for stride length, stance width, step angle, paw angle, or paw angle. In addition, there was a significant (p<0.05) main effect of assessment timepoint on paw angle variability at both speeds [F (1, 10) = 9.81]. At 25 cm/s, paw angle variability increased 55% from 5.3 ± 0.3 to 8.2 ± 0.9 [t (10) = 3.20] and at 35 cm/s, paw angle variability increased 53% from 5.9 ± 0.5 to 9.0 ± 1.1 [t (10) = 2.63].
Fig. 5.
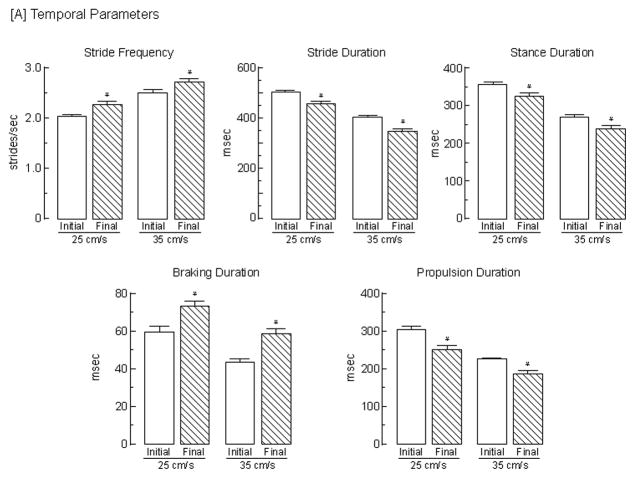
Effects of 3-AP on gait parameters. Both [A] temporal and [B] spatial gait parameters were determined from a representative stride sequence exhibited by animals 2 days prior to (initial) and 7 days following (final) the induction of an olivocerebellar lesion by the administration of 3-AP; parameters were determined at treadmill speeds of both 25 and 35 cm/s. Bars represent mean values + s.e.m. of determinations from 45 animals. Data were analyzed using a 2 × 2 (speed x assessment timepoint) repeated measures ANOVA with t-tests post hoc to assess differences. The asterisks indicate significant (p < 0.05) differences between initial (pre-lesion) and final (post-lesion) assessments for: stride frequency, 25 cm/s [t (44) = 3.77] and 35 cm/s [t (44) = 5.73]; stride duration, 25 cm/s [t (44) = 3.53] and 35 cm/s [t (44) = 6.82]; stance duration, 25 cm/s [t (44) = 4.37] and 35 cm/s [t (44) = 7.68]; braking duration, 25 cm/s [t (44) = 3.86] and 35 cm/s [t (44) = 5.32]; propulsion duration, 25 cm/s [t (44) = 5.37] and 35 cm/s [t (44) = 11.0]; stride length, 25 cm/s [t (44) = 3.47] and 35 cm/s [t (44) = 6.80]; stance width, 25 cm/s [t (44) = 8.87] and 35 cm/s [t (44) = 7.08]; step angle, 25 cm/s [t (44) = 4.18 ] and 35 cm/s [t (44) = 3.71]; paw angle, 25 cm/s [t (44) = 11.7] and 35 cm/s [t (44) = 11.3]; and paw area, 25 cm/s [t (44) = 9.83] and 35 cm/s [t (44) = 10.7].
3.3 Effects of 3-AP on gait parameters
The effects of olivocerebellar lesions induced by the administration of 3-AP on gait are shown in Fig. 5. Results of a 2 × 2 (speed x assessment) repeated measures ANOVA indicated that the effects of 3-AP were independent of treadmill speed, i.e., there was no interaction. The following significant (p<0.05) temporal alterations were apparent across speeds: an 9% increase in stride frequency [F (1,44) = 32.2]; an 8% decrease in stride duration [F (1,44) = 29.4]; a 10% decrease in stance duration [F (1,44) = 38.6]; a 27% increase in braking duration [F (1,44) = 33.6]; and a 17% decrease in propulsion duration [F (1,44) = 60.5]. In addition, the lesion led to a 6% decrease in swing duration [F (1,44) = 4.11] from 138 to 131 msec and from 135 to 126 msec at 25 cm/s and 35 cm/s, respectively. Thus, the relative proportion of the gait cycle in the braking phase increased from an average of 11% to 16%, while that in the propulsion phase decreased from an average of 59% to 53%, indicating that impaired animals required greater time to achieve maximal paw contact during braking.
The spatial measures significantly (p<0.05) altered by the lesion included: an 8% decrease in stride length [F(1,44) = 33.8]; a 25% increase in stance width [F (1,44) = 81.6]; a 32% increase in step angle [F(1,44) = 28.0]; a 233% increase in paw angle [F (1,44) = 162.6]; and a 25% decrease in paw area [F (1,44) = 176.4]. In addition, paw angle variability increased significantly [F (1, 44) = 159.3, p<0.05] at both speeds. At 25 cm/s, paw angle variability increased by 160% from 5.8 ± 0.3 to 15.1 ± 0.9 [t (44) = 9.62] and at 35 cm/s paw angle variability increased by 171% from 5.5 ± 0.3 to 14.9 ± 0.9 [t (44) = 9.97]. Paw area variability also increased significantly [F (1, 44 = 9.43, p<0.05] by 26% at 25 cm/s from 0.35 ± 0.03 to 0.44 ± 0.03 [t (44) = 2.67] and by 18% at 35 cm/s from 0.34 ± 0.02 to 0.40 ± 0.02 [t (44) = 2.12]; stance width and stride length variability were unaffected. Thus, as a result of the lesion, animals had shorter strides, established a wider base of support, had a large and highly variable increase in lateral paw splay, and exhibited less stride-to-stride consistency in the orientation of, and contact made by, the hindpaws.
3.4 PCA and the Cumulative Gait Index (CGI)
To produce a single measure of gait impairment similar to the indices used for clinical populations [10, 14, 16], the 6 temporal and 5 spatial gait parameters analyzed were subjected to a PCA to obviate redundant aspects of the original data set and ascertain whether the information could be consolidated into a smaller number of principal components. This analysis indicated that 3 factors accounted for 72% of the total variance in the data, explaining more variability in the data than any single gait parameter (see Table 1).
Table 1.
Principal component analysis
| Parameter | Rhythmicity (factor 1) | Thrust (factor 2) | Contact (factor 3) |
|---|---|---|---|
| Stride Duration | .991 | −.096 | .070 |
| Stride Frequency | −.987 | .066 | −.069 |
| Stance Duration | .978 | .085 | .029 |
| Propulsion Duration | .933 | −.167 | −.079 |
| Braking Duration | .351 | .633 | .264 |
| Swing Duration | .470 | −.584 | .181 |
| Stride Length | −.272 | −.645 | .386 |
| Stance Width | .167 | .624 | −.220 |
| Step Angle | .069 | .689 | −.238 |
| Paw Angle | −.021 | .529 | .593 |
| Paw Area | .137 | −.234 | −.728 |
|
| |||
| % Total Variance | 38.7 | 21.9 | 11.4 |
Gait parameters from the initial assessment for all animals (n = 56) were used for a principal component analysis. Factor loadings ≥ 0.5 are bolded, representing primary components of the factor.
The first factor (e = 4.254), which was termed Rhythmicity, encompassed the temporal parameters stride duration, stride frequency, stance duration and propulsion duration, but did not include braking or swing durations, both of which were more associated with the second factor. This indicates that stride duration, stride frequency, stance duration and propulsion duration are interdependent components of gait cycle timing, whereas braking and swing duration are somewhat independent of overall stride time. Further, the valences of the loading values indicate that Rhythmicity increases as stride, stance and propulsion durations increase and stride frequency decreases.
The second factor (e = 2.406), which was termed Thrust, included braking and swing durations, as well as stride length, stance width and step angle; although paw angle was positively associated with this factor, it had a greater association with the third factor. Thus, Thrust involves regulating trajectory and momentum through adjustments in the advancement and placement of the hindlimbs. The loading valences for Thrust parameters indicate that this factor increases as braking duration, stance width, and step angle increase and swing duration and stride length decrease. The third factor (e = 1.254), termed Contact, contained paw angle and paw area, and loading valences indicated that Contact increases with increasing paw angle and decreasing paw area.
To determine whether the variability within the population was affected by the lesion, the absolute deviation from the mean for each factor for each animal was determined, and values summed to yield the CGI (Fig. 6). A mixed factor ANOVA indicated that the CGI for unlesioned animals did not change significantly over time, whereas the CGI for lesioned animals increased 2.7-fold (p<0.05) relative to the initial assessment, and 2.3-fold (p<0.05) relative to the final assessment for unlesioned animals [F (1,54) = 18.7]. Further, this difference reflected an increased absolute deviation for all 3 factors and differed significantly (p<0.05) from final assessments for unlesioned rats [Rhythmicity: F (1,54) = 6.57; Thrust: F (1,54) = 19.5; Contact: F (1,54) = 9.47]; the deviations of the 3 factors did not change over time for unlesioned animals.
Fig. 6.
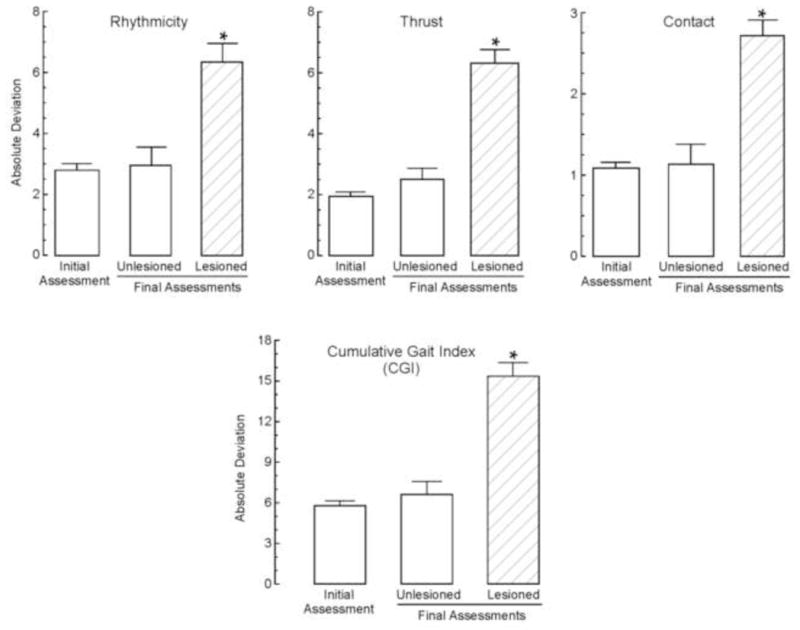
Resultant PCA factors and the cumulative gait index. The 3 factors generated by the PCA (Rhythmicity, Thrust and Contact) and the CGI were analyzed across timepoints. Bars represent mean values + s.e.m. with an n=56 for initial assessments representing the total population, n=11 for the unlesioned group and n=45 for the lesioned group. Data were compared using a one-way ANOVA. The asterisks denote significant (p<0.05) differences from all other groups as determined by Tukey’s test.
3.5 Effects of 3-AP on parameter relationships
To determine whether the lesion affected relationships among gait parameters, correlations were calculated at each speed prior to and following the administration of 3-AP. The lesion did not change relationships involving swing and braking durations, stance width or step angle (data not shown). The only relationships significantly (p<0.05) altered were those involving paw angle and paw area, i.e., components of Contact. Following the administration of 3-AP, paw angle correlated significantly (p<0.05) with stance duration, stride duration, stride length and stride frequency at both speeds, correlations that were not present during the initial assessment (Table 2). Further, there was a negative correlation between paw angle and propulsion duration for the initial assessment that was not affected by 3-AP. In contrast, paw area correlated significantly (p<0.05) with stance duration, stride duration, stride length and stride frequency only at 25 cm/s; the correlations at 35 cm/s did not reach significance. Further, 3-AP altered the relationship (p<0.05) between paw area and propulsion duration at both speeds. These results indicate that the lesion not only affects individual parameters of gait, but in several cases, alters the relationships among these parameters.
Table 2.
Effects of 3-AP on relationships among gait parameters
| Gait Parameters
|
|||||||||||
|---|---|---|---|---|---|---|---|---|---|---|---|
| Stance Duration | Stride Duration | Stride Length | Stride Frequency | Propulsion Duration | |||||||
|
| |||||||||||
| Factor 3 Components | Treadmill Speed | Initial | Final | Initial | Final | Initial | Final | Initial | Final | Initial | Final |
| Paw Angle | |||||||||||
| 25 cm/s | −0.05 | −0.68 | −0.12 | −0.64 | −0.11 | −0.64 | 0.12 | 0.59 | −0.48 | −0.54 | |
| 35 cm/s | −0.12 | −0.44 | −0.06 | −0.37 | −0.07 | −0.37 | −0.06 | 0.34 | −0.43 | −0.27 | |
| Paw Area | |||||||||||
| 25 cm/s | −0.19 | 0.46 | −0.10 | 0.44 | −0.10 | 0.44 | 0.13 | −0.46 | −0.05 | 0.47 | |
| 35 cm/s | −0.06 | 0.24 | −0.04 | 0.23 | −0.03 | 0.22 | 0.06 | −0.16 | 0.17 | 0.35 | |
Correlation coefficients (Pearson’s r) denoting the relationships among gait parameters at each speed prior to (initial) and following (final) the administration of 3-AP; significant (p<0.05) correlations are bolded.
4. Discussion
4.1 3-AP induced gait alterations and the CGI
The present study characterized alterations in temporal and spatial gait parameters at 2 speeds in a rodent model of olivocerebellar ataxia, determined how the relationships between gait parameters were altered in ataxic animals, and quantified the severity of impairment across multiple measures of gait using a single index. Results indicated that increasing treadmill speed resulted in significant changes in all temporal gait parameters, as well as the spatial parameters of stride length, stance width and step angle. For unlesioned animals, performance was stable across the 9 days of assessment at each treadmill speed. Further, when treadmill speed increased, animals compensated by shortening the braking and propulsion durations of the stance phase, and by increasing stride length, alterations that contributed to all other gait parameter changes. Lesions of the inferior olive produced significant changes in multiple gait parameters that were apparent at both treadmill speeds. These alterations included increases in stride frequency, braking duration, stance width, step angle, and paw angle and decreases in stride, stance, propulsion and swing durations, as well as stride length and paw area.
A PCA, performed on gait measures from normal, healthy (unimpaired) animals to capture independent aspects of gait performance on the treadmill, identified 3 factors termed Rhythmicity, Thrust, and Contact. Rhythmicity encompassed temporal parameters (stride frequency, propulsion duration, and stance and stride durations), Thrust was composed of both temporal (swing and braking durations) and spatial (stride length, stance width, and step angle) parameters, and Contact reflected paw angle and area. For each of these factors, lesioned animals exhibited a 2–3 fold increased deviation from typical gait. Further, the CGI, which represents the total deviation from typical gait for all gait measures as determined by summation of the deviations for the 3 independent factors increased 2.7-fold following the lesion. This representation of the overall magnitude of gait impairment has been recognized by clinicians and used to assess gait impairments in humans [14–16]. Using a PCA to identify related measures and consolidate deviations from typical gait minimizes redundancy in the data and provides a single measure that is highly sensitive to changes in performance. Further, the CGI may have greater translational value than any single gait measure when assessing impairment and subsequent treatment effects because individual gait measures may or may not represent the same deficit across species and different species may express the same underlying deficit on different measures. This is the first study to apply this approach to laboratory animals.
4.2 Comparison to assessments in animal models of ataxia
Although numerous studies have investigated gait alterations in mouse models of ataxia, the present study represents the first to characterize both temporal and spatial gait alterations in a rat following olivocerebellar lesions. Prior studies in our laboratory have shown that following the administration of 3-AP, rats exhibit shorter latency to fall from the rotorod, increased time required to cross a stationary beam, decreased velocity and distance moved in the open field, and increased stance width and decreased stride length for both hindlimbs and forelimbs during unforced locomotion [17]. The present study extends these findings to include forced locomotion, and detected multiple alterations in gait measures with hindlimbs exhibiting larger alterations than forelimbs for most parameters. Because rats produce greater ground reaction force in the hindlimbs relative to the forelimbs [31, 32], with hindlimbs providing most of the early braking and supportive forces during locomotion [30], gait alterations in hindlimbs are similar to changes observed in humans [33]. The finding that olivocerebellar lesions affected gait parameters during both forced and unforced or ‘natural’ movement agrees with results from studies investigating 2 unrelated transgenic ataxic mouse models that demonstrated gait alterations for both hindlimbs and forelimbs at speeds of either 15 cm/s or 35 cm/s, respectively [6, 8]. In addition, the 32% increase in step angle following 3-AP administration (Figure 5B) is consistent with ethanol-induced ataxia in rats [34]. [It is critical to note that version 12.5 (and all previous versions) of the DigiGait™ software calculates the complementary angle of the step angle as defined by Hannigan and Riley [34]. Thus, the output from the program was subtracted from 90° to reflect the angle commonly referred to in the literature as step angle.]
Although studies have reported that stride length variability is increased in mice with cerebellar lesions [7], we did not detect any alterations in this measure in olivocerebellar lesioned rats. This difference may be attributed to methodology because the data for the former was based on a single trial following a 30 second habituation to the apparatus [7], whereas data collected in the present study represented a sample of the animal’s best performance, and was dependent upon animals engaging in sustained walking for at least 6 successive strides.
4.3 Comparison of gait alterations between olivocerebellar lesioned rats and humans with ataxic disorders
Several gait alterations exhibited by rats following destruction of the climbing fiber pathway by 3-AP are very similar to those observed in patients with ataxic disorders. Studies have demonstrated that, compared to healthy control subjects, ataxic patients exhibit shorter stride lengths [35–38] and larger stance widths [33, 37–40] during walking or turning, results similar to those in rats with olivocerebellar lesions. Further, the delayed heel-off time (i.e., approximately the beginning point of propulsion) and decreased duration from heel-off to toe-off observed in ataxic patients [35] are highly similar to the increased braking duration and decreased propulsion duration, respectively, exhibited by rats following the administration of 3-AP. In addition, analysis of gait in patients with cerebellar disease using a treadmill system detected an increased foot angle splay [33], similar to that in lesioned rats.
Increased variability of gait parameters is often described in patients with cerebellar lesions [35, 40–42]. Although stride length and stance width variability exhibited by the rats were unaffected by the lesion, paw angle variability was 3 times greater in lesioned than in unlesioned animals. This finding, as well as the increase in paw area variability, indicates that paw placement was less consistent following the lesion. Interestingly, stance width variability was unaltered by the lesion, similar to that reported for patients with cerebellar ataxias [35, 42], perhaps reflecting a consistent maximal increase in base support as a compensatory mechanism. In contrast, stride length variability was unaltered in lesioned animals, whereas it is increased in patients with cerebellar ataxia [35]. The difference between our findings and those in the clinical literature may reflect differences in performance speed. Studies indicate that gait variability in ataxic patients is strongly dependent on walking speed [41, 42], with mimimal variability at the preferred speed of each individual [42]. The present study was conducted during forced locomotion, which may obviate variability relative to spontaneous ambulation. Nevertheless, the overall similarities in gait alterations in the present study and those from the human literature underscore the translational nature of this study and this method of gait assessment.
4.4 Conclusions
Rats rendered ataxic following olivocerebellar lesions exhibit alterations in several hindpaw gait parameters that are similar to gait alterations observed in the clinical population of ataxic patients. The use of multivariate analysis to yield a single measure of gait impairment, the CGI, provides a sensitive and reliable indicator applicable to studies in laboratory animals. This method of assessment should be more useful than quantifying individual gait parameters when engaging in translational studies to develop treatment interventions.
Highlights.
olivocerebellar lesions in rats lead to alterations in hindpaw gait parameters
multivariate analysis was used to ascertain a single index, the cumulative gait index (CGI)
the magnitude of the CGI provides a sensitive and reliable indicator of gait
Acknowledgments
The authors thank Ms. Rebecca A. Philpot for her excellent illustrative contributions. Research reported in this publication was supported by the National Institute of Neurological Disorders and Stroke of the National Institutes of Health under award number R01NS072114.
Abbreviations
- CGI
cumulative gait index
- PCA
principal component analysis
Footnotes
The content is solely the responsibility of the authors and does not necessarily represent the official views of the National Institutes of Health.
Publisher's Disclaimer: This is a PDF file of an unedited manuscript that has been accepted for publication. As a service to our customers we are providing this early version of the manuscript. The manuscript will undergo copyediting, typesetting, and review of the resulting proof before it is published in its final citable form. Please note that during the production process errors may be discovered which could affect the content, and all legal disclaimers that apply to the journal pertain.
References
- 1.de Medinaceli L, Freed WJ, Wyatt RJ. An index of the functional condition of rat sciatic nerve based on measurements made from walking tracks. Exp Neurol. 1982;77:634–43. doi: 10.1016/0014-4886(82)90234-5. [DOI] [PubMed] [Google Scholar]
- 2.Mullenix P, Norton S, Culver B. Locomotor damage in rats after x-irradiation in utero. Exp Neurol. 1975;48:310–24. doi: 10.1016/0014-4886(75)90159-4. [DOI] [PubMed] [Google Scholar]
- 3.Clarke KA, Parker AJ. A quantitative study of normal locomotion in the rat. Physiol Behav. 1986;38:345–51. doi: 10.1016/0031-9384(86)90105-8. [DOI] [PubMed] [Google Scholar]
- 4.Tang W, Su D. Locomotion analysis and its applications in neurological disorders detection: state-of-art review. Network Modeling Analysis in Health Informatics and Bioinformatics. 2013;2:1–12. [Google Scholar]
- 5.Duvick L, Barnes J, Ebner B, Agrawal S, Andresen M, Lim J, et al. SCA1-like disease in mice expressing wild-type ataxin-1 with a serine to aspartic acid replacement at residue 776. Neuron. 2010;67:929–35. doi: 10.1016/j.neuron.2010.08.022. [DOI] [PMC free article] [PubMed] [Google Scholar]
- 6.Maity B, Stewart A, Yang J, Loo L, Sheff D, Shepherd AJ, et al. Regulator of G protein signaling 6 (RGS6) protein ensures coordination of motor movement by modulating GABAB receptor signaling. J Biol Chem. 2012;287:4972–81. doi: 10.1074/jbc.M111.297218. [DOI] [PMC free article] [PubMed] [Google Scholar]
- 7.Stroobants S, Gantois I, Pooters T, D’Hooge R. Increased gait variability in mice with small cerebellar cortex lesions and normal rotarod performance. Behav Brain Res. 2013;241:32–7. doi: 10.1016/j.bbr.2012.11.034. [DOI] [PubMed] [Google Scholar]
- 8.Cops EJ, Sashindranath M, Daglas M, Short KM, da Fonseca Pereira C, Pang TY, et al. Tissue-type plasminogen activator is an extracellular mediator of Purkinje cell damage and altered gait. Exp Neurol. 2013;249:8–19. doi: 10.1016/j.expneurol.2013.08.001. [DOI] [PubMed] [Google Scholar]
- 9.Cendelin J, Voller J, Vozeh F. Ataxic gait analysis in a mouse model of the olivocerebellar degeneration. Behav Brain Res. 2010;210:8–15. doi: 10.1016/j.bbr.2010.01.035. [DOI] [PubMed] [Google Scholar]
- 10.Gouelle A, Megrot F, Presedo A, Husson I, Yelnik A, Pennecot GF. The Gait Variability Index: A new way to quantify fluctuation magnitude of spatiotemporal parameters during gait. Gait Posture. 2013;38:461–5. doi: 10.1016/j.gaitpost.2013.01.013. [DOI] [PubMed] [Google Scholar]
- 11.Abdi H, Williams LJ. Principal component analysis. WIREs Comp Stat. 2010;2:433–459. [Google Scholar]
- 12.Jolliffe IT. Principal Component Analysis. 2. Springer-Verlag; New York: 2002. [Google Scholar]
- 13.Ringner M. What is principal component analysis? Nat Biotechnol. 2008;26:303–4. doi: 10.1038/nbt0308-303. [DOI] [PubMed] [Google Scholar]
- 14.Schutte LM, Narayanan U, Stout JL, Selber P, Gage JR, Schwartz MH. An index for quantifying deviations from normal gait. Gait Posture. 2000;11:25–31. doi: 10.1016/s0966-6362(99)00047-8. [DOI] [PubMed] [Google Scholar]
- 15.Wren TA, Do KP, Hara R, Dorey FJ, Kay RM, Otsuka NY. Gillette Gait Index as a gait analysis summary measure: comparison with qualitative visual assessments of overall gait. J Ped Ortho. 2007;27:765–8. doi: 10.1097/BPO.0b013e3181558ade. [DOI] [PubMed] [Google Scholar]
- 16.Schwartz MH, Rozumalski A. The Gait Deviation Index: a new comprehensive index of gait pathology. Gait Posture. 2008;28:351–7. doi: 10.1016/j.gaitpost.2008.05.001. [DOI] [PubMed] [Google Scholar]
- 17.Wecker L, Engberg ME, Philpot RM, Lambert CS, Kang CW, Antilla JC, et al. Neuronal nicotinic receptor agonists improve gait and balance in olivocerebellar ataxia. Neuropharmacology. 2013;73:75–8. doi: 10.1016/j.neuropharm.2013.05.016. [DOI] [PMC free article] [PubMed] [Google Scholar]
- 18.Ek CJ, Habgood MD, Callaway JK, Dennis R, Dziegielewska KM, Johansson PA, et al. Spatio-temporal progression of grey and white matter damage following contusion injury in rat spinal cord. PLoS One. 2010;5:e12021. doi: 10.1371/journal.pone.0012021. [DOI] [PMC free article] [PubMed] [Google Scholar]
- 19.Springer JE, Rao RR, Lim HR, Cho SI, Moon GJ, Lee HY, et al. The functional and neuroprotective actions of Neu2000, a dual-acting pharmacological agent, in the treatment of acute spinal cord injury. J Neurotrauma. 2010;27:139–49. doi: 10.1089/neu.2009.0952. [DOI] [PMC free article] [PubMed] [Google Scholar]
- 20.Redondo-Castro E, Torres-Espin A, Garcia-Alias G, Navarro X. Quantitative assessment of locomotion and interlimb coordination in rats after different spinal cord injuries. J Neurosci Methods. 2013;213:165–78. doi: 10.1016/j.jneumeth.2012.12.024. [DOI] [PubMed] [Google Scholar]
- 21.Piesla MJ, Leventhal L, Strassle BW, Harrison JE, Cummons TA, Lu P, et al. Abnormal gait, due to inflammation but not nerve injury, reflects enhanced nociception in preclinical pain models. Brain Res. 2009;1295:89–98. doi: 10.1016/j.brainres.2009.07.091. [DOI] [PubMed] [Google Scholar]
- 22.Rittenhouse B, Hill-Pryor CD, McConathy A, Parker P, Franco N, Toussaint E, et al. Effect of combined nicotine and shrapnel exposure on pain measures and gait after nerve injury. Mil Med. 2011;176:1335–40. doi: 10.7205/milmed-d-10-00434. [DOI] [PubMed] [Google Scholar]
- 23.Russell KL, Kutchko KM, Fowler SC, Berman NE, Levant B. Sensorimotor behavioral tests for use in a juvenile rat model of traumatic brain injury: assessment of sex differences. J Neurosci Methods. 2011;199:214–22. doi: 10.1016/j.jneumeth.2011.05.008. [DOI] [PMC free article] [PubMed] [Google Scholar]
- 24.Rane P, King JA. Exploring aversion in an animal model of pre-motor stage Parkinson’s disease. Neuroscience. 2011;181:189–95. doi: 10.1016/j.neuroscience.2011.03.001. [DOI] [PubMed] [Google Scholar]
- 25.Seoane A, Apps R, Balbuena E, Herrero L, Llorens J. Differential effects of trans-crotononitrile and 3-acetylpyridine on inferior olive integrity and behavioural performance in the rat. Eur J Neurosci. 2005;22:880–94. doi: 10.1111/j.1460-9568.2005.04230.x. [DOI] [PubMed] [Google Scholar]
- 26.Llinas R, Walton K, Hillman DE, Sotelo C. Inferior olive: its role in motor learning. Science. 1975;190:1230–1. doi: 10.1126/science.128123. [DOI] [PubMed] [Google Scholar]
- 27.Sotelo C, Hillman DE, Zamora AJ, Llinas R. Climbing fiber deafferentation: its action on Purkinje cell dendritic spines. Brain Res. 1975;98:574–81. doi: 10.1016/0006-8993(75)90374-1. [DOI] [PubMed] [Google Scholar]
- 28.Gillis GB, Biewener AA. Hindlimb muscle function in relation to speed and gait: in vivo patterns of strain and activation in a hip and knee extensor of the rat (Rattus norvegicus) J Exp Biol. 2001;204:2717–31. doi: 10.1242/jeb.204.15.2717. [DOI] [PubMed] [Google Scholar]
- 29.Laughlin LMH, Armstrong RB. Muscular blood flow distribution patterns as a function of running speed in rats. Amer J Physiol. 1982;243:H296–306. doi: 10.1152/ajpheart.1982.243.2.H296. [DOI] [PubMed] [Google Scholar]
- 30.Clarke KA. Differential fore- and hindpaw force transmission in the walking rat. Physiol Behav. 1995;58:415–9. doi: 10.1016/0031-9384(95)00072-q. [DOI] [PubMed] [Google Scholar]
- 31.Clarke KA, Heitmeyer SA, Smith AG, Taiwo YO. Gait analysis in a rat model of osteoarthrosis. Physiol Behav. 1997;62:951–4. doi: 10.1016/s0031-9384(97)00022-x. [DOI] [PubMed] [Google Scholar]
- 32.Muir GD, Whishaw IQ. Red nucleus lesions impair overground locomotion in rats: a kinetic analysis. Eur J Neurosci. 2000;12:1113–22. doi: 10.1046/j.1460-9568.2000.00987.x. [DOI] [PubMed] [Google Scholar]
- 33.Stolze H, Klebe S, Petersen G, Raethjen J, Wenzelburger R, Witt K, et al. Typical features of cerebellar ataxic gait. J Neurol Neurosurg Psychiatry. 2002;73:310–2. doi: 10.1136/jnnp.73.3.310. [DOI] [PMC free article] [PubMed] [Google Scholar]
- 34.Hannigan JH, Riley EP. Prenatal ethanol alters gait in rats. Alcohol. 1988;5:451–4. doi: 10.1016/0741-8329(88)90081-x. [DOI] [PubMed] [Google Scholar]
- 35.Palliyath S, Hallett M, Thomas SL, Lebiedowska MK. Gait in patients with cerebellar ataxia. Mov Disord. 1998;13:958–64. doi: 10.1002/mds.870130616. [DOI] [PubMed] [Google Scholar]
- 36.Morton SM, Bastian AJ. Relative contributions of balance and voluntary leg-coordination deficits to cerebellar gait ataxia. J Neurophysiol. 2003;89:1844–56. doi: 10.1152/jn.00787.2002. [DOI] [PubMed] [Google Scholar]
- 37.Mari S, Serrao M, Casali C, Conte C, Ranavolo A, Padua L, et al. Turning strategies in patients with cerebellar ataxia. Exp Brain Res. 2012;222:65–75. doi: 10.1007/s00221-012-3197-2. [DOI] [PubMed] [Google Scholar]
- 38.Serrao M, Mari S, Conte C, Ranavolo A, Casali C, Draicchio F, et al. Strategies adopted by cerebellar ataxia patients to perform u-turns. Cerebellum. 2013;12:460–8. doi: 10.1007/s12311-012-0441-z. [DOI] [PubMed] [Google Scholar]
- 39.Hudson CC, Krebs DE. Frontal plane dynamic stability and coordination in subjects with cerebellar degeneration. Exp Brain Res. 2000;132:103–13. doi: 10.1007/s002219900291. [DOI] [PubMed] [Google Scholar]
- 40.Ilg W, Golla H, Thier P, Giese MA. Specific influences of cerebellar dysfunctions on gait. Brain. 2007;130:786–98. doi: 10.1093/brain/awl376. [DOI] [PubMed] [Google Scholar]
- 41.Schniepp R, Wuehr M, Neuhaeusser M, Kamenova M, Dimitriadis K, Klopstock T, et al. Locomotion speed determines gait variability in cerebellar ataxia and vestibular failure. Mov Disord. 2012;27:125–31. doi: 10.1002/mds.23978. [DOI] [PubMed] [Google Scholar]
- 42.Wuehr M, Schniepp R, Ilmberger J, Brandt T, Jahn K. Speed-dependent temporospatial gait variability and long-range correlations in cerebellar ataxia. Gait Posture. 2013;37:214–8. doi: 10.1016/j.gaitpost.2012.07.003. [DOI] [PubMed] [Google Scholar]


