

Abstract
3,4,3-LI(1,2-HOPO) is a chelating ligand and decorporation agent that can remove radioactive lanthanides and actinides from the body. Identification of trace impurities in drug samples is gaining much interest due to their significant influence on drug activity. In this study, trace impurities were detected in manufactured lots of 3,4,3-LI(1,2-HOPO) by a developed method of Liquid Chromatography coupled with photo-diode array UV detection and Electrospray Ionization-Quadrupole Time of Flight Mass spectrometry (LC-QTOFMS), via induced-in-source or collision-induced mass fragmentation (Nozzle-Skimmer Fragmentation). Molecular ions were fragmented within the nozzle-skimmer region of electrospray ionization (ESI) mass spectrometer equipped with a Time of Flight detector. Eight major (detected at levels higher than a 0.1% threshold) and seven minor trace impurities were identified. The respective structures of these impurities were elucidated via analysis of the generated fragment ions using mass fragmentation and elemental composition software. Proposed structures of impurities were further confirmed via isotopic modeling.
Keywords: 3,4,3-LI(1,2-HOPO) ligand; LC-MSMS; structural elucidation; method development; fragmentation
1. Introduction
The only functional therapy to reduce the dramatic health consequences of internal contamination with radionuclides such as the actinides is treatment with chelating agents that form excretable low molecular weight metal complexes [1, 2]. The novel synthetic chelator 3,4,3-LI(1,2-HOPO) is currently undergoing pre-clinical development as an actinide decorporation agent for the following indication: Treatment of individuals with known or suspected internal contamination with plutonium (Pu), americium (Am), curium (Cm), uranium (U) or neptunium (Np) to increase the rates of elimination of these radionuclides [3-7]. This compound is a metal-seeking octadentate ligand that chelates actinide ions effectively through four 1-hydroxy-pyridin-2-one metal-binding units that are linked to a linear spermine backbone via amide linkages (Figure 1). While a large-scale synthetic process for the preparation of this compound is well established [8-12], information on potential drug substance impurities must be gathered to pursue development and seek regulatory approval [13, 14]. The type of information provided for each impurity can vary with the nature of the impurity, the analytical procedure by which it is detected, whether it is actually present in significant quantities in the drug substance, whether it has been identified, and the methods used to identify the impurity [15-17]. However, as per the specifications of the International Conference on Harmonization (ICH) guidelines [18], any component of a pharmaceutical product that is not the active substance and is present at levels higher than 0.1% or 1 mg/day intake for a maximum daily dose of 2 g or less, or at levels higher than 0.05% for a daily dose greater than 2 g of drug substance, must be qualified and identified with corresponding toxicity information.
Figure 1.
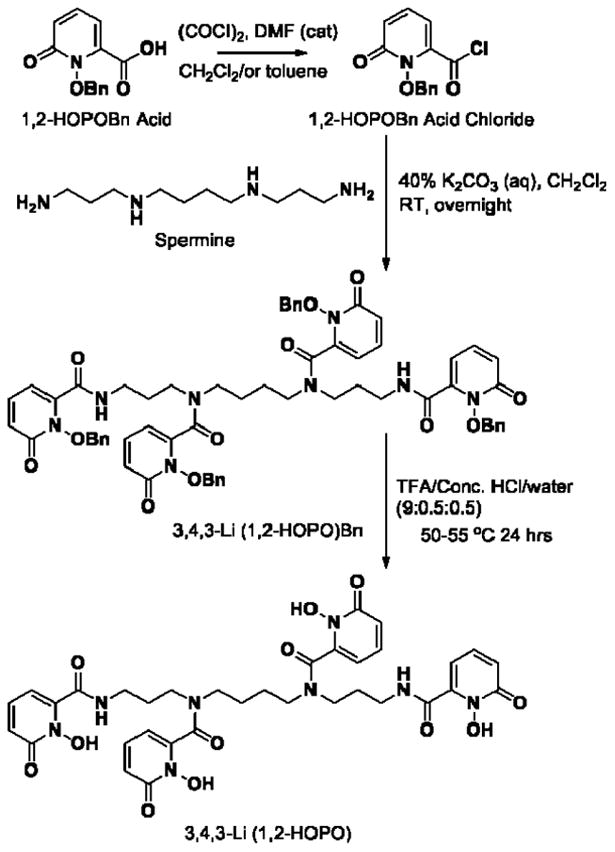
Synthetic scheme for the preparation of 3,4,3-LI(1,2-HOPO) using 1,2-HOPOBn acid and spermine as precursors, resulting in a protonated parent ion (C34H39N8O12+) at 751.2710 m/z.
It is very common that impurities arise from the synthetic process itself, yielding molecular structures similar to that of the synthesized drug. In addition, for 3,4,3-LI(1,2-HOPO), a highly efficient metal scavenger, it is also expected that impurities may be formed after chelation of, or reaction with, trace metal ions present in the vessels used throughout the synthesis. In both cases, the structural resemblance between the parent compound and the unknown impurities may result in similar solution behaviors and spectroscopic signatures that make the separation and characterization processes difficult. Liquid Chromatography (LC) in combination with Mass Spectrometry (MS) is one of the most efficient techniques for accurate characterization, structural elucidation, and determination of unknown trace impurities in bulk drug substance batches [19, 20]. The use of liquid chromatography coupled with tandem mass spectrometry (MS/MS) for the characterization of impurities and degradation products has been thoroughly reviewed recently [17,19, 20], highlighting the high sensitivity and specificity of this technique. Moreover, using soft ionization MS methods, such as Electrospray (ESI) or Atmospheric Pressure Chemical Ionization (APCI), molecular mass and information about fragments can be acquired [21-24], facilitating the identification of impurities and degradation products.
In the work described herein, identification of unknown trace-level impurities in large-scale batches of the ligand 3,4,3-LI(1,2-HOPO) was performed via LC-MS/MS analysis. Threshold qualification was done based on the respective drug and impurity intensities in the UV-Visible output of the chromatography system, and structural elucidation of the unknown trace impurities was carried out through mass fragmentation. The information gathered from these studies will be instrumental in providing a detailed chemistry and manufacturing controls package for the future regulatory review and approval of 3,4,3-LI(1,2-HOPO) as a clinical decorporation agent.
2. Materials and methods
2.1. Materials and reagents
All chemicals were obtained from commercial suppliers and used as received. The ligand 3,4,3-LI(1,2-HOPO) was prepared by Ash Stevens, Inc. (Detroit, MI, USA, Lot ML-11-276), following described synthetic procedures adapted for large-scale production [3, 8, 9, 11, 12]. Acetonitrile (HPLC grade), formic acid (LCMS grade), and standardized NaOH (1.0 M, HPCE grade) were purchased from EMD Millipore (Billerica, MA, USA), Fisher Scientific (Pittsburgh, PA, USA), and Sigma-Aldrich (St.Louis, MO, USA), respectively. The lock-spray analyte leucin enkephalin was obtained from Waters Corporation (Milford, MA, USA). A Milli-Q Advantage A10 Water System Production unit from EMD Millipore (Billerica, MA, USA) was used to purify deionized water.
2.2. Experimental design
Sample solutions were prepared by dissolving 3,4,3-LI(1,2-HOPO) (samples weighed on an analytical balance accurate to 0.05 mg) in 1 ml aliquots of the diluent water-acetonitrile (9:1, v/v) to reach a final concentration of 1 mg/ml (corresponding to 1.3 mM). LC analyses were performed on an analytical ACQUITY LC (Waters Corporation, Milford, MA, USA) equipped with a binary pump and PDA detector. The sample manager module injection valve was fitted with a standard 10 μl sample loop. Chromatographic separation was achieved on an analytical Eclipse XDB-C18 column (Agilent, Santa Clara, CA, USA; 5 μm, 4.6 × 150 mm) maintained at 25°C with two 0.05% formic acid mobile phases [(A) in acetonitrile-water (5:95, v/v) and (B) in acetonitrile]. These mobile phases were chosen to leverage the water-solubility of the studied compound and the enhanced mass spectral ionization properties of acetonitrile in the nozzle-skimmer region. In addition, formic acid increases the formation of protonated ions and allows higher sensitivity. Samples were eluted using a gradient from 0% B to 40% B over 30 min. The flow rate was maintained at 1.0 ml/min. The UV-Visible absorbance of the effluent was constantly monitored over the 200-400 nm range (1.2 nm resolution, 20 points/s).
2.3. Mass spectrometry
Mass spectrometry analysis was performed using an ESI-MS/MS XEVO G2 QTOF system (Waters Technologies, Milford, MA, USA) equipped with an electrospray ionization source operating in positive ion mode. The ESI source held a second electrospray ionization set up for simultaneous injection of the lock-spray resulting in high mass precision measurements. Data acquisition and instrument control were accomplished using the MassLynx software version 4.1. Samples were infused into the ionization chamber from the LC system. The operating parameters were as follows: the nebulization gas flow rate was set to 600 L/h with a desolvation temperature of 375°C, the cone gas flow rate was set to 15 L/h, and the ion source temperature was 100°C. The capillary voltage, sample cone voltage, and extraction cone voltage were tuned from 2.0 to 5.0 kV, 15 to 100 V, and 1.0 to 5.0 V, respectively (adjusted with the targeted analyte). The Q-TOF acquisition rate was 5 s with a 14 ms inter-scan delay. Liquid nitrogen served as nebulizer and argon was used as collision gas with collision energies up to 50 eV. A calibration check of the instrument was performed daily with 0.5 mM sodium formate, prior to sample analysis. To recalibrate the instrument, a fresh 0.5 mM sodium formate solution in 2-propanol-water (9:1, v/v) was prepared according to vendor procedures. The sample cone, extraction, and capillary voltages were adjusted to 36 V, 2.5 V and 2.5 kV, respectively. The collision energy was fixed to 22 eV. The recorded mass range was 50-1200 m/z and the calibration mass range was 91.096-1178.117 m/z. The acquired spectra were compared and automatically adjusted to an internal stored reference spectrum (90.9771: 60%, 158.9646: 75%, 226.9520: 100%, 294.9394: 10%, 362.9268: 25%, 430.9143: 40%, 498.9017: 20%, 566.8891: 20%, 634.8765: 20%, 702.8639: 20%, 770.8514: 20%, 838.8388: 15%, 906.8262: 15%, 974.8136: 15%, 1042.8011: 15%, 1110.7885: 10%, 1178.775947: 10%).
The lock-spray was used to prevent mass shifting over the period of measurements and to correct the acquired spectra. The lock-spray analyte was a 0.1% formic acid solution of 2 ng/μl leucin enkephalin (556.2771 m/z [M+H]+) in acetonitrile-water (1:1, v/v) prepared according to vendor procedures. Leucin enkephalin was used as an internal standard in the optimization of the mass spectrometers for LCMS experiments. The instrument was tuned using the standard solution to provide a minimum mass accuracy or resolving power of 22,500 FWHM resolution (full width at half-maximum, m/z 556.2771 [M+H]+ in ESI (+) mode). This solution was used as a lock mass to correct small mass drifts during multiple measurements. During LC acquisitions the lock-spray solution was injected every 30 s for a scan time of 0.1 s, with a flow rate of 10 μl/min. The capillary voltage was set to 3.0 kV and the collision energy to 15 eV.
Tandem mass spectra were obtained by applying the “Nozzle Skimmer Fragmentation” (NSF) method, which refers to the purposeful induction of in-source fragmentation of the parent ion through nozzle-skimmer potential increase [25-30]. In-source fragmentation was used in addition to tandem mass spectrometry (with post-source fragmentation) to allow for two steps of fragmentation in a pseudo MS3 experimental mode. Mass spectra were obtained through the combination of NSF and collision-induced fragmentation (CID) by Argon gas (collision gas) after isolation of precursor ions and optimization of the collision energy in the 15-100 eV range to maximize the ion current in the ion track.
2.4. Software and computation
MassLynx, MassFragmenter, and Elemental Composition Software (ECS) were purchased from Waters Technologies (Milford, MA, USA) and theoretical isotopic patterns were calculated using ECS, Launchpad (Kompact version 2.9.3, 2011) from Kratos Analytical Ltd (Manchester, UK), as well as the freeware Molecular Fragment Calculator (MFC), version 1.0 (James E. Deline, 1995).
3. Results and discussion
The large-scale preparation of the octadentate spermine-based hydroxypyridinonate ligand 3,4,3-LI(1,2-HOPO) followed methods previously described in the literature that were implemented with minimal optimization [3], over three synthetic steps (Figure 1), using the commercially available 1,2-HOPOBn (1, 6-carboxy-1-(benzyl)hydroxy-2-pyridinone) acid and spermine as precursors. The resulting 5-kg lot was used for the characterization of the active pharmaceutical ingredient (API), preliminary API stability studies, as well as the work described here to identify all detected trace impurities. An efficient softwar-assisted workflow for impurity identification and profiling of 3,4,3-LI(1,2-HOPO) using a single quadrupole time-of-flight (Q-TOF) LC-MS/MS system was carried out. This workflow involved two steps: (i) on-line LC-UV detection, further followed by MS and auto/or direct infusion MS/MS analysis; (ii) identification and structure elucidation of impurities using advanced mass fragmentation tools, qualitative analysis data processing algorithms, and isotopic modeling software. The effective use of this workflow for impurity profiling was demonstrated by the rapid identification and structural elucidation of eight major and seven minor impurities present in the studied 3,4,3-LI(1,2-HOPO) lot, the threshold between minor and major impurities been set at 0.1%.
3.1. Detection of target compound and impurities after LC separation
3.1.1 Absorption spectroscopy
A typical LC-UV chromatogram of 3,4,3-LI(1,2-HOPO) was obtained using the LC method described in Section 2.3. The analysis revealed the presence of fifteen impurities at the relative retention times (Rel. Rt) of 0.53, 0.86, 0.90, 1.06, 1.13, 1.20, 1.32, 1.34, 1.40, 1.55, 1.72, 1.88, 2.37, 2.54, and 2.89, with respect to the main API peak retention time Rt (9.09 min, Table 1). The respective fifteen target impurities under study were denominated by capitals letters A through O by order of appearance in the LC chromatogram, with eight major impurities detected over 0.1% threshold (A, B, E, G, H, J, K, and M) and seven minor impurities (C, D, F, I, L, N, and O). Both LC chromatograms including UV and Base Peak Ion (BPI) detection are shown in Figure 2, panels (A) and (B).
Table 1.
Characterization summary for impurities identified in 3,4,3LI-(1,2-HOPO) large-scale synthetic batch.
| Identity | Rel. RTa | % Areab | Compositionc | Measured m/zc | Calculated m/zc | Δm (ppm) | MS/MS fragment ions (MSn parameters)d |
|---|---|---|---|---|---|---|---|
| [API-H] | 1 | 98.43 ± 0.03 | C34H39N8O12+ | 751.2759 | 751.2687 | -10 | 614.3, 597.2, 403.2, 209.1, 195.1, 179.1, 167.0 (2 kV, 15 V, 3.0 V, 35 eV, 4.7 LM)e |
| A | 0.53 | 0.10 ± 0.01 | C28H36N7O9+ | 614.2081 | 614.2574 | 80 | 597.2, 580.2, 420.2, 403.1, 264.1, 209.1, 195.1, 179.1, 167.0, 110.1, 84.1 (5 kV, 45 V, 5.0 V, 33 eV, 22 LM)e |
| B | 0.86 | 0.20 ± 0.02 | C25H29N6O9+ | 557.1539 | 557.1996 | 82 | 420.2, 403.1, 349.1, 264.1, 209.1, 195.1, 179.1, 167.0, 138.0, 110.1, 84.1 (2 kV, 100 V, 2.5 V, 33 eV, 22 LM)f |
| C | 0.90 | 0.03 ± 0.01 | C28H33N7O9Fe+ | 667.1171 | 667.1689 | 77 | 640.1, 614.1, 547.1, 531.1. 503.1, 486.1, 442.1, 403.1, 369.1, 349.0, 319.1, 292.1, 266.1, 250.1, 248.1, 209.0, 195.0, 179.0, 167.0, 155.1, 110.1 (4 kV, 55 V, 4.0 V, 36 eV, 4.7 LM)e |
| D | 1.06 | 0.03 ± 0.01 | C34H39N8O11+ | 735.2152 | 735.2738 | 79 | 701.1, 598.1, 581.1, 563.1, 541.1, 525.1, 458.1, 442.1, 426.1, 403.1, 387.1, 369.1, 349.1, 333.0, 266.1, 248.1, 209.0, 195.0, 179.0, 167.0, 151.0, 110.1, 84.1 (3.5 kV, 45 V, 4.0 V, 36 eV, 25 LM)e |
| E | 1.13 | 0.08 ± 0.02 | C30H38N7O11+ | 672.2061 | 672.2629 | 84 | 640.2, 614.2, 597.2, 557.2, 535.2, 403.1, 349.1, 292.1, 195.1, 179.1, 110.1 (4 kV, 45 V, 1.0 V, 27 eV, 4.7 LM)e |
| F | 1.20 | 0.04 ± 0.02 | C34H38N8O11Cl+ | 769.1680 | 769.2349 | 87 | 632.2, 615.2, 597.2, 421.1, 403.2, 367.1, 350.1, 349.1, 213.0, 195.1, 179.1, 167.0, (2 kV, 15 V, 3.0 V, 25-50 eV - ramp, 4.7 LM)e |
| G | 1.32 | 0.16 ± 0.02 | C34H37N8Na2O12+ | 795.1210 | 795.2326 | 140 | 781.1, 735.1, 658.1, 614.1, 598.1, 403.1, 266.1, 209.1, 195.0, 179.0, 167.0, 110.1 (2 kV, 95 V, 3.0 V, 34 eV, 4.9 LM)f |
| H | 1.34 | 0.31 ± 0.01 | C34H38N8O11Cl+ | 769.1680 | 769.2349 | 87 | 632.2, 614.2, 597.2, 575.2, 557.2, 487.6, 421.1, 403.1, 367.1, 349.1, 292.1, 284.1, 266.1, 213.0, 195.0, 179.1, 167.0 (2 kV, 95 V, 3.0 V, 34 eV, 4.9 LM)f |
| I | 1.40 | 0.05 ± 0.02 | C32H40N7O12+ | 714.2157 | 714.2735 | 81 | 640.3, 579.2, 560.3, 504.2, 403.2, 382.2, 366.2, 266.2, 248.1, 195.1, 179.1, 167.0, 128.8 (3 kV, 45 V, 4.0 V, 30 eV, 18 LM)e |
| J | 1.55 | 0.25 ± 0.03 | C34H36N8O12Fe+ | 804.1772 | 804.1803 | 4 | 667.2, 650.2, 610.1, 596.1, 402.0, 266.1, 195.1, 179.1, 167.1 (2 kV, 80 V, 3.0 V, 28 eV, 9.9 LM)f |
| K | 1.72 | 0.15 ± 0.04 | C41H45N8O12+ | 841.3124 | 841.3157 | 4 | 807.2, 704.2, 687.1, 647.3, 614.1, 597.1, 493.1, 403.1, 349.1, 299.1, 285.1, 266.1, 195.0, 179.0, 167.0, 110.1 (3 kV, 25 V, 4.0 V, 36 eV, 25 LM)e |
| L | 1.88 | 0.02 ± 0.01 | C34H35ClFeN8O11+ | 822.1500 | 822.1464 | -4.3 | 805.1, 789.1, 773.1, 751.1, 735.1, 636.1, 614.1, 597.1, 557.1, 442.1, 403.1, 385.1, 349.0. 266.1, 195.0, 179.0, 167.0 (3 kV, 15 V, 4.0 V, 36 eV, 4.7 LM)e |
| M | 2.37 | 0.06 ± 0.04 | C41H42FeN8O12+ | 894.2275 | 894.2272 | -0.4 | 801.0, 757.4, 740.3, 700.3, 667.3, 650.3, 610.2, 559.1, 419.4, 285.2, 259.7, 195.1, 110.2 (4 kV, 25 V, 4.0 V, 39 eV, 4.7 LM)e |
| N | 2.54 | 0.02 ± 0.01 | C41H42FeN8O12+ | 894.2275 | 894.2272 | -0.4 | 869.4, 828.4, 757.2, 740.2, 700.2, 667.2, 650.2, 605.9, 585.7, 560.4, 546.1, 418.4, 285.1, 195.1, 110.5 (2 kV, 15 V, 3.0 V, 25-50 eV – ramp, 4.7 LM)e |
| O | 2.89 | 0.07 ± 0.01 | C34H34Cl2FeN8O10+ | 840.1139 | 840.1125 | -1.66 | 822.1, 800.1, 705.1, 646.0, 623.9, 615.4, 572.0, 430.2, 271.2, 211.5, 261.0, 211.5, 178.0, 110.5 (2 kV, 15 V, 3.0 V, 15 eV, 4.7 LM)e |
Relative retention time with respect to the main API peak (Rt of 9.09 min).
%Area based on LC UV-Visible chromatogram.
Composition and mass parameters are given for the charged molecular ion peaks detected by TOF-MS/MS analysis.
Tunable MS3 parameters include: capillary voltage (kV), sample cone voltage (V), extraction cone voltage (V), collision energy (eV), and resolution (LM).
Denotes MS2 analysis;
Denotes pseudo MS3 analysis.
Figure 2.

(A) Magnified Base Peak Ion (BPI) Chromatogram, (B) magnified UV chromatogram (Inlet: full scale UV chromatogram), (C) Time of Flight Mass Spectrum (TOF-MS, 751.3 m/z), (D) TOF-MS/MS analysis (751.3 m/z), and (E) TOF MS3 spectrum (614.3 m/z peak from TOF-MS/MS analysis of 751.3 m/z), and (F) fragmentation patterns for 3,4,3-LI(1,2-HOPO).
3.1.2 Mass spectrometry
The LC method used to detect impurities was also coupled with mass spectrometry, as detailed in the experimental section. The mass spectrum of 3,4,3-LI(1,2-HOPO) showed a protonated molecular ion peak ([M+H]+) at m/z 751.2710 with the corresponding molecular formula C34H39N8O12+. Mass spectra were also extracted for all impurities, as listed in Table 1. A characterization summary for all impurities, including respective Rel. Rt values, m/z values, and MS/MS fragments is provided in Table 1. Further MS/MS analysis via direct infusion of sample was required to elucidate the structure of these major impurities, as described below.
3.2. TOF-MS/MS analysis and pseudo MS3 characterization of 3,4,3-LI(1,2-HOPO)
The fragmentation pathway of 3,4,3-LI(1,2-HOPO) was established by carrying out TOF-MS/MS and pseudo MS3 studies in positive-ion ESI mode. Usually a single quadrupole TOF mass spectrometer is not sufficient for MS3 (or above: MSn) analysis. However, in-source or Nozzle Skimmer MS fragmentation was used in this work by increasing the cone voltage to carry out further MS3 analysis of product ions obtained in MS2 analysis. Such fragmentation method is described in the literature [27, 31-33] and is commonly known as “pseudo MS3 analysis”. Tandem MS/MS and pseudo MS3 analyses were carried out using direct infusion of sample into the mass spectral ionization chamber.
3.2.1 Operating conditions
The typical Q-TOF operating source conditions for MS scanning of 3,4,3-LI(1,2-HOPO) in this ion mode were optimized as follows: 2 kV capillary voltage; 15 V sample cone voltage; 3 V extraction cone voltage; N2 drying gas (375°C, 600 L/min); N2 cone gas (100°C, 15 L/h). The precursor ion of interest was selected (by keeping MS1 static) using the quadrupole analyzer, and the product ions were analyzed using the TOF analyzer. The TOF-MS spectrum of the protonated 3,4,3-LI(1,2-HOPO) species is displayed in Figure 2, panel (C).
3.2.2 Fragmentation pattern of the protonated ligand (MS/MS)
The positive-ion ESI mass spectrum of 3,4,3-LI(1,2-HOPO) shows an abundant [M+H]+ peak at m/z 751.2710. Tandem MS/MS analysis of this peak shows product ions at m/z values of 614.3 (loss of 138 amu), 597.2 (loss of 154 amu, which corresponds to a 6-carboxamide-1-hydroxy-pyridin-2-one fragment), 403.2 (loss of 348 amu, which corresponds to a N,N′-(propane-1,3-diyl)bis(6-carboxamide-1-hydroxy-pyridin-2-one) fragment), 349 (loss of 402 amu), 266 (loss of 485 amu), 209.1 (loss of 542 amu), 195.1 (loss of 556 amu), 179.1 (loss of 572 amu), and 167.0 (loss of 584 amu). This fragmentation pattern was confirmed by pseudo MS3 experiments and accurate mass measurements. The ESI TOF-MS/MS spectrum of the protonated 3,4,3-LI(1,2-HOPO) species is shown in Figure 2, panel (D); the pseudo MS3 spectrum of 614.3 m/z obtained from ESI TOF MS/MS analysis of 751.3 m/z is shown in Figure 2, panel (E); the proposed fragmentation mechanism of 3,4,3-LI(1,2-HOPO) is depicted in Figure 2, panel (F).
3.3. Impurity identification through TOF-MS/MS analysis and pseudo MS3 characterization
TOF-MS/MS analysis as well as pseudo MS3 characterization of the fifteen impurities observed in both LC-UV and LC-MS chromatograms were carried out to elucidate their respective structures. Tandem MS/MS analysis of the impurity ion peaks was performed and in all cases several dissociation products were observed, as reported in Table 1. Pseudo MS3 analysis was carried out for all product ions (or fragments) derived from the selected impurity peaks. MS tune file parameters are reported in Table 1 for each impurity.
3.3.1 Identification of Major Impurities (>0.1%)
The MS/MS fragmentation patterns and pseudo MS3 analyses for major impurities are depicted in Figure 3 and reported in Table 1, with respective m/z values for the parent and fragmentation ions.
Figure 3.

MS/MS analysis of major impurities (A) 614.3, (B) 557.2, (E) 672.2, (G) 795.1, (H) 769.2, (J) 804.2, (K) 841.2, and (M) 894.2 m/z. Mass spectra were normalized towards the main fragment peak at m/z 195.0 and intensities were magnified up to 10-times for better visualization of fragment ions.
The ESI-MS/MS spectrum of Impurity A observed at 4.85 min (Rel. Rt = 0.53) showed a molecular ion peak at m/z 614.2081. That same peak had been observed in the MS/MS fragmentation of the API (m/z 751.2710). The fragments observed in the MS/MS mode were identical to those obtained from the molecular ion peak of the parent compound (751.3 m/z). It is evident from the mass spectrum of Impurity A (Figure 3) that formation of the fragment at the m/z value of 195.1 is predominant and stable, which corresponds to the terminal hydroxypyridinone unit linked to an alkyl fragment of the spermine backbone, with a molecular formula of C9H11N2O3+. Fragmentation pattern analysis and isotopic modeling confirmed the molecular formula of Impurity A as C28H36N7O9+, with the structure corresponding to a partially reacted product missing a terminal hydroxypyridinone unit, as shown in Figure 4. Formation of this trace impurity must have occurred during the coupling of the benzyl-protected metal-binding units to the spermine scaffold.
Figure 4.

Structures of the 15 identified impurities, grouped by functional similarities.
The second major impurity (B) was eluted at 7.91 min (Rel. Rt = 0.86). The ESI MS/MS spectrum of Impurity B revealed a molecular ion peak [M+H]+ of 557.1539 m/z. Most of the fragments were presumed to be identical to the product ion peaks of 3,4,3-LI(1,2-HOPO). These characteristic fragment ions were highly compatible with the structure displayed in Figure 4, with a molecular formula of C25H29N6O9+. This trace impurity most likely originates with the presence of trace amounts of spermidine in the spermine reagent used in the backbone-coupling step of the synthesis.
The ESI-MS/MS spectrum of Impurity E, eluted at 10.36 min (Rel. Rt = 1.13), showed a molecular ion peak [M+H]+ of 672.2061 m/z. Most of the dissociation products were similar to those observed in the fragmentation of the API 3,4,3-LI(1,2-HOPO), including the peaks at 614.3, 597.2, 403.2, 209.1, 195.1, and 179.1. The molecular formula of Impurity E was confirmed as C30H38N7O11+ using accurate mass measurements, with the resulting structure shown in Figure 4. This impurity could also be a side product of the backbone-coupling step, due to the presence of residual amounts of oxalyl chloride with the 1,2-HOPOBn acid chloride.
The ESI-MS/MS spectrum of Impurity G, eluted at 11.97 min (Rel. Rt = 1.32), displayed a molecular ion peak [M+H]+ of 795.1210 m/z. Again, most of the fragments obtained in the pseudo MS3 analysis mode were the same as those resulting from the fragmentation of the main ligand [M+H]+ ion (751.3 m/z), with, the formation of the species at 195.1 m/z corresponding to the most abundant peak in the spectra. Fragments at the m/z values of 781.1, 658.1, and 614.1 are unique to this impurity. While the m/z value 614.1 seems to be similar to the original ligand fragment at m/z of 614.3, the difference Δm/z = 0.2 is significant and is consistent with a different structure containing two Na ions (Figure 4). The presence of Na in this impurity was confirmed by elemental composition analysis, consistent with a molecular formula of C34H37N8Na2O12+. The acidity of the two first pKa values of 3,4,3-LI(1,2-HOPO) (3.87 and 5.01 [34]) make it an excellent chelator for hard Lewis acids such as the actinide cations, but also a good scavengers for common ions such as Na+. Under the purification and analysis conditions described here, the formation of sodium adducts is therefore not surprising. The four pKa values of 3,4,3-LI(1,2-HOPO) have never been specifically assigned to each of the four hydroxyl groups of the 1,2-HOPO rings. Such assignment could be performed through 1H nuclear magnetic resonance titrations and may provide indications as to which 1,2-HOPO units bear the sodium ions. However, ion pair formation and exchange between the different 1,2-HOPO) units may also occur in solutions such as those prepared for LC analysis. Hence, the positions of the two sodium ions were assigned arbitrarily on the structure shown in Figure 4.
The ESI-pseudo MS3 spectrum of Impurity H, observed at 12.23 min (Rel. Rt = 1.34), displayed a molecular ion peak [M+H]+ of 769.1680 m/z. Peak isotopic distribution revealed the presence of Cl on a pyridinone ring in this impurity, consistent with a molecular formula of C34H38N8O11Cl+. The experimental and theoretical mass spectra of the formula C34H38N8O11Cl+ are in excellent agreement, as evidenced in Figure 5, panels (A) and (B). The proposed structure for this impurity is shown in Figure 4. The chlorination of the hydroxypyridinone ring may be the result of the presence of residual amounts of oxalyl chloride after the preparation of the binding unit precursor 1,2-HOPOBn acid chloride [35]. In addition, the presence of a large fragment at 213.0 m/z and that of another at 614.2 m/z allow the positioning of the chlorinated ring as one of the terminal 1,2-HOPO units, as depicted in Figure 4.
Figure 5.

Example of (A) an experimental mass spectrum showing the detection of C34H38N8O11Cl (m/z 769.2) and (B) its isotopic model, both corresponding to major impurity H.
The ESI-pseudo MS3 spectrum of Impurity J, detected at 14.09 min (Rel. Rt = 1.55), displayed a molecular ion peak [M+H]+ of 804.1772 m/z. Peaks at m/z values of 650.1 and 667.2 are unique to Impurity J. The isotopic distribution of the species at 804.2 m/z is characteristic of the formation of a complex with Fe, which is not surprising considering the extremely high affinity of hydroxypyridinonate chelating agents for Fe(III) [9]. The elemental composition of Impurity J and its fragment ions was confirmed by accurate mass measurements, compatible with the molecular formula C34H36N8O12Fe+, a ferric complex, in which one Fe3+ metal center is bound through four metal-oxygen bounds to two deprotonated 1,2-HOPO binding units. Because of a slightly higher proximity between terminal and central 1,2-HOPO units (three carbons on the alkyl linker), as compared to the distance between the two central units (four carbons on the alkyl linker), a mono-ferric complex is expected to form progressively and preferentially through a terminal 1,2-HPO and a central 1,2-HOPO, resulting in the structure shown in Figure 4.
Figure 3 shows the ESI-MS/MS spectrum of Impurity K, eluted at 15.62 min (Rel. Rt = 1.72), with a molecular ion peak [M+H]+ of 841.3124 m/z. The molecular formula of Impurity K was confirmed as C41H45N8′O12+ using accurate mass measurements, with the resulting structure shown in Figure 4. In this impurity, one of the four hydroxypyridinone units remains protected with a benzyl group and is the result of an incomplete last deprotection synthetic step. In addition, the presence of a large fragment at 285.1 m/z and that of another fragment at 614.1 allow the positioning of the protected ring as one of the terminal 1,2-HOPO units, as depicted in Figure 4.
Figure 3 shows the ESI-MS/MS spectrum of Impurity M, detected at 21.56 min (Rel. Rt = 2.37), with a molecular ion peak [M+H]+ of 894.2275 m/z. The characteristic isotopic distribution of the m/z 894.2 species demonstrated the presence of iron, similarly to Impurity J. The elemental composition of Impurity M and those of its fragments were confirmed by accurate mass measurements, providing the molecular formula C41H42FeN8O12+. This ferric complex is formed similarly to Impurity J with one ferric ion coordinated to two 1,2-HOPO units. However, the complex is formed with a mono-benzyl protected species (Impurity K) as the ligand instead of the fully deprotected 3,4,3-LI(1,2-HOPO).
3.3.2 Identification of Minor Impurities (<0.1%)
The MS/MS fragmentation patterns and pseudo-MS3 analyses for minor impurities are depicted in Figure 6 and reported in Table 1 with respective m/z values for the parent and fragmentation ions.
Figure 6.

MS/MS analysis of minor impurities (C) 667.2, (D) 735.2, (F) 769.2, (I) 714.2, (L) 822.1, (N) 894.2, and (O) 840.1 m/z. Mass spectra were normalized towards the main fragment peak at m/z 195.0 and intensities were magnified up to 10-times for better visualization of fragment ions.
The ESI-MS/MS spectrum of Impurity C, observed at 8.16 min (Rel. Rt = 0.90), showed a molecular ion peak at m/z 667.1171. Most fragments observed in the MS/MS mode were identical to those obtained from the molecular ion peak of the parent compound (751.3 m/z) and of major impurity A (614.3 m/z), however, few other fragments (250.1, 292.1, 503.1, 486.1, 531.1 and 547.1) were also detected (Figure 6). Fragmentation pattern analysis and isotopic modeling confirmed the molecular formula of Impurity C as C28H33N7O9Fe+, with the structure corresponding to the iron complex of Impurity A, as shown in Figure 4.
The ESI-MS/MS spectrum of Impurity D, detected at 9.60 min (Rel. Rt = 1.06), displayed a molecular ion peak [M+H]+ of 735.2152 m/z. Peaks at m/z values of 701.1, 598.1, 581.1, 563.1, 541.1, 525.1, and 458.1 are unique to this impurity. The elemental composition of Impurity D and its fragment ions was confirmed by accurate mass measurements, compatible with the molecular formula C34H39N8O11+ and a structure in which one of the 1,2-HOPO unit of the parent ligand is dehydroxylated. In addition, the presence of large fragments at 179.0 and 598.1 m/z allows the positioning of the dehydroxylated ring as one of the terminal 1,2-HOPO units, as depicted in Figure 4. Formation of this impurity most likely occurred during the final deprotection step.
The ESI-MS/MS spectrum of Impurity F, observed at 10.96 min (Rel. Rt = 1.20), displayed a molecular ion peak [M+H]+ of 769.1680 m/z, with abundant product ions similar to those found for Impurity H. Fragmentation pattern analysis and isotopic modeling confirmed the molecular formula of Impurity F as C34H38N8O11Cl+, indicating a structure isobaric with that of Impurity H, despite a different elution time. Impurities H and F are therefore structural isomers with a different positioning of the chlorinated hydropyridinone ring on the spermine skeleton. The presence of a peak at 367.1 m/z in the fragmentation pattern of impurity F indicates that the chlorinated ring is linked to one of the secondary central amines (Figure 4).
The ESI-MS/MS spectrum of Impurity I, eluted at 12.65 min (Rel. Rt = 1.40), showed a molecular ion peak [M+H]+ of 714.2157 m/z. Most of the dissociation products were similar to those observed in the fragmentation of all impurities in which one 1,2-HOPO ring is missing or degraded, including the peaks at 640.3, 560.3, 403.2, 266.2, 195.1, and 179.1. The molecular formula of Impurity I was confirmed as C32H40N7O12+ using accurate mass measurements, with the resulting structure shown in Figure 4. This impurity could be a side product of the backbone-coupling step, due to the presence of residual amounts of dimethylformamide with the deprotected 1,2-HOPO terminal moiety.
Figure 6 shows the ESI-MS/MS spectrum of Impurity L, detected at 16.97 min (Rel. Rt = 1.88), with a molecular ion peak [M+H]+ of 822.1500 m/z. The characteristic isotopic distribution of the m/z 822.2 species demonstrated the presence of iron and chlorine. The elemental composition of Impurity L and those of its fragments were confirmed by accurate mass measurements, providing the molecular formula C34H35ClFeN8O11+. This ferric complex is formed similarly to Impurities J and M with one ferric ion coordinated to two 1,2-HOPO units. However, the complex is formed with a chlorinated species (major impurity H based on the presence of the fragment at 614.1 m/z) as the ligand instead of the intact 3,4,3-LI(1,2-HOPO) (Figure 4).
The ESI-MS/MS spectrum of Impurity N, observed at 22.91 min (Rel. Rt = 2.54), displayed a molecular ion peak [M+H]+ of 894.2275 m/z, with abundant product ions (Table 1 and Figure 6). Fragmentation pattern analysis and isotopic modeling confirmed the molecular formula of Impurity N as C41H42FeN8O12+, indicating a structure isobaric with that of Impurity M, despite a different elution time. Impurities N and M are therefore structural isomers of the ferric complex formed with a mono-benzyl protected 3,4,3-LI(1,2-HOPO), as shown in Figure 4.
Figure 6 shows the ESI-MS/MS spectrum of Impurity O, detected at 26.05 min (Rel. Rt = 2.89), with a molecular ion peak [M+H]+ of 840.1139 m/z, and abundant product ions at the m/z values reported in Table 1. Predominant peaks included those at m/z 285.2, 195.1, 179.1, and 167.1. The characteristic isotopic distribution of the main species demonstrated the presence of iron and chlorine. The elemental composition of Impurity O and those of its fragments were confirmed by accurate mass measurements, providing the molecular formula C34H34Cl2FeN8O10+. This ferric complex is formed similarly to other Fe-containing impurities, with one ferric ion coordinated to two 1,2-HOPO units. However, the complex is formed with a species in which two hydroxypyridinone rings are chlorinated as the ligand, instead of the intact 3,4,3-LI(1,2-HOPO). This is the only impurity for which the peak at 195.1 m/z is absent from the fragmentation pattern, which is indicative of a lack of intact terminal 1,2-HOPO unit. Therefore the two chlorine atoms were assigned to each of the external hydroxypyridinone rings, as displayed in Figure 4.
Conclusions
Impurity profiling of the 3,4,3-LI(1,2-HOPO) ligand was carried out according to ICH guidelines. The liquid chromatography method described in the present study allows the separation of all the impurities present in the available 3,4,3-LI(1,2-HOPO) commercial batch. A total of fifteen (eight major and seven minor) impurities were detected and their structure elucidation was performed using quadrupole time of flight mass spectrometry, via MS/MS and pseudo MS3 experiments combined with accurate mass measurements of fragment ions and precursors. The impurity determination method described here is a simple, sensitive, rapid and powerful approach for the identification of unknown compounds. In addition, it can be used to identify trace amounts of various metabolites and can be potentially used to analyze the impurities and degradation products in more complex systems.
Highlights.
A LC-ESI TOFMS method was developed and used for the impurity control of 3,4,3-LI(1,2-HOPO).
The most recent commercial batch used in most pre-clinical studies was examined.
A complete overview of all relevant impurities is provided.
Acknowledgments
This work was supported by the National Institutes of Health / National Institute of Allergy and Infectious Diseases Medical Countermeasures Against Radiological Threats (MCART) Consortium (Contract #HHSN272201000046C to the University of Maryland School of Medicine), through the U.S. Department of Energy under Contract #DE-AC02-05CH11231.
Footnotes
Publisher's Disclaimer: This is a PDF file of an unedited manuscript that has been accepted for publication. As a service to our customers we are providing this early version of the manuscript. The manuscript will undergo copyediting, typesetting, and review of the resulting proof before it is published in its final citable form. Please note that during the production process errors may be discovered which could affect the content, and all legal disclaimers that apply to the journal pertain.
References
- 1.Cassatt DR, et al. Medical Countermeasures against Nuclear Threats: Radionuclide Decorporation Agents. Rad Res. 2008;170:540–548. doi: 10.1667/rr1485.1. [DOI] [PMC free article] [PubMed] [Google Scholar]
- 2.Durbin PW. Lauriston S. Taylor Lecture: the quest for therapeutic actinide chelators. Health Phys. 2008;95(5):465–492. doi: 10.1097/01.HP.0000326345.41816.c2. [DOI] [PubMed] [Google Scholar]
- 3.Abergel RJ, et al. Biomimetic Actinide Chelators: An Update on the Preclinical Development of the Orally Active Hydroxypyridonate Decorporation Agents 3,4,3-Li(1,2-Hopo) and 5-Lio(Me-3,2-Hopo) Health Phys. 2010;99(3):401–407. doi: 10.1097/HP.0b013e3181c21273. [DOI] [PMC free article] [PubMed] [Google Scholar]
- 4.Bunin DI, et al. Efficacy and Safety Toxicology of Hydroxypyridinonate Actinide Decorporation Agents in Rodents: Towards a Safe and Effective Human Dosing Regimen. Rad Res. 2013;179:171–182. doi: 10.1667/RR3115.1. [DOI] [PMC free article] [PubMed] [Google Scholar]
- 5.Chang PY, et al. Analytical Methods for the Bioavailability Evaluation of Hydroxypyridinonate Actinide Decorporation Agents in Pre-Clinical Pharmacokinetic Studies. J Chromatograph Separat Techniq. 2012;S4 [Google Scholar]
- 6.Jarvis EE, et al. Significance of Single Variables in Defining Adequate Animal Models to Assess the Efficacy of New Radionuclide Decorporation Agents: Using the Contamination Dose as an Example. Drug Dev Res. 2012;73:281–289. [Google Scholar]
- 7.Kullgren B, et al. Actinide Chelation: Biodistribution and In Vivo Complex Stability of the Targeted Metal Ions. Toxicol Mech Methods. 2013;21(1):18–26. doi: 10.3109/15376516.2012.728641. [DOI] [PubMed] [Google Scholar]
- 8.Burgada R, et al. Synthesis of 3,4,3 LI 1,2 HOPO Labelled with 14C. J Labelled Cpd Radiopharm. 2001;44:13–19. [Google Scholar]
- 9.Scarrow RC, et al. Ferric ion sequestering agents. 13. Synthesis, structures, and thermodynamics of complexation of cobalt(III) and iron(III) tris complexes of several chelating hydroxypyridinones. Inorganic Chemistry. 1985;24(6):954–967. [Google Scholar]
- 10.White DL, et al. Specific Sequestering Agents for the Actinides. 16. Synthesis and Initial Biological Testing of Polydentate Oxohydroxypyridinecarboxylate Ligands. J Med Chem. 1988;31:11–18. doi: 10.1021/jm00396a005. [DOI] [PubMed] [Google Scholar]
- 11.Xu J, et al. Gadolinium Complex of Tris[(3-hydroxy-1-methyl-2-oxo-1,2-didehydropyridine-4-carboxamido)ethyl]-amine: A New Class of Gadolinium Magnetic Resonance Relaxation Agents. J Am Chem Soc. 1995;117:7245–7246. [Google Scholar]
- 12.Xu J, et al. Specific Sequestering Agents for the Actinides. 28. Synthesis and Initial Evaluation of Multidentate 4-Carbamoyl-3-hydroxy-1-methyl-2(1H)-pyridinone Ligands for in Vivo Plutonium(IV) Chelation. J Med Chem. 1995;38:2606–2614. doi: 10.1021/jm00014a013. [DOI] [PubMed] [Google Scholar]
- U.S. Food and Drug Administration. Guidance for Industry Internal Radioactive Contamination - Development of Decorporation Agents. 2006 [Google Scholar]
- U.S. Food and Drug Administration. Approval of New Drugs When Human Efficacy Studies Are Not Ethical or Feasible. U.S. FDA; Washington, DC: 2010. [Google Scholar]
- 15.Ermer J, Vogel M. Applications of hyphenated LC-MS techniques in pharmaceutical analysis. Biomedical Chromatography. 2000;14(6):373–383. doi: 10.1002/1099-0801(200010)14:6<373::AID-BMC29>3.0.CO;2-S. [DOI] [PubMed] [Google Scholar]
- 16.Pan C, Guan J, Lin M. A multidisciplinary approach to identify a degradation product in a pharmaceutical dosage form. J Pharm Biomed Anal. 2011;54(4):855–9. doi: 10.1016/j.jpba.2010.10.016. [DOI] [PubMed] [Google Scholar]
- 17.Basniwal PK, Jain D. Simvastatin: Review of Updates on Recent Trends in Pharmacokinetics, Pharmacodynamics, Drug-drug Interaction, Impurities and Analytical Methods. Current Pharmaceutical Analysis. 2012;8(2):135–156. [Google Scholar]
- International Conferences on Harmonization. Draft Revised Guidance on Impurities in New Drug Products. Q3B(R) Federal Register. 2000;65(139):44791–44797. [Google Scholar]
- 19.Narayanam M, et al. Critical practical aspects in the application of liquid chromatography-mass spectrometric studies for the characterization of impurities and degradation products. J Pharm Biomed Anal. 2013 doi: 10.1016/j.jpba.2013.04.027. [DOI] [PubMed] [Google Scholar]
- 20.Singh S, et al. A critical review on the use of modern sophisticated hyphenated tools in the characterization of impurities and degradation products. J Pharm Biomed Anal. 2012;69:148–73. doi: 10.1016/j.jpba.2012.03.044. [DOI] [PubMed] [Google Scholar]
- 21.Dongre VG, et al. Identification and characterization of process related impurities in chloroquine and hydroxychloroquine by LC/IT/MS, LC/TOF/MS and NMR. J Pharm Biomed Anal. 2009;49(4):873–9. doi: 10.1016/j.jpba.2009.01.013. [DOI] [PubMed] [Google Scholar]
- 22.Dongre VG, et al. Isolation and structural identification of an impurity in fluconazole bulk drug substance. J Pharm Biomed Anal. 2007;45(3):422–9. doi: 10.1016/j.jpba.2007.06.029. [DOI] [PubMed] [Google Scholar]
- 23.Dongre VG, et al. Characterization and quantitative determination of impurities in piperaquine phosphate by HPLC and LC/MS/MS. J Pharm Biomed Anal. 2007;43(1):186–95. doi: 10.1016/j.jpba.2006.07.005. [DOI] [PubMed] [Google Scholar]
- 24.Dongre VG, et al. Investigation of amodiaquine bulk drug impurities by liquid chromatography/ion trap mass spectrometry. Rapid Commun Mass Spectrom. 2008;22(14):2227–33. doi: 10.1002/rcm.3605. [DOI] [PubMed] [Google Scholar]
- 25.Hagman C, Tsybin YO, Hakansson P. Solution-phase deuterium/hydrogen exchange at a specific residue using nozzle-skimmer and electron capture dissociation mass spectrometry. Rapid Communications in Mass Spectrometry. 2006;20(4):661–665. doi: 10.1002/rcm.2339. [DOI] [PubMed] [Google Scholar]
- 26.Hakansson K, Zubarev R, Hakansson P. Combination of nozzle-skimmer fragmentation and partial acid hydrolysis in electrospray ionization time-of-flight mass spectrometry of synthetic peptides. Rapid Communications in Mass Spectrometry. 1998;12(11):705–711. doi: 10.1002/(SICI)1097-0231(19980615)12:11<705::AID-RCM212>3.0.CO;2-3. [DOI] [PubMed] [Google Scholar]
- 27.Marquet P, et al. In-source CID mass spectral libraries for the “general unknown” screening of drugs and toxicants. Analusis. 2000;28(10):925–934A. [Google Scholar]
- 28.Meng ZJ, Limbach PA. Shotgun sequencing small oligonucleotides by nozzle-skimmer dissociation and electrospray ionization mass spectrometry. European Journal of Mass Spectrometry. 2005;11(2):221–229. doi: 10.1255/ejms.736. [DOI] [PubMed] [Google Scholar]
- 29.Smith RD, et al. NEW DEVELOPMENTS IN BIOCHEMICAL MASS-SPECTROMETRY-ELECTROSPRAY IONIZATION. Analytical Chemistry. 1990;62(9):882–899. doi: 10.1021/ac00208a002. [DOI] [PubMed] [Google Scholar]
- 30.Zhai H, et al. Consecutive ion activation for top down mass spectrometry: Improved protein sequencing by nozzle-skimmer dissociation. Analytical Chemistry. 2005;77(18):5777–5784. doi: 10.1021/ac0580215. [DOI] [PubMed] [Google Scholar]
- 31.Abrankó L, García-Reyes JF, Molina-Díaz A. In-source fragmentation and accurate mass analysis of multiclass flavonoid conjugates by electrospray ionization time-of-flight mass spectrometry. Journal of Mass Spectrometry. 2011;46(5):478–488. doi: 10.1002/jms.1914. [DOI] [PubMed] [Google Scholar]
- 32.Pereira CAM, Yariwake JH, McCullagh M. Distinction of the C-glycosylflavone isomer pairs orientin/isoorientin and vitexin/isovitexin using HPLC-MS exact mass measurement and in-source CID. Phytochemical Analysis. 2005;16(5):295–301. doi: 10.1002/pca.820. [DOI] [PubMed] [Google Scholar]
- 33.Chen J, et al. A Pseudo MS3 Approach for Identification of Disulfide-Bonded Proteins: Uncommon Product Ions and Database Search. Journal of The American Society for Mass Spectrometry. 2012;23(2):225–243. doi: 10.1007/s13361-011-0294-6. [DOI] [PubMed] [Google Scholar]
- 34.Abergel RJ, et al. Using the Antenna Effect as a Spectroscopic Tool; Photophysics and Solution Thermodynamics of the Model Luminescent Hydroxypyridonate Complex [EuIII(3,4,3LI(1,2-HOPO))]- Inorg Chem. 2009;48:10868–10870. doi: 10.1021/ic9013703. [DOI] [PMC free article] [PubMed] [Google Scholar]
- 35.Adam FM, et al. Development of a Practical Synthesis of Toll-like Receptor Agonist PF-4171455: 4-Amino-1-benzyl-6-trifluoromethyl-1,3-dinydroimidazo [4,5-c] pyridin-2-one. Organic Process Research & Development. 15(4):788–796. [Google Scholar]