Abstract
The structurally regular and stable self-assembled capsids derived from viruses can be used as scaffolds for the display of multiple copies of cell- and tissue-targeting molecules and therapeutic agents in a convenient and well-defined manner. The human iron-transfer protein transferrin, a high affinity ligand for receptors upregulated in a variety of cancers, has been arrayed on the exterior surface of the protein capsid of bacteriophage Qβ. Selective oxidation of the sialic acid residues on the glycan chains of transferrin was followed by introduction of a terminal alkyne functionality via an oxime linkage. Attachment of the protein to azide-functionalized Qb capsid particles in an orientation allowing access to the receptor binding site was accomplished by the CuI-catalyzed azide-alkyne cycloaddition (CuAAC) click reaction. Transferrin conjugation to Qβ particles allowed specific recognition by transferrin receptors and cellular internalization via clathrin-mediated endocytosis, as determined by fluorescence microscopy on cells expressing GFP-labeled clathrin light chains. By testing Qβ particles bearing different numbers of transferrin molecules, it was demonstrated that cellular uptake was proportional to ligand density, but that internalization was inhibited by equivalent concentrations of free transferrin. These results suggest that cell targeting with transferrin can be improved by local concentration (avidity) effects.
Keywords: virus-like particles, transferrin, receptor-mediated endocytosis, polyvalency, click chemistry
Introduction
Human holo-transferrin (Tfn) is an 80 kDa bi-lobed iron-carrier glycoprotein in vertebrates,[1] which is essential for iron homeostasis.[2] Transferrin is specifically recognized by Tfn receptors (TfnR) overexpressed on the surface of a variety of tumor cells[3] and efficiently taken up by cells in a well-characterized process of clathrin-mediated endocytosis.[4] The Tfn-TfnR interaction has been exploited as a potential pathway for uptake of Tfn-conjugated drugs by targeted cells.[4-5] For example, polyvalent assembly of transferrin on liposomes[6] and gold nanoparticles[7] has been reported previously. In the current study, we wished to explore the mechanisms of interactions of TfnR-bearing cells with Tfn displayed on a uniform protein nanoparticle scaffold on which different densities of Tfn could be displayed.
We have previously described the conjugation of transferrin to cowpea mosaic virus (CPMV) by modification of both proteins with complementary azide and alkyne residues, and their subsequent ligation by the efficient CuI-catalyzed azide-alkyne cycloaddition (CuAAC) “click” reaction.[8] In this study, we used the capsid of bacteriophage Qβ, a virus-like particle (VLP) of 30 nm diameter and icosahedral symmetry, as the scaffold. Qβ consists of 180 copies of a single coat-protein subunit, and, like CPMV,[9] may be chemically addressed by acylation of surface lysine groups.[10] It differs from CPMV in having a higher density of such amine attachment points and an overall smoother structure.
In addition to amine acylation, site-specific modification of proteins such as transferrin is often achieved by selective derivatization of cysteine thiols with maleimide or related electrophilic reagents, or oxidation of N-terminal serine or threonine to corresponding aldehydes and subsequent coupling with alkoxyamines or hydrazine derivatives.[11] A disadvantage of these strategies is the possibility of irreversibly altering the structure or blocking the action of a key region of the protein, such as a catalytic site or binding motif, which may lead to a loss of activity. We describe here the alternative manipulation of transferrin by the derivatization of its sialic acid moieties, thus preserving the protein in its functional form, allowing us to efficiently and controllably graft it to the surface of the VLP scaffold.
Results and Discussion
Preparation and characterization of Qβ-Tfn conjugates
Use of CuAAC chemistry for the attachment of transferrin to Qβ requires the introduction of an azide or alkyne group to each partner. In a previous study, a maleimide-alkyne linker was used to derivatize transferrin at one or more accessible cysteine residues.[8] While the target cysteines are not supposed to be near the site bound by the transferrin receptor, their derivatization introduces uncertainty in the position of the attachment site, and therefore in the orientation of the displayed protein. We turned here to the mild periodate oxidation of the sialic acid residues on transferrin. The main form of the human transferrin displays up to four terminal sialic acids per molecule.[12] De-sialylated transferrin is reported to be internalized by both asialoglycoprotein and transferrin receptors,[12b, 13] and the structure of the Tfn-TfnR interaction shows the glycosylation sites to be on a face of the protein far removed from the receptor-binding site.[14] We therefore anticipated that connections made to derivatized sialic acid should not interfere with receptor-mediated endocytosis.
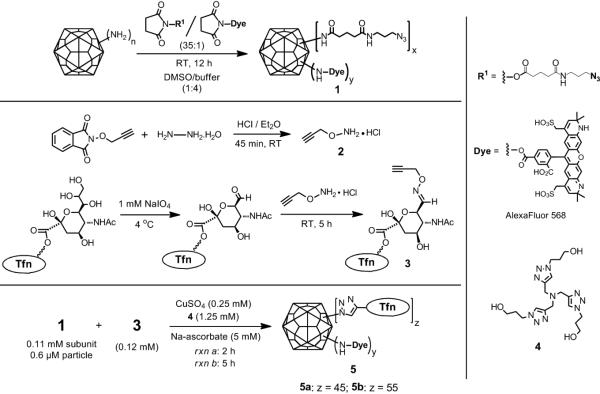
Oxidation of sialic acids on transferrin was followed by attachment of the aminoether linker 2 via the rapid formation of a physiologically-stable oxime linkage,[15] giving the alkynefunctionalized transferrin 3 (Scheme 1). In order to determine the extent of this modification on the transferrin structure, a sample was condensed with azide-derivatized fluorescein by CuAAC reaction using acceleratory ligand 4 under recently-reported optimized conditions.[16] The product was analyzed by SDS-PAGE, verifying covalent attachment of the dye, and by UV-vis spectroscopy and determination of protein concentration by Bradford assay, showing that an average of 3.4 fluorescein molecules were attached per transferrin (Supporting Information). Thus, each transferrin molecule displayed 3-4 oxidized and derivatized sialic acid residues.
Scheme 1.
Synthesis of Qβ-Tfn conjugates.
The surface-exposed lysine residues of the Qβ capsid were simultaneously derivatized with an alkylazide[8] and AlexaFluor® 568 by reaction with a 35:1 mixture of their corresponding N-hydroxysuccinimide esters (Scheme 1). The resulting particles 1 were thereby labeled with a small amount of dye to allow visualization by fluorescence microscopy in cell-binding studies while providing for multiple sites for subsequent transferrin attachment. The yield of 1 after purification of the protein from excess reagent was 80-85%, composed exclusively of intact particles as determined by size-exclusion chromatography (SEC).
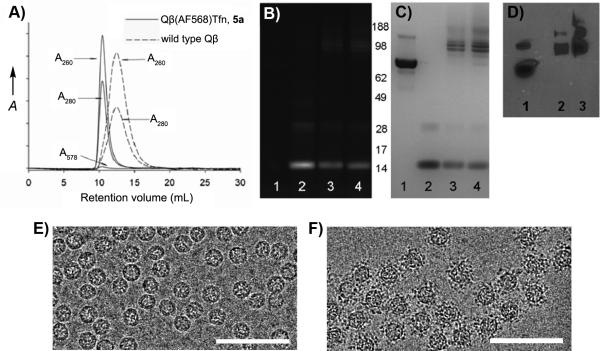
Qβ-Tfn conjugates (5) were prepared by CuAAC reaction of 1 with 3 in the presence of CuI and ligand 4. The conjugates were purified by size-exclusion chromatography (SEC) and characterized by analytical SEC, UV-Vis spectroscopy, dynamic light scattering (DLS), transmission electron microscopy (TEM), SDS-PAGE and Western immunoblotting (Figure 1). The A260/A280 ratios confirmed the presence of intact, RNA-containing capsids, and SEC analysis showed 5 to elute more quickly than the underivatized particle, indicating that the Tfn-decorated particles are larger (Figure 1A). Indeed, TEM showed intact and monodispersed particles of 26±2 nm diameter for the wild-type particles and 29±3 nm for the protein-conjugated particles, determined by automated image analysis. The same trend was observed by DLS, showing hydrodynamic diameters of 28.4 and 38.4 nm, for underivatized and Tfn-labeled particle 5b, respectively.
Figure 1.
Characterization of Qβ-Tfn conjugates. (A) Size-exclusion FPLC (Superose-6 column). (B) SDS-PAGE analysis of the protein gel under UV illumination and (C) after SimplyBlue staining. For (B) and (C), lanes: (1) transferrin, (2) Qβ-azide/dye conjugate 1, (3) Qβ-Tfn conjugate 5a (45 Tfn/particle), (4) Qβ-Tfn conjugate 5b (55 Tfn/particle). (D) Western blot analysis, probing with anti-transferrin antibody; lanes: (1) transferrin, (2) 5a, (3) 5b. (E) TEM of underivatized Qβ. (F) TEM of Qβ-Tfn conjugate 5b. Scale bar = 100 nm.
Western analysis further confirmed the attachment of Tfn molecules to the exterior surface of the virus-like particle (Figure 1D). The loading of Tfn molecules on the particle surface was determined by densitometry analysis after Coomassie staining of the SDS-PAGE gel (Figure 1C). Correcting for the relative molecular masses of the components, approximately 45 and 55 transferrin molecules were attached to Qβ VLPs after reaction times of 2 h and 5 h, respectively. The CuAAC reaction was therefore revealed to be highly efficient at the micromolar concentrations of azide and alkyne components used, and little improvement was exhibited by longer reaction times.
In an early attempt to make fluorescently labeled particles for cell-binding studies, the red fluorescent protein mCherry was genetically encoded into approximately 15 copies of the Qβ coat protein using a previously published method.[17] While the resulting particles were insufficiently bright for the desired purpose, they were readily addressed with transferrin in analogous fashion to 5b, resulting in the attachment of approximately 55 Tfn molecules per VLP as before. Cryo-electron microscopy analysis and image reconstruction revealed no difference between the mCherry-containing particles and the wild-type because of the sparse and presumably random distribution of mCherry fusions on the particle surface. In contrast, the cryo-EM image reconstruction of the conjugate of Tfn-alkyne with Qβ(mCherry)-azide (see Supporting Information) showed clear density attributable to the added transferrin protein (Figure 2). The bulk of the new density was found approximately 26 Å from the particle surface (shown most clearly in cutaway Figure 2D), consistent with the expected length of the linker connecting the VLP to Tfn.
Figure 2.

Cryo-electron microscopy image reconstructions at 17.4 Å resolution. (A,B) Qβ(mCherry)(Tfn)55 conjugate; views down the 5- and 3-fold symmetry axes, respectively. (C) Cross-sectional view showing added density other than that of the VLP in light blue. (D) Wild-type Qβ and Qb(mCherry).
Specific Binding and Internalization of Qβ-Tfn conjugates
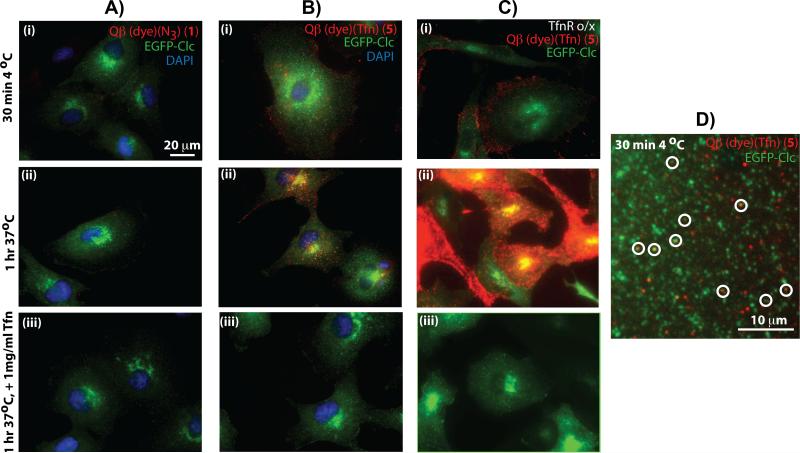
Tfn-TfnR complexes are known to enter the cell through clathrin-medicated endoytosis.[18] To monitor clathrin-mediated endocytosis and to study the interaction between Tfn-VLPs and surface-exposed TfnRs, we used African Green Monkey kidney epithelial cells (BSC1) expressing a fusion between clathrin light chain (Clc) and enhanced green fluorescence protein (EGFP). Similar concentrations of dye-labeled Qβ (1) and Qβ-Tfn (5) were prebound at 4°C for 30 min to determine surface binding, and followed by an incubation at 37 °C for 1 hr to measure internalization. Surface binding and cellular internalization were analyzed by epi-fluorescence microscopy of fixed cells (Figure 3). No binding (Figure 3Ai) or uptake (Figure 3Aii) were observed with 1 even after 60 min at 37°C, indicating that Qβ particles neither bind to cell surface receptors nor are internalized by these cells in a non-specific manner. In contrast, Qβ-Tfn bound to the cell surface at 4°C (Figures 3Bi) as detected by the red fluorescence of the dye on 5. Furthermore, substantial internalization was observed after 1 h at 37 °C. The red particles were observed to accumulate in intracellular structures at the cell periphery and in the peri-nuclear regions indicative of localization in endosomal structures (Figure 3Bii). VLP binding and internalization were abolished when excess unlabeled free transferrin was included in the incubations (Figure 3Aiii, 3Biii), demonstrating that binding and internalization occur through a Tfn-TfnR mediated pathway.
Figure 3.
Representative epi-fluorescence microscopy images showing binding and internalization of VLP particles in EGFP-Clc BSC1 cells. (Column A) Qβ particle 1 with EGFP-Clc BSC1 cells. (Column B) Qβ-Tfn conjugate 5b with EGFP-Clc BSC1 cells. (Column C) 5b and EGFP-Clc BSC1 cells overexpressing transferrin receptors. (Row i) After incubation at 4°C for 30 min. (Row ii) Preincubated at 4°C followed by shift to 37°C for 60 min. (Row iii) As in Row ii, except in the presence of excess free Tfn (1 mg/mL). (D) High-magnification image showing punctate red (5b), green (EGFP-Clc), and colocalized (circled) VLPs with CCPs on the surface of a BSC1 cell after 30 minutes at 4°C. Very similar images were observed with cells incubated at 37°C for 5 min (Supporting Information). In all experiments, VLP concentration was 1.2 μg/mL (0.47 nM in particles).
The involvement of TfnRs during virus uptake was further supported by overexpressing TfnR in BSC1 cells using adenovirus infection,[19] resulting in significantly greater binding and uptake of Qβ-Tfn conjugates by the infected cells (and not by the cells in the same sample that escaped adenovirus infection; Figures 3Ci, 3Cii). Binding and internalization of Qβ-Tfn to TfnR overexpressing cells were again abolished in the presence of excess free Tfn (Figure 3Ciii). We also examined the localization of surface bound Qβ-Tfn relative to clathrin-coated pits (CCPs) after 30 min incubation at 4°C (Figure 3D) and after pre-incubation followed by 5 min at 37°C (Supporting Information). Under both conditions, we could indentify multiple CCPs containing VLPs, suggesting CCPs are the transport carrier of VLPs into the cell (Figure 3D, circled spots).
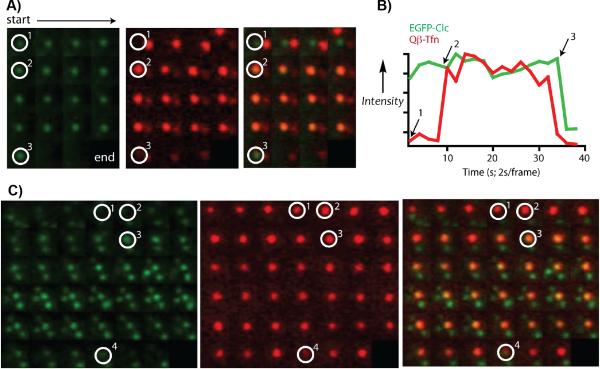
To examine the endocytic mechanism, we performed live cell imaging by total internal reflection fluorescence (TIRF) microscopy, which selectively illuminates the bottom surface of the plasma membrane (approx. 100 nm penetration depth). Dye-labeled Qβ-Tfn conjugates were added to live cells at 37°C, and imaged for green fluorescence followed by red at 2 second intervals. Two main dynamic behaviors were observed: the recruitment of surface bound VLP to pre-formed clathrin-coated pits (CCPs), as shown in Figure 4A and B, and the apparent nucleation of CCPs by VLP binding to the TfnRs (Figure 4C). In both cases, endocytosis was often the result as evidenced by the disappearance or reduced intensity of the red (VLP) and green (clathrin) signals (Figure 4B). These results are reminiscent of those observed for the entry of dengue virus into BSC1 cells by clathrin-mediated endocytosis.[20]
Figure 4.
Live cell TIRF images showing green (EGFP-Clc), red (Qβ-Tfn particle 5b), and merged channels of an approximately 2 μm2 area of the bottom surface of a BSC1 cell. Images go left-to-right across each row, and from top to bottom, taken at 2-second intervals with the green channel preceding the red channel. (A) VLPs associating with a pre-existing coated pit (circled white), followed by internalization of the complex as a whole. Position 1 shows the pre-existing coated pit. Position 2 marks the initial recruitment of the VLP. Position 3 is the time point at which internalization occurs between the acquisition of the green and red channels; note that both are gone at the next time point. (B) Plot of intensity profiles of the CCP (green) and VLP (red) at the indicated spot in (A), normalized each to their respective maximum intensity. (C) VLP nucleating a CCP. Position 1 shows a bound VLP but no clathrin signal. At positions marked 2, the CCP is beginning to assemble at the VLP. By position 3, the pit is fully formed, and it is internalized at position 4. In this case the internalized VLP remains close to the plasma membrane, while the clathrin coat disassembles.
To explore the dependence of internalization on the surface density of transferrin molecules attached to the VLP surface, three versions of AlexaFluor-labeled Qβ-Tfn conjugates were prepared with varying loadings of transferrin per particle, as shown in Figure 5. Azide-functionalized VLP 1 was addressed in three different CuAAC reactions, each containing the same total concentration of alkyne but differing in the ratio of transferrin-alkyne and propargyl alcohol. This provides for approximately the same density of triazoles on the particle surface, but differing amounts of the desired protein ligand. Reactions a and b differed by a factor of six in Tfnalkyne concentration, and resulted in a similar (five-fold) difference in attachment density (5 vs. 25 Tfn molecules per capsid). A further six-fold increase in Tfn-alkyne concentration (to 70 μM, reaction c) increased the loading of Tfn by only 60 percent (to 40±5 per VLP), presumably because of steric crowding or occlusion of azide sites with increasing density of Tfn molecules on the particle surface. Until such steric limitations were reached at the highest loading, the CuAAC reactivity of the two alkynes were approximately the same, in spite of their great difference in size (Supporting Information).
Figure 5.
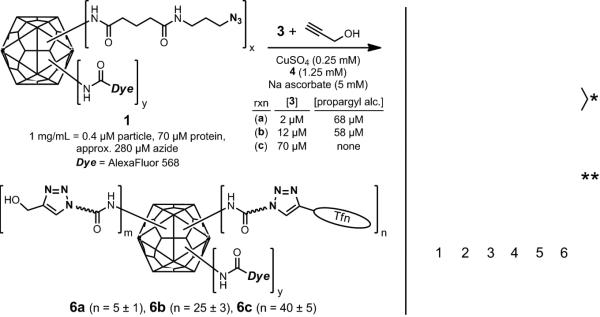
(Left) Synthesis of particles with varying loadings of attached transferrin. (Right) Coomassie stained protein gel of transferrin (lane 2), Qβ-azide 1 (lane 3), Qβ-Tfn conjugates 6a (lane 4), 6b (lane 5), and 6c (lane 6). (Standard protein molecular weight markers appear in lane 1). The bands labeled with a single asterisk denote linked transferrin-Qβ linkages with differing numbers of Qβ coat protein attached to each transferrin molecule. Bands marked with a double asterisk are due to Qβ capsid protein dimers that remain noncovalently associated even under the denaturing conditions of the analysis.
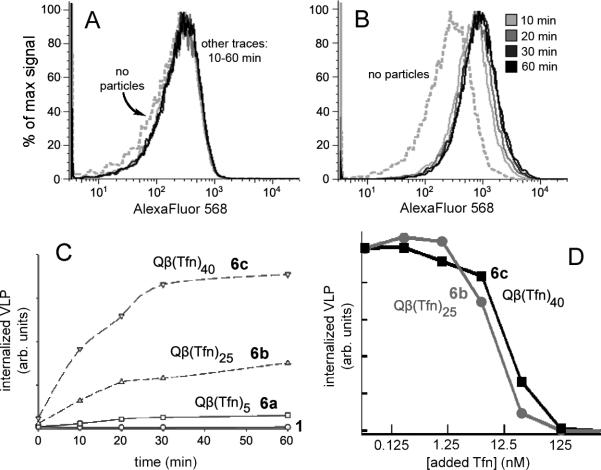
The particles 6a-c were found to be clean, monodisperse structures in the same manner as for conjugates 5. Dynamic light scattering (DLS) measurements indicated the hydrodynamic diameters of the conjugates to be 32.4, 34.2, and 36.2 nm, respectively, compared to that of 28.4 nm for the wild-type particles and 38.4 nm for particle 5b bearing the greatest number of Tfn molecules in this study (55 per particle). Mixtures of normal (rather than TfnR-upregulated) BSC1 cells with identical concentrations of dye-labeled Qβ 1 or the three dye-Qβ-Tfn conjugates were analyzed by flow cytometry to allow for more quantitative characterization of the internalization process. Figure 6A and B show results for the negative control 1 lacking transferrin and the particle bearing the greatest density of transferrin ligands, 6c, respectively. Similar analyses for each of the particles as a function of incubation time with the cells showed maximum internalization to occur within 30-60 minutes.
Figure 6.
FACS analysis following incubation of Qβ-Tfn conjugates with BSC1 cells at 37°C for the specified time, followed by washing and chemical fixation. (A) Underivatized Qβ VLP 1 (3 μg/mL, 1.2 nM in particles), showing no evidence of binding. (B) Qβ-Tfn VLP 6c (1.6 μg/mL (0.6 nM in particle), showing significant and rapid virus uptake. (C) Summary of data for 1 and 6a-c, showing that higher Tfn load leads to increased uptake by cells. (D) Effect of increasing concentrations of free unlabeled Tfn on cellular uptake of 1.6 μg/mL 6b (i.e. 0.6 nM particle, 15 nM Tfn) or 6c (24 nM Tfn) as detected by FACS.
The cellular uptake of Tfn-labeled particles and the inhibition of uptake by free Tfn were found to be consistent with single-point Tfn-TfnR interactions. Thus, while no uptake was observed with dye-labed Qβ 1 (Figure 6A), significant uptake was seen in a time-dependent manner when cells were incubated with Tfn-labeled VLP (Figure 6B). The extent of uptake was dependent on the number of Tfn units/particle (Figure 6C): only a low amount of specific uptake was observed with 6a, bearing an average of 5 Tfn units per particle, uptake was moderate with 6b (25 Tfn per particle) and quite efficient with 6c (40 Tfn per particle). Considering the concentrations of Tfn involved (overall approximately 4, 15, and 24 nM for 6a, 6b, and 6c, respectively), these data correspond roughly to what one would expect for a single-point binding interaction of about 5-10 nM, consistent with the reported low-nanomolar affinity of Tfn for the Tfn receptor.[21] The efficient internalization of 6b and 6c was inhibited with free transferrin in a dose-dependent fashion (Figure 6D), with IC50 values of approximately 1 μg/mL (13 nM) for 6c and 0.5 μg/mL (6 nM) for 6b. For both particles, 10 μg/mL (125 nM) or more of free transferrin was completely inhibitory, while less than 0.01 μg/mL (125 pM) had no effect. Since Qβ-Tfn uptake was effectively inhibited by approximately equivalent concentrations of free Tfn as were presented by the particles, the Tfn-conjugated VLP ligands did not appear to benefit from their polyvalency with respect to affinity or avidity.
Conclusion
The oxidation and derivatization of the sialic acid residues of transferrin is a convenient and effective method for introducing a connecting linkage that can provide a consistent display geometry while retaining binding affinity to transferrin receptors. Conjugation of transferrin-alkyne thus prepared to the azide-functional groups on the Qβ virus capsid was accomplished using the powerful CuAAC click reaction in a recently-reported optimized protocol.[16] These conjugates were specifically internalized by cells expressing transferrin receptors via clathrin-mediated endocytosis.
Our studies represent the first test of transferrin polyvalency on receptor-mediated cell entry in which the protein ligands are arranged in a well-defined platform-based manner. On a per-unit basis, the Qβ-Tfn conjugates have greater affinities for TfnR-bearing cells than free Tfn, and the rates of uptake of Tfn-bearing particles were strongly improved by the attachment of greater numbers of Tfn ligands to each particle (Figure 6C). These findings suggest that polyvalent transferrin conjugates can enhance the targeting of specific cell populations in complex mixtures. However, on a per-Tfn basis, the VLPs did not exhibit significantly increased affinity relative to the free ligand. This interesting disconnection of affinity (or avidity)[22] and internalization efficiency remains unexplained at present, but changes in recycling[23] and intracellular trafficking pathways exhibited by multivalent constructs may be at least partially responsible. These findings make transferrin assemblies potentially useful in the delivery of drugs for therapeutic purposes.[24]
Experimental Section
Details of instrumentation and the purchase or preparation of all reagents, including the Qβ VLPs, are given in Supporting Information.
Preparation of Alexa Fluor® 568 labeled Qβ-azide (1)
A solution of wild-type Qβ VLPs (5 mg/mL in 0.1 M phosphate buffer, pH 7) was treated with a pre-mixed DMSO solution of NHS-linker-azide (final concentration 12 mM, 35-fold excess per Qβ subunit) and the NHS ester of the dye (final concentration 0.35 mM), such that the final reaction mixture contained 20% DMSO. The solution was allowed to stand for 12 h at room temperature, and the derivatized VLP was purified away from excess reagents on a 10-40% sucrose gradient and concentrated by ultrapelleting. The virus pellet was resuspended in HEPES buffer (0.1 M, pH 7.3). FPLC analysis of 1 indicated that >95% of the virus consisted of intact particles. Protein concentration was analyzed by using the Coomassie Plus (Bradford) Protein Assay (Pierce).
Synthesis of O-(prop-2-ynyl)hydroxylamine (2)
Phthalimide-protected O-(prop-2-ynyl)hydroxylamine (5.0 g, 24.9 mmol) was stirred with hydrazine monohydrate (1.4 g, 27.8 mmol) for a few minutes before the addition of diethyl ether (25 mL). This mixture was stirred at room temperature for 45 min. The white precipitate was filtered off and 18 mL of 2 N ethereal HCl was added to the filtrate with continuous stirring. The yellow-white precipitate was filtered and dried under vacuum to give 2 (2.1 g, 78%), which was characterized by 1H NMR spectroscopy, matching the data previously reported.[25]
Preparation of Transferrin-Alkyne Conjugate (3)
Transferrin (2 mg/mL) was incubated with sodium meta-periodate (1 mM) in sodium acetate buffer (0.1 M, pH 5.5; 30 mL) on ice in the dark for 30 min. The mixture was concentrated to less than 1 mL using centrifugal filter tubes (Millipore), and then dialyzed against HEPES buffer (0.1 M, pH 7.2) using Slide-A-Lyzer® Dialysis Cassette Kit (Pierce). The resulting oxidized transferrin was incubated with 5 (8.2 mM, 350-fold excess) in HEPES buffer with 20% DMSO (total volume 25 mL) for 5 h at room temperature by gentle tumbling. Concentration and dialysis as above provided 3 as a pink-colored solution in HEPES buffer; the protein concentration was estimated using the Bradford protein assay.
Preparation of Qβ-Transferrin Conjugate (5) by CuAAC Reaction
Two identical reaction mixtures were prepared, each containing Qβ-azide 1 (1.7 mg/mL, 0.11 mM in protein subunits) and transferrin-alkyne 3 (10.2 mg/mL, 0.12 mM) in HEPES buffer (0.1 M, pH 7.3, 1 mL), containing sodium ascorbate (5 mM), copper sulfate (0.25 mM) and the ligand 4 (1.25 mM). CuSO4 was mixed with 4 in a separate microtube prior to addition to each reaction mixture. The reaction mixtures were allowed to stand at room temperature for 2 h and 5 h, respectively. The resulting conjugates (5a, 5b) were purified by size-exclusion FPLC on a Superose 6 column.
For all of the above steps, we used diferric Tfn under conditions designed to minimize the loss of iron. After conjugation, the protein absorbance ratio (A465/A280) was found to be 0.043, within the range (0.042-0.046) indicating the presence of Fe in the protein.[26] If Fe is lost, the ability of the attached Tfn to bind its receptor would be somewhat diminished, as the affinity for TfnR for apo-Tfn is approximately 10-fold less than for Fe2Tfn.[21, 27]
SDS-PAGE and Western Blot Analysis of Qβ-Tfn Conjugates
Qβ VLP samples 1 and 5a,b were analyzed on denaturing 4−12% NuPage protein gels using 1x MES buffer (Invitrogen). The gel was observed under UV illumination to detect fluorescent dye-labeled bands before staining with Coomassie SimplyBlueTM SafeStain (Invitrogen). For Western blot analysis, after electrophoretic separation on the gel, the proteins were transferred to a nitrocellulose membrane (Millipore) by electrophoretic blotting. After blocking with 5% (w/v) dry milk in TBS-T for 1 h, transferrin conjugation to Qβ was detected with HRP-conjugated mouse monoclonal anti-transferrin antibody (Abcam), diluted 1:5000 in TBS-T buffer. HRP detection of peroxide was performed with SuperSignal chemiluminiscence substrate (Pierce) and exposure to X-ray film.
Cell Culture and Uptake Studies
BSC1 monkey kidney epithelial cells stably expressing rat brain EGFP-clathrin light chain (EGFPLCa) were provided by Dr. T. Kirchhausen, Harvard Medical School and cultured in DMEM supplemented with 10% fetal bovine serum (FBS) and 500 μg/mL G418. For microscopy studies, cells were plated on glass coverslip at a density of 8.3×10³ cells/cm2 overnight. Cells were washed twice in PBS, and VLPs diluted in PBS4+ (1 mM CaCI2, 1 mM MgCI2, 0.2% BSA (w/v), and 5 mM glucose) at a concentration of 0.6 μg/ml. The cells were either kept at 0°C for binding or shifted to 37°C for the desired amount of time. The cells were washed again twice in PBS, and then fixed in 4% paraformaldehyde for 30 minutes at room temperature. The cells were visualized at 60× magnifications using an Olympus X71 epifluorescence microscope equipped with the appropriate filter sets and a CCD camera.
Measurement of Virus Binding by Flow Cytometry
BSC1 cells were cultured on 15 cm dishes to confluency, and then lifted from surface by treating the cells with PBS/5mM EDTA for 15 minutes at room temperature. The cells were pelleted at 1,000 rpm for 10 minutes and resuspended in 500 μL of PBS4+. VLPs were added to the cells suspensions at 1:200 or 1:500 dilution and aliquoted to different tubes for incubation at 37°C water bath for various amount of time. Cells were washed twice in PBS supplemented with 1% FBS, 25mM HEPES, and 1mM EDTA. The pelleted cells were finally resuspended in 200 μL of PBS and then fixed by adding 200 μL 4% paraformaldehyde in PBS. Fixed cells were typically analyzed within 1 hr on Vantage Diva cell sorter.
Electron micrographs were acquired using a Tecnai F20 Twin transmission electron microscope operating at 120 kV, a nominal magnification of 80,000X, a pixel size of 0.105 nm at the specimen level, and a dose of ~20 e−/Å2. 348 images were automatically collected by the Leginon system[28] and recorded using a Tietz F415 4k × 4k pixel CCD camera. Experimental data were processed using the Appion software package.[29] 3,554 particles were manually selected and then filtered down to 2,239 particles for the reconstruction. The 3D reconstruction was carried out using the EMAN reconstruction package.[30] A resolution of 17.4 Å was determined by even-odd Fourier Shell Correlation (FSC) at a cutoff of 0.5.
Supplementary Material
Acknowledgements
This work was supported by the NIH (CA112075), The Skaggs Institute for Chemical Biology, and Pfizer Global Research and Development. The authors would like to thank Dr. Malcolm R. Wood for guidance in acquiring TEM images, Mr. Cody Fine for assistance with flow cytometry data collection, and Mr. Steven Brown for the mCherry-bearing particles used for Tfn attachment and cryo-EM analysis.
Footnotes
Supporting information for this article is available on the WWW under http://www.chembiochem.org or from the author.
References
- 1.Huebers HA, Finch CA. Physiol. Rev. 1987;67:520. doi: 10.1152/physrev.1987.67.2.520. [DOI] [PubMed] [Google Scholar]
- 2.Anderson GJ, Vulpe CD. Cell. Mol. Life Sci. 2009;66:3241. doi: 10.1007/s00018-009-0051-1. [DOI] [PMC free article] [PubMed] [Google Scholar]
- 3.Ryschich E, Huszty G, Knaebel HP, Hartel M, Buechler MW, Schmidt J. Eur. J. Cancer. 2004;40:1418. doi: 10.1016/j.ejca.2004.01.036. [DOI] [PubMed] [Google Scholar]
- 4.a Daniels TR, Delgado T, Helguera G, Penichet ML. Clinical Immunology. 2006;121:159. doi: 10.1016/j.clim.2006.06.006. [DOI] [PubMed] [Google Scholar]; b Daniels TR, Delgado T, Rodriguez JA, Helguera G, Penichet ML. Clinical Immunology. 2006;121:144. doi: 10.1016/j.clim.2006.06.010. [DOI] [PubMed] [Google Scholar]
- 5.a Li H, Qian ZM. Med. Res. Rev. 2002;22:225. doi: 10.1002/med.10008. [DOI] [PubMed] [Google Scholar]; b Li H, Sun H, Qian ZM. Trends Pharmacol. Sci. 2002;23:206. doi: 10.1016/s0165-6147(02)01989-2. [DOI] [PubMed] [Google Scholar]; c Qian ZM, Li H, Sun H, Ho K. Pharmacol. Rev. 2002;54:561. doi: 10.1124/pr.54.4.561. [DOI] [PubMed] [Google Scholar]; d Widera A, Norouziyan F, Shen WC. Adv. Drug Delivery Rev. 2003;55:1439. doi: 10.1016/j.addr.2003.07.004. [DOI] [PubMed] [Google Scholar]
- 6.Derycke ASL, Kamuhabwa A, Gijsens A, Roskams T, de Vos D, Kasran A, Huwyler J, Missiaen L, de Witte PAM, Natl J. Cancer Inst. 2004;96:1620. doi: 10.1093/jnci/djh314. [DOI] [PubMed] [Google Scholar]
- 7.Yang P-H, Sun X, Chiu J-F, Sun H, He Q-Y. Bioconjugate Chem. 2005;16:494. doi: 10.1021/bc049775d. [DOI] [PubMed] [Google Scholar]
- 8.Sen Gupta S, Kuzelka J, Singh P, Lewis WG, Manchester M, Finn MG. Bioconjugate Chem. 2005;16:1572. doi: 10.1021/bc050147l. [DOI] [PubMed] [Google Scholar]
- 9.Wang Q, Kaltgrad E, Lin T, Johnson JE, Finn MG. Chem. Biol. 2002;9:805. doi: 10.1016/s1074-5521(02)00165-5. [DOI] [PubMed] [Google Scholar]
- 10.a Strable E, Finn MG. Curr. Top. Microbiol. Immun. 2008;327:1. doi: 10.1007/978-3-540-69379-6_1. [DOI] [PubMed] [Google Scholar]; b Prasuhn DE, Jr., Singh P, Strable E, Brown S, Manchester M, Finn MG. J. Am. Chem. Soc. 2008;130:1328. doi: 10.1021/ja075937f. [DOI] [PMC free article] [PubMed] [Google Scholar]
- 11.a Hermanson GT. Bioconjugate Techniques. Second Edition Academic Press; San Diego: 2008. [Google Scholar]; b Geoghegan KF, Stroh JG. Bioconjugate Chem. 1992;3:138. doi: 10.1021/bc00014a008. [DOI] [PubMed] [Google Scholar]; c Goodson RJ, Katre NV. Biotechnology. 1990;8:343. doi: 10.1038/nbt0490-343. [DOI] [PubMed] [Google Scholar]
- 12.Petren S, Vesterberg O. Biochim. Biophys. Acta, Protein Struct. Mol. Enzymol. 1989;994:161. doi: 10.1016/0167-4838(89)90155-6. Welch S. Transferrin: The Iron Carrier. CRC Press; Boca Raton: 1992. p. 253. The number of sialic acid groups on transferrin, as well as the total serum sialic acid level, is used as a diagnostic marker of alcoholism. See: Chrostek L, Cylwik B, Krawiec A, Korcz W, Szmitkowski M. Alcohol Alcohol. 2007;42:588–592. doi: 10.1093/alcalc/agm048.
- 13.Beguin Y, Bergamaschi G, Huebers HA, Finch CA. Am. J. Hematol. 1988;29:204. doi: 10.1002/ajh.2830290406. [DOI] [PubMed] [Google Scholar]
- 14.a Cheng Y, Zak O, Aisen P, Harrison SC, Walz T. J. Struct. Biol. 2005;152:204. doi: 10.1016/j.jsb.2005.10.006. [DOI] [PubMed] [Google Scholar]; b Cheng Y, Zak O, Aisen P, Harrison SC, Walz T. Cell. 2004;116:565. doi: 10.1016/s0092-8674(04)00130-8. [DOI] [PubMed] [Google Scholar]
- 15.a Dawson PE, Kent SBH. Annu. Rev. Biochem. 2000;69:923. doi: 10.1146/annurev.biochem.69.1.923. [DOI] [PubMed] [Google Scholar]; b Dirksen A, Hackeng TM, Dawson PE. Angew. Chem., Int. Ed. 2006;45:7581. doi: 10.1002/anie.200602877. [DOI] [PubMed] [Google Scholar]
- 16.Hong V, Presolski SI, Ma C, Finn MG. Angew. Chem., Int. Ed. 2009;48:9879. doi: 10.1002/anie.200905087. [DOI] [PMC free article] [PubMed] [Google Scholar]
- 17.Brown SD, Fiedler JD, Finn MG. Biochemistry. 2009;48:11155. doi: 10.1021/bi901306p. [DOI] [PMC free article] [PubMed] [Google Scholar]
- 18.Warren RA, Green FA, Enns CA. J. Biol. Chem. 1997;272:2116. doi: 10.1074/jbc.272.4.2116. [DOI] [PubMed] [Google Scholar]
- 19.Loerke D, Mettlen M, Yarar D, Jaqaman D, Jaqaman H, Danuser G, Schmid SL. PLoS Biol. 2009;7:e57. doi: 10.1371/journal.pbio.1000057. [DOI] [PMC free article] [PubMed] [Google Scholar]
- 20.Van der Schaar HM, Rust MJ, Chen C, Van der Ende-Metselaar H, Wilschut J, Zhuang X. PLoS Pathogens. 2008;4:e1000244. doi: 10.1371/journal.ppat.1000244. [DOI] [PMC free article] [PubMed] [Google Scholar]
- 21.Ciechanover A, Schwartz AL, Dautryvarsat A, Lodish HF. J. Biol. Chem. 1983;258:9681. [PubMed] [Google Scholar]
- 22.For definitions and discussion of affinity and avidity in the context of polyvalent interactions, see: Mammen M, Choi S-K, Whitesides GM. Angew. Chem. Int. Ed. 1998;37:2754–2794. doi: 10.1002/(SICI)1521-3773(19981102)37:20<2754::AID-ANIE2754>3.0.CO;2-3. We also recommend the following paper for an excellent example of their application: Arranz-Plaza E, Tracy AS, Siriwardena A, Pierce JM, Boons G-J. J. Am. Chem. Soc. 2002;124:13035–13046. doi: 10.1021/ja020536f.
- 23.Marsh EW, Leopold PL, Jones NL, Maxfield FR. J. Cell Biol. 1995;129:1509. doi: 10.1083/jcb.129.6.1509. [DOI] [PMC free article] [PubMed] [Google Scholar]
- 24.Lim CJ, Shen WC. Pharm. Res. 2004;21:1985. doi: 10.1023/b:pham.0000048188.69785.94. [DOI] [PubMed] [Google Scholar]
- 25.Goldberg MW, Lehr HH, Muller M. Hoffmann-La Roche, Inc., US. 1968 [Google Scholar]
- 26.Zak O, Ikuta K, Aisen P. Biochemistry. 2002;41:7416. doi: 10.1021/bi0160258. [DOI] [PubMed] [Google Scholar]
- 27.a Dautry-Varsat A, Ciechanover A, Lodish HF. Proc. Natl. Acad. Sci. U.S.A. 1983;80:2258. doi: 10.1073/pnas.80.8.2258. [DOI] [PMC free article] [PubMed] [Google Scholar]; b Hasegawa T, Ozawa E. Develop. Growth Differ. 1982;24:581. doi: 10.1111/j.1440-169X.1982.00581.x. [DOI] [PubMed] [Google Scholar]
- 28.Suloway C, Pulokas J, Fellmann D, Cheng A, Guerra F, Quispe J, Stagg S, Potter CS, Carragher B. J. Struct. Biol. 2005;151:41. doi: 10.1016/j.jsb.2005.03.010. [DOI] [PubMed] [Google Scholar]
- 29.a Lander GC, Stagg SM, Voss NR, Cheng A, Fellmann D, Pulokas J, Yoshioka C, Irving C, Mulder A, Lau P-W, Lyumkis D, Potter CS, Carragher B. J. Struct. Biol. 2009;166:95. doi: 10.1016/j.jsb.2009.01.002. [DOI] [PMC free article] [PubMed] [Google Scholar]; b Voss NR, Lyumkis D, Cheng A, Lau P-W, Mulder A, Lander GC, Brignole EJ, Fellmann D, Irving C, Jacovetty EL, Leung A, Pulokas J, Quispe JD, Winkler H, Yoshioka C, Carragher B, Potter CS. J. Struct. Biol. 2010 doi: 10.1016/j.jsb.2009.12.005. in press (PMID: 20018246) [DOI] [PMC free article] [PubMed] [Google Scholar]
- 30.Ludtke SJ, Baldwin PR, Chiu W. J. Struct. Biol. 1999;128:82. doi: 10.1006/jsbi.1999.4174. [DOI] [PubMed] [Google Scholar]
Associated Data
This section collects any data citations, data availability statements, or supplementary materials included in this article.


