Abstract
We compare results of the community efforts in modeling protein structures in the tenth CASP experiment, with those in earlier CASPs, particularly in CASP5, a decade ago. There is a substantial improvement in template based model accuracy as reflected in more successful modeling of regions of structure not easily derived from a single experimental structure template, most likely reflecting intensive work within the modeling community in developing methods that make use of multiple templates, as well as the increased number of experimental structures available. Deriving structural information not obvious from a template is the most demanding as well as one of the most useful tasks that modeling can perform. Thus this is gratifying progress. By contrast, overall backbone accuracy of models appears little changed in the last decade. This puzzling result is explained by two factors – increased database size in some ways makes it harder to choose the best available templates, and the increased intrinsic difficulty of CASP targets, as experimental work has progressed to larger and more unusual structures. There is no detectable recent improvement in template free modeling, but again, this may reflect the changing nature of CASP targets.
Keywords: Protein Structure Prediction, Community Wide Experiment, CASP
INTRODUCTION
With the completion of 10 rounds of CASP, it is appropriate to consider what progress has been made. In the first decade of CASPs (experiments 1 through 5) there was a very substantial improvement in model quality, in all respects(1, 2). Here we focus on the second decade of CASP, examining current performance relative to CASP5. We perform the same set of now standard analyses as in previous papers in this series(2–5).
RESULTS
Target difficulty
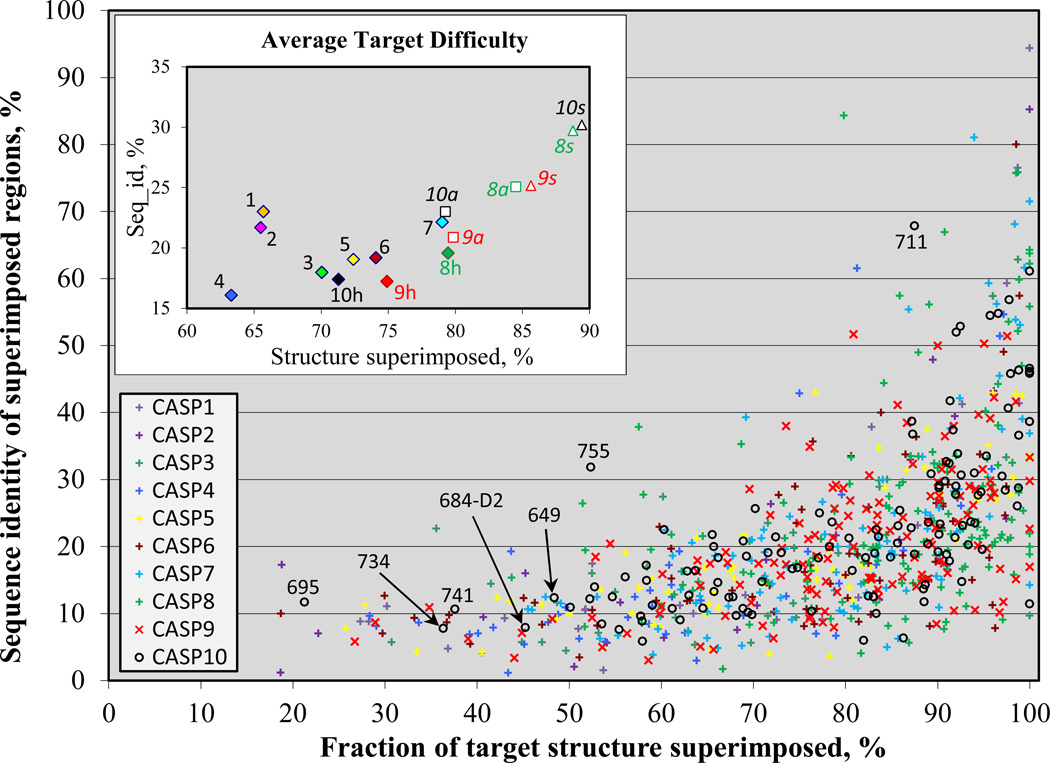
Comparison of performance across targets within a CASP or between CASPs requires consideration of the relative target difficulty. As in previous papers(2–5), we consider the difficulty in terms of two factors: first, the extent to which the most similar existing experimental structure may be superimposed on a modeling target, providing a template for comparative modeling; and second, the sequence identity between the target and the best template over the superimposed residues. Figure 1 shows the difficulty of targets in all CASPs. Targets are divided into domains using the procedure described in Methods. CASP10 domains span a wide range of structure and sequence similarity, as did those in earlier CASPs. Labeled targets are discussed later. The inset shows average target difficulties. Here it is apparent that the full set of CASP10 targets (‘10a’) is of similar average difficulty to that in CASP9, and substantially easier than that in CASP5. CASP10 human/server targets(6) (‘10h’), on the other hand, are of similar difficulty to that of the full CASP5 set, by these measures.
Figure 1.
Relative modeling difficulty of CASP targets, as a function of the fraction of each target that can be superimposed on a known structure (horizontal axis) and the sequence identity between target and template for the superimposed region (vertical axis). Each point represents one target. Inset shows the average values for each CASP. For recent CASPs, averages are shown for server only targets (marked with an “_s” suffix), human/server targets (“_h”), and complete set of targets (“_all”). CASP10 human/server targets are on average of similar difficulty to those of CASP5, by these measures.
Improvement over a best template
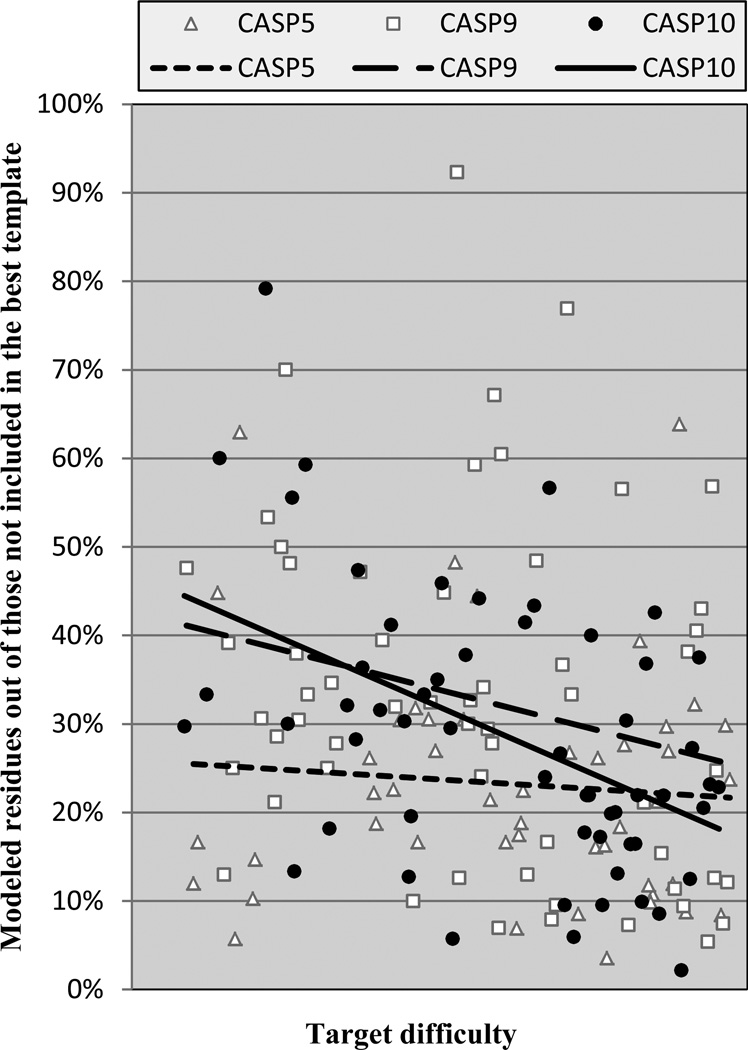
Historically, in template based modeling there was very limited ability to model parts of a structure not present in a template. Already in CASP5 we had seen progress in this regard. Figure 2 shows the fraction of residues that are not covered by the best structural template but are correctly modeled in the best model (by the criterion of Cα errors less than 3.8 Å) in CASPs 5, 9 and 10, as a function of target difficulty. (A single parameter difficulty index is used, based on a linear combination of the coverage and sequence identity used in figure 1 (see Methods)). Only the targets in which at least 15 residues could not be aligned to the best template are considered. There has been significant progress in this area since CASP5: For the relatively easy targets coverage of non-best template residues has increased from ~25% to ~40%, and in the mid-range of difficulty from ~23% to ~35%. The average improvement over the full difficulty range is 5%. Also somewhat larger is the scatter of the values for CASPs 9 and 10 compared with CASP5, clearly visible on the plot. In CASP10, there are 13 targets where predictors were able to model more than 40% of residues not covered by the best templates, while in CASP5 there are only 4 such cases. As discussed later, recent CASPs contain a number of targets that are more difficult to model accurately in ways not captured by the standard scale, and these pull down the apparent overall performance. A balanced comparison with CASP5 is very difficult, but it appears that the real improvement since then is substantially more than the averages and trend lines suggest. As also discussed later, the improvement is further disguised by the increased difficulty of picking the best template in recent CASPs.
Figure 2.
% of residues successfully modeled that were not available from the single best template. Each point represents the best model for a human/server target for CASPs 9 and 10, and all targets for CASP5. CASP10 performance is similar to that found in CASP9, and markedly improved over CASP5.
Overall model accuracy
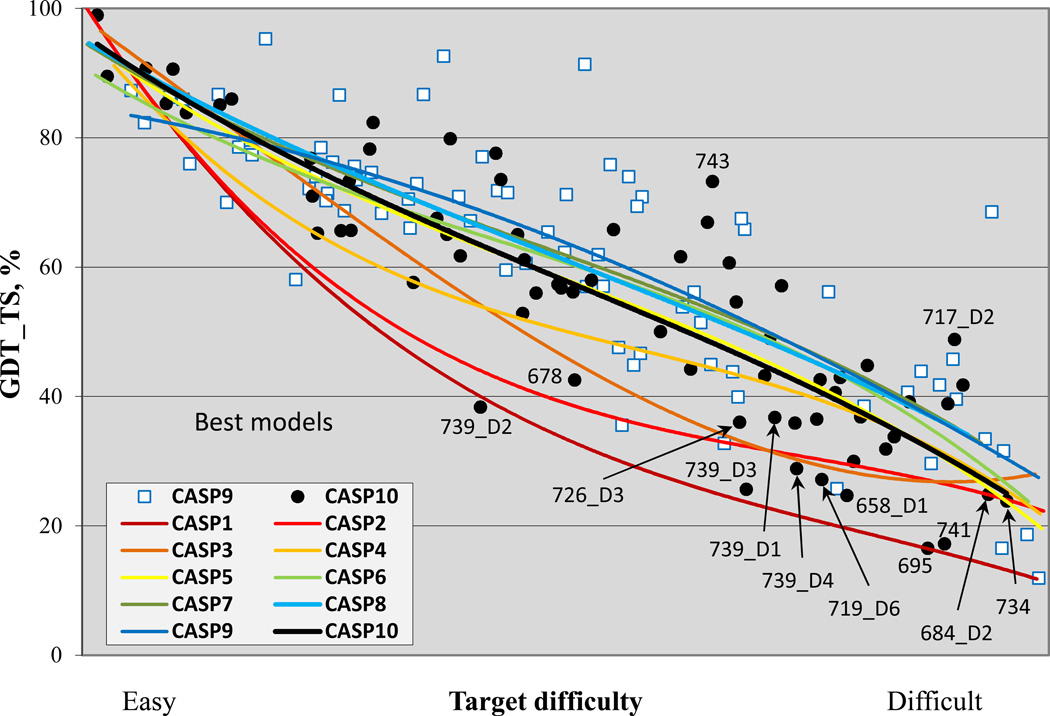
Figure 3 shows the trend in overall backbone accuracy for the best models submitted for each target as a function of target difficulty and using the GDT_TS measure(7). GDT_TS of 100 would correspond to exact agreement between the Cα co-ordinates of a model and the corresponding experimental structure. In practice, GDT_TS of 90 reflects an essentially perfect model, as at that GDT_TS level model deviations are comparable to experimental error and deviations due to varying experimental conditions. Random structures typically return a GDT_TS between 20 and 30. As previously noted, progress between CASP1 and 5 is dramatic. Progress by this measure since CASP 5 is not apparent. Although several recent CASPs have trend lines above that of CASP5, the CASP10 line is essentially the same as CASP5.
Figure 3.
Best GDT_TS scores of submitted models for targets in all CASPs, as a function of target difficulty. For recent CASPs, human/server targets are included, and in earlier CASPs, all targets. Trend lines show little significant change in this measure since CASP5.
Given the obvious progress in modeling non-template regions seen in figure 2, this is a very puzzling result. One observable effect in figure 3 is that there are some CASP10 targets which fall way below the trend lines, pulling the overall performance down. They include the four domains of target 739, a large, elongated, intimately trimeric, phage tail spike protein(8). Targets of this difficulty were seldom found in early CASPs. There are also targets that fall well above the trend lines in CASP 10, for example 743 and 717-D2, corresponding to some of those with greatest non-template region success, as seen in figure 2. We have investigated several general factors that may explain the similarity of CASP5 and recent CASP performance. First, the ‘human/server’ subsets of targets are used for recent CASPs, as opposed to all targets for CASP7 and earlier. Figure S1 shows the same plot using all targets in all CASPs. Here the CASP10 line is above that of CASP5, but only by a little. Second, it may be that as CASP has progressed, targets have tended to become more complex, multi-domain, and multi-chain. Interdomain and interchain interactions influence structure in a manner not easily modeled. A plot for the single domain targets is also similar, though (figure S2).
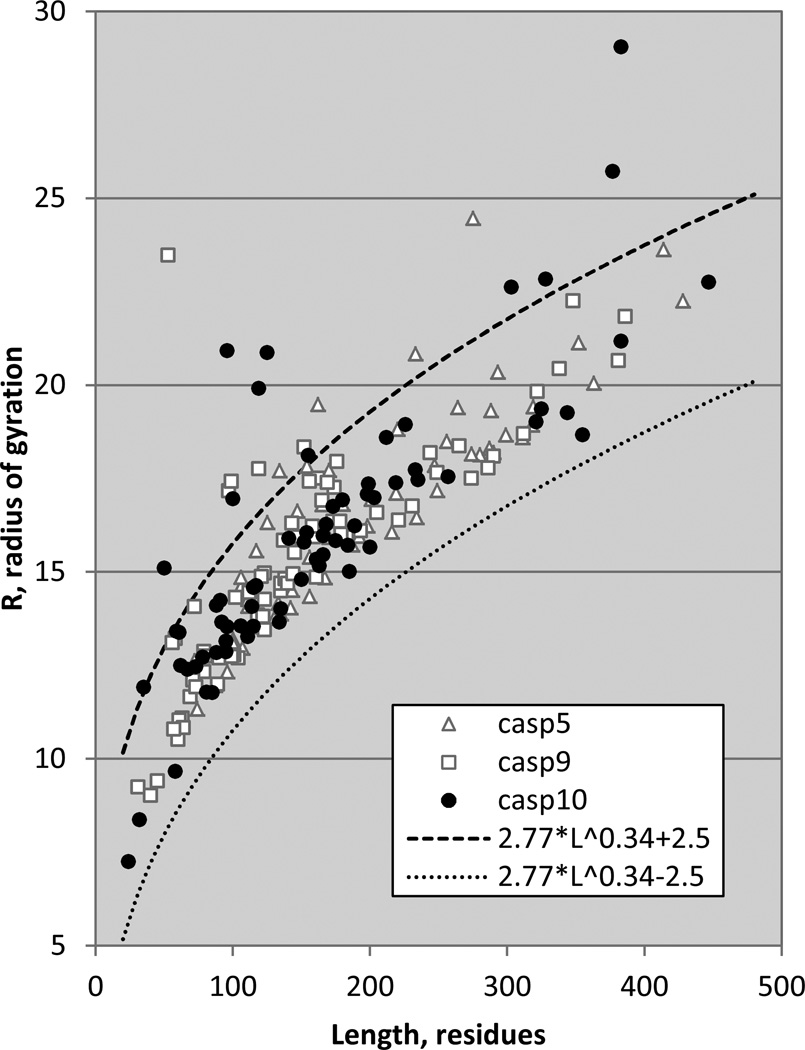
One significant difference between CASP5 and CASP10 targets is structure irregularity, as measured by radius of gyration, R. Figure 4 shows the radius of gyration of domain targets from CASPs 5, 9 and 10, as a function of target length. Also shown are the boundaries in which most PDB structures fall, 2.5Å on either side of a line derived by fitting to the radii of PDB crystal structures determined at 1.7Å or better resolution. The form of this line (R = 2.77 L0.34, where L is target length) is similar to that found in an earlier study(9). While almost all targets fall within these boundaries, there are twelve outliers constituting 17% of all human/server predictor perspective domains in CASP10 (one of the outliers is at a radius of 60Å, and not shown for clarity) and only four (constituting 6% of all domains) in CASP5.
Figure 4.
Radius of gyration of CASP targets as a function of target length. Dashed lines mark the boundaries +/−2.5Å on either side of a line (not shown) derived from fitting to high resolution crystal structures. CASP10 has a number of unusually high radius targets (one at 60Å, not shown).
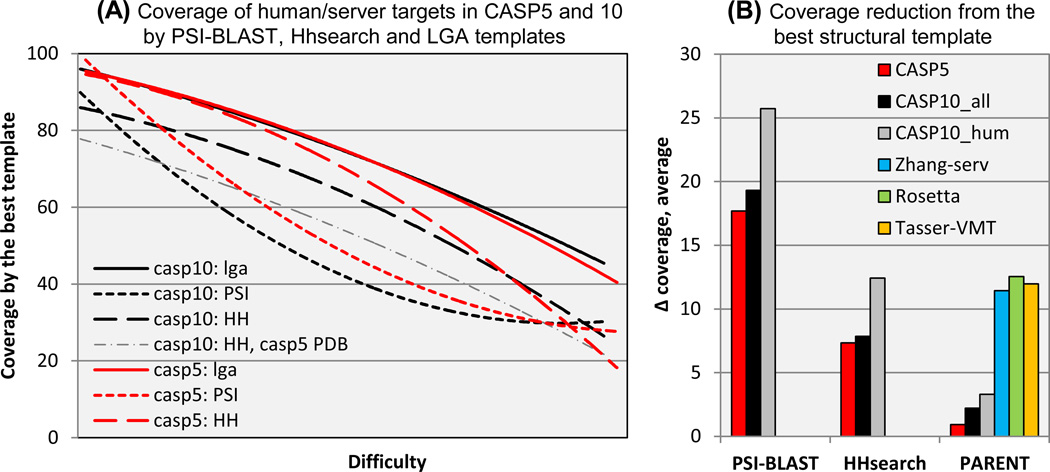
We also consulted members of the prediction community for possible explanations of the apparent lack of progress. Several suggested that although by our criteria the average structural coverage provided by the best available CASP10 templates is similar overall to that in CASP5, best templates have become more difficult to identify in practice, making CASP10 targets effectively harder. To investigate this factor, we compared three sets of templates for targets from CASP10 and CASP5. One set is the one used for the standard analysis of target difficulty. That is, the template is taken from the PDB structure that has maximum coverage of the target, as determined by structure superposition using LGA(7). The second set of templates is derived from the PDB structures with the best PSI-BLAST score to each target sequence(10), a method in use from roughly CASP2 through CASP4. The third set has templates derived from the PDB structures with the best HHsearch score(11), one of the most effective profile-profile type methods. This class of methods came into general use in CASP5, and although some improvements have been made, probably has not essentially changed since. Figure 5A shows the comparison of coverage using these three template sets, as a function of target difficulty. The following points are clear: First, LGA derived templates provide essentially the same average coverage in CASP5 (red line) and in CASP10 (black), at all levels of difficulty. Second, except at the easy target end of the scale, PSI-BLAST derived templates from CASP5 (dotted red) and CASP10 (dotted black) provide very substantially lower coverage than the LGA ones (~40 versus ~75 in the mid-range of difficulty). Third, PSI-BLAST coverage for CASP10 is significantly worse than for CASP5 (about 8% in the mid-range). Fourth, HHsearch derived templates also provide substantially lower coverage than LGA ones (~15 difference in the midrange), although not as low as with PSI-BLAST. Fifth, coverage by CASP10 HHserach templates is lower than the corresponding CASP5 ones by up to 10%, though this difference disappears at the more difficult end of the scale.
Figure 5.
(A): Target coverage provided by three classes of template: best available (solid lines), best detectable using HHsearch (long dashes), and best using PSI-BLAST (short dashes). With both sequence-based methods, achievable coverage is substantially lower than the provided by the best available template, and lower in CASP10 (black lines) than in CASP5 (red lines), showing that good templates are harder to find in recent CASPs. The dash-dotted line shows coverage of CASP10 targets obtained using HHsearch and the CASP5 structure database. The low coverage indicates that increased database size is not the primary cause of increased difficulty in finding good templates in CASP10.
(B): Average loss of coverage relative to the best available template for the best templates found with the methods shown in panel (A) and for templates declared by three of the best performing CASP10 servers. With both PSI-BLAST and HHsearch, loss of coverage is substantial and larger for the CASP10 human targets than for those of CASP5. Declared parent lists for best models do contain near optimal templates, but typically amongst many others. Best templates for CASP10 human targets returned by the selected servers have similar coverage to HHsearch. This view of the data further supports the conclusion that identification of near optimal templates has become substantially harder since CASP5.
Figure 5B shows the reduction in average template coverage using PSI-BLAST and HHsearch compared with the coverage provided by the best available template, for CASP5 and CASP10 (the latter for all and for human/server targets separately). For both methods, the loss of coverage is quite substantial (between 17 and 25% with PSI-BLAST and 7 and 13% with HHsearch. Further, there is a significant difference between the coverage loss for different CASP target sets. In particular, for HHsearch, the most relevant for recent CASPs, CASP10 human targets suffer a 6% greater loss than CASP5 targets. We also examined a fourth way of assigning templates, based on the sets of templates that prediction submissions stated were used in the building of models (normally provided in the ‘PARENT’ field in a standard CASP prediction file). The ‘PARENT’ analysis in figure 5 shows these data. Typically, a number of templates are declared in a prediction file. We superimposed all of the declared templates onto the target structure and selected the one with the highest coverage. As the plot shows, the PARENT template lists do usually contain an entry with nearly as good coverage as that of the best available template (the left 3 bars in the PARENT section). Note though, that in the underlying calculations we took into account all the templates acknowledged by the predictor groups, in this way establishing the maximum achievable performance by the community as a whole. To check if a specific group can consistently include the best template in the list, we examined predictions from three of the better performing CASP10 servers: Rosetta, Zhang-server and Tasser-VMT on all CASP10 targets. As can be seen, the methods are roughly equal in their ability to pick a good template, on average losing about 12% of coverage compared with the best possible template and 5% compared with the best HHsearch template. Note that the weight given to that template in the modeling method may be small, and therefore these results can be deceptive. Overall, it does appear that it has become harder to pick a good template since CASP5, resulting in about an average 6% loss of coverage.
Since template quality goes a long way to determining overall model quality, these data suggest that CASP10 models would be expected to be worse than those of CASP5, because of the greater difficulty of choosing a good template using HHsearch-like methods. In fact, figure 3 shows they are of similar quality, suggesting that improvements in modeling methods have roughly compensated for the increasing difficulty of the targets.
The question remains as to why it is harder to identify a near-optimal template in recent CASPs. Both structure and sequence databases have grown enormously in the last decade (the PDB roughly quintupled, while NCBI’s NR database grew twenty-fold), so that there is a much larger background effect to deal with. It has been shown that including too many sequences in a multiple sequence alignment leads to less accurate alignments(12), but so far there are no published methods of optimizing sequence inclusion. For structure, an implication of increased difficulty of finding a good candidate because of increased database size is that better template choices would be made for CASP10 targets using the structure database available at the time of CASP5. We tested this possibility. In fact templates chosen in this way using HHsearch provide very substantially (13% on the average) less coverage than those found using the CASP10 structure database (figure 5A). It should be mentioned, though, that inclusion of all CASP10 targets into such a comparison is not restrictive enough, as many targets that have very good, easy identifiable templates in the CASP10 structural database would not have had such at the time of CASP5. To eliminate this bias, we repeated the analysis comparing only the targets that had quite good templates (coverage >40%) in the CASP5 database (i.e., essentially eliminating free modeling targets) and where the difference in coverage between the best CASP10 and CASP5 templates was below 20% (i.e., eliminating those TBM targets where in the last decade a much better template has become available). It appeared that for the remaining subset of 67 CASP10 targets the difference in the coverage was much thinner (only 3%), but still in favor of the CASP10 dataset. So, while it is true that picking good templates has become harder, it is not apparently clear why that is the case.
Alignment accuracy
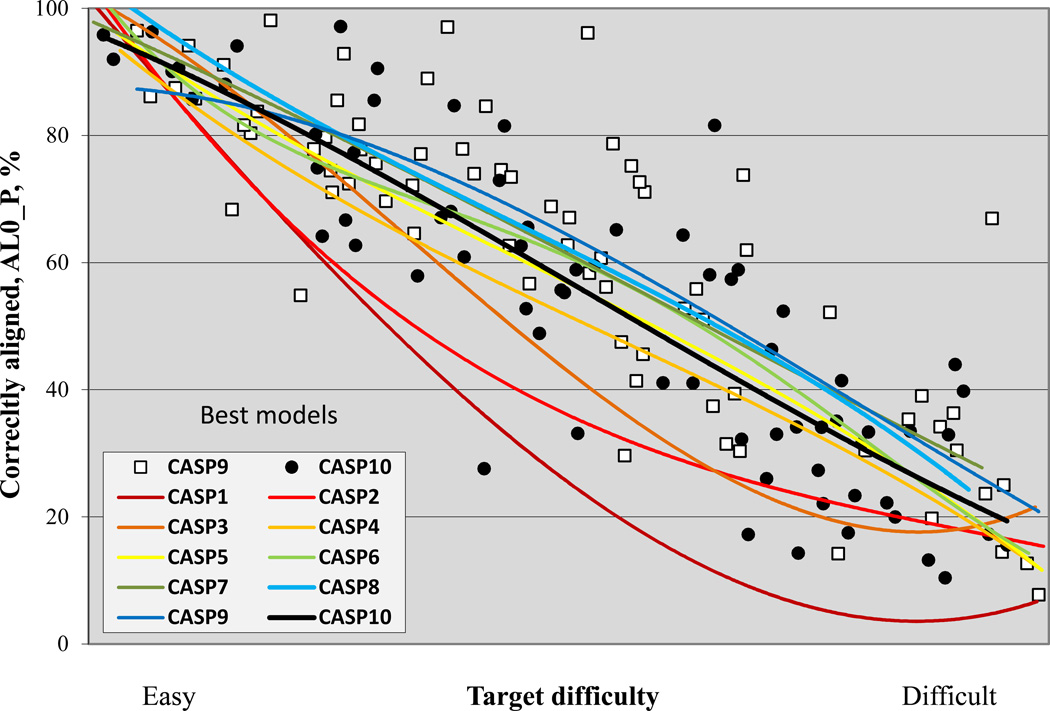
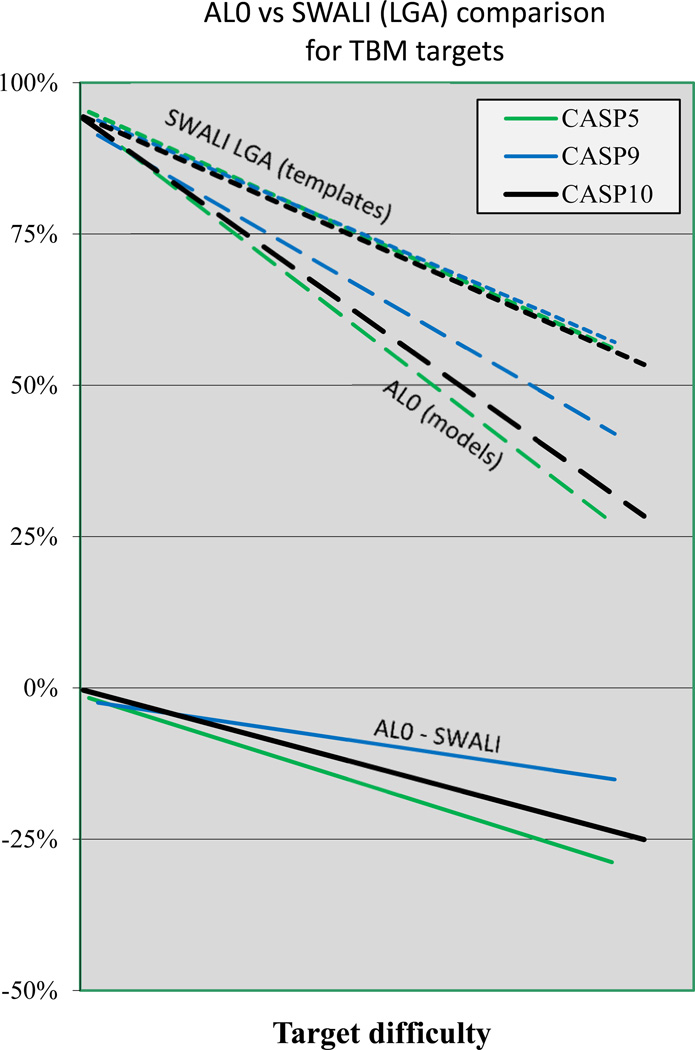
Figure 6 shows alignment accuracy as a function of target difficulty over all the CASPs. Trends here are very similar to that of figure 3 for backbone accuracy. The similarity of the two plots suggests that overall model quality continues to be dominated by alignment accuracy, in spite of the improvement in non-template region modeling discussed earlier. There is no apparent improvement in alignment since CASP5, consistent with the increased difficulty of finding a near optimal template, discussed above. The large fall-off in overall alignment quality as a function of target difficulty in figure 6 is the a combination of two effects - actual alignment errors and the extent to which the best template does cover the target. Figure 7 shows the difference in achieved alignment accuracy compared with theoretically possible using the best template for the template based modeling targets in CASPs 5, 9 and 10. It is apparent that already in CASP5, errors are quite small – close to zero for easy models, about 10% in mid-range, and rising to ~25% at the difficult end of the scale. While there is evidence of improvement in CASP9, compared to CASP5, CASP10 and CASP5 results are very similar. It is likely this is because remaining errors are sufficiently small that they cannot be resolved at the sequence level, and further improvement will only come from the use of methods that test alignment alternatives at the three dimensional structure level.
Figure 6.
% of residues correctly aligned for the best model of each target in all CASPs. Trend lines are similar to those in the equivalent GDT_TS plot (Figure 3), indicating that for many targets, alignment accuracy, together with the fraction of residues that can be aligned to a single template, dominate model quality.
Figure 7.
Alignment accuracy relative to the maximum that could be obtained using the single best template. Top: trend lines as a function of target difficulty for the maximum % of alignable residues (‘SWALI’) and for the fraction aligned for submitted best models (‘AL0’), for CASPs 5, 9 and 10. Alignment accuracy is similar in these three CASPs. Bottom: % difference between aligned residues (AL0) and maximum alignable residues (SWALI). The average fraction of residues not aligned ranges from a few percent for easy targets to ~25% at the difficult end of the scale.
Improvement over a naïve model
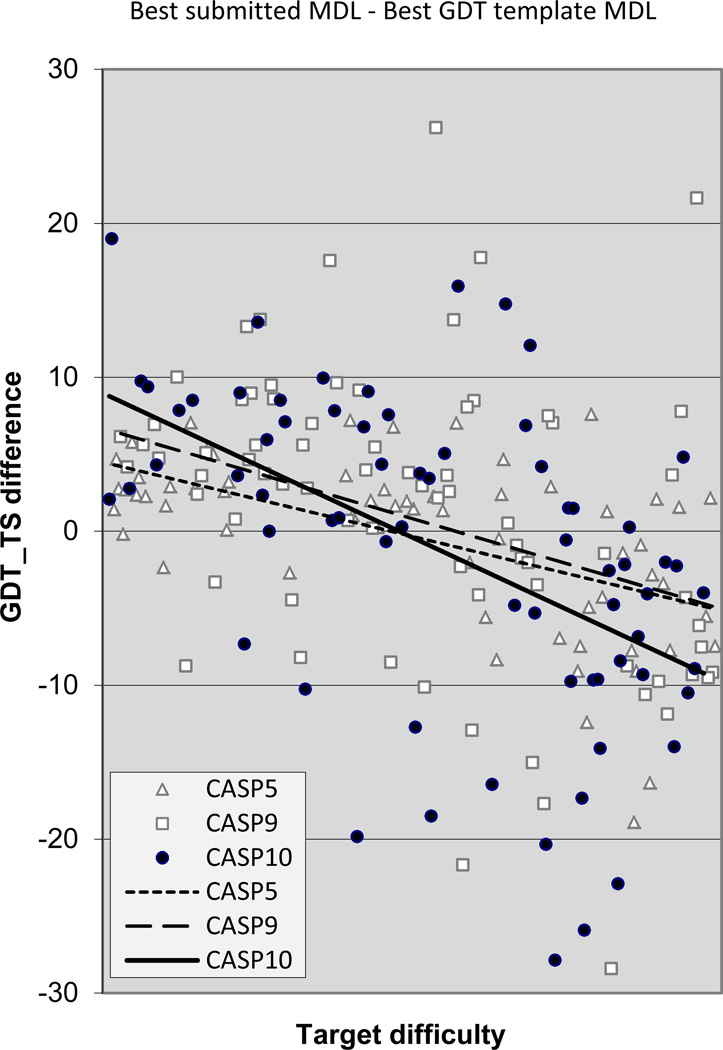
Figure 8 shows the net result of the interplay between the three factors discussed above: better non-template region modeling, harder to find good templates, and saturated alignment accuracy, in terms of the main chain accuracy of the best models compared to the that which could be obtained by copying the best possible template. The trend lines show little difference between performance in different CASPs, but as in the other figures, scatter in recent CASPs is large, with some impressive successes in CASP9 and 10, but also some impressive failures, corresponding to the more difficult targets discussed above. In the easier half of the difficulty scale there is usually a net gain over the template, while in the harder half - a net loss.
Figure 8.
Difference in GDT_TS score between the best submitted model for each target and a naïve model based on knowledge of the best single template. Values greater than zero indicate added value in the best model. In CASPs 9 and 10 there are number of targets with a net gain of greater than 10% over the naïve model, but none in CASP5. There are also models with loss of greater than 20% in CASPs 9 and 10, but none in CASP5, indicating the difficult nature of some recent CASP targets.
Overall template-free performance
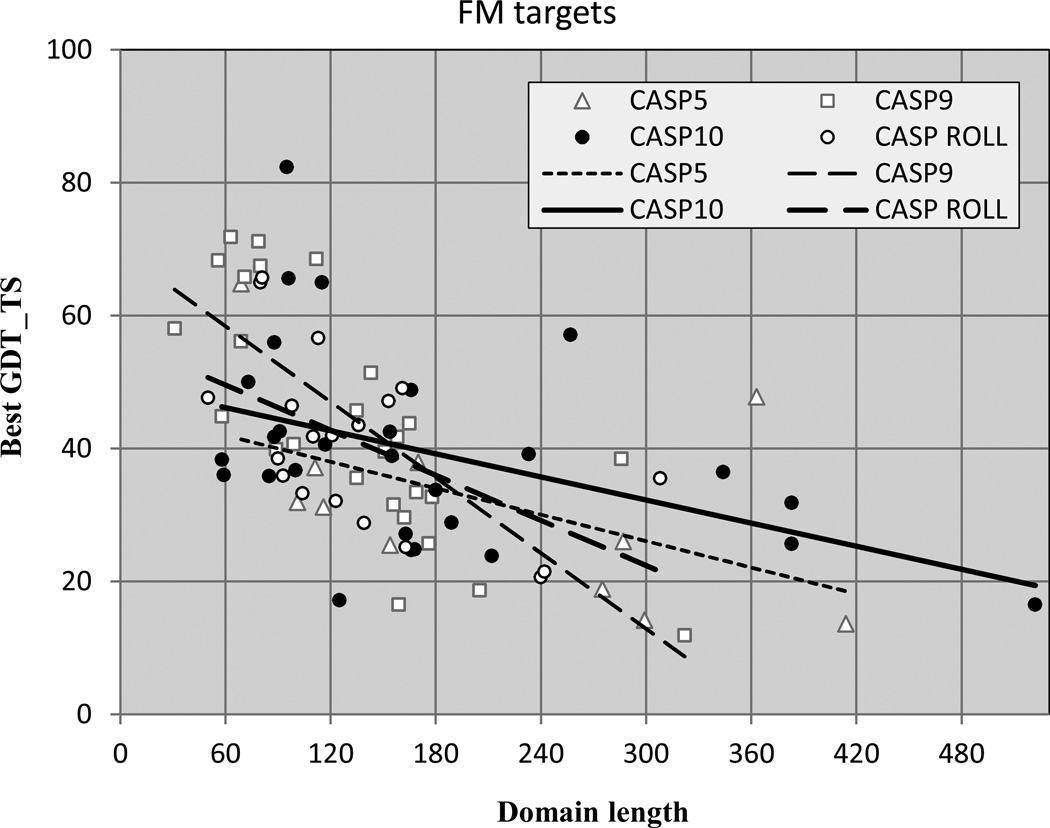
Figure 9 shows free modeling (FM) performance as a function of target domain length in CASPs 5, 9 and 10. For CASP10, an extended set of 28 FM targets are used, consistent with those of earlier CASPs (see Methods) (13). Also included are the 19 targets from the CASP ROLL experiment. CASP ROLL was introduced in 2012 to provide a larger supply of template free modeling targets, and operates continuously rather than being restricted to the normal CASP experiment three month target release period. As has been noted before(14) in CASP 8 (not shown) and 9(15) best models for targets less than 120 residues long are impressive. In particular five out of eleven CASP9 ones have GDT_TS values higher than 60. In contrast, only one out of the five CASP5 targets in this range is above 60, and the other three are below 40. In CASP10, three targets of less than 120 residues have GDT_TS greater than 60, but four are less than 40. The picture is similar for the ROLL targets, for which two of less than 120 residues have GDT_TS greater than 60, and three have values less than 40. Current FM methods perform best on single domain regular structures, and there are very few of these in CASP10. The apparent lack of progress in CASP10 and ROLL compared with CASP5 probably again reflects the more difficult nature of CASP10 targets. First, many targets which in CASP5 would have been in this category now have templates (twenty CASP10 targets, which in CASP5 would have been in this category, now have templates, by the criteria of CASP5-era PDB coverage of less than 40% and CASP10 coverage greater than 50%). Second, as is the case with the template based targets, the CASP10 FM targets exhibit more irregularity, and more of a tendency to be domains of larger proteins that are hard to identify from sequence and that may be dependent on the rest of the structure for their conformation. In contrast, most of the successful FM models in the past have been for small, single domain highly regular targets. These have completely disappeared in CASP10, probably reflecting the fact that most small independent folds have now been seen. Nevertheless, it is clear that in contrast to the first ten years of CASP, progress in this area since CASP5 has been limited. In CASP4 we witnessed for the first time that a high quality model can be produced for a regular single domain target of less than 100 residues (target T0091). With successive CASPs, more groups have been successful with this class of targets. But there has been little detectable progress with longer targets, or with targets embedded in large structures or complexes. Presumably this reflects the limits of fragment based methods, the dominant technique in template free modeling prediction. Limitations arise from the difficulty of identifying domains, the influence of other inter-actors on conformation, the difficulty of sampling less common conformations, and from the exponential increase in sampling required as structures become larger. Difficulty in scoring conformations reliably also plays a role, though one study suggests this is not the dominant problem(16).
Figure 9.
Accuracy of the best models for template free targets, as a function of target length. In CASPs 9, 10 and in CASP ROLL, there are a number of models of short targets with high GDT_TS scores, but only one in CASP5. Methods are not currently effective for bigger targets.
DISCUSSION
The picture of progress since CASP5 can be summarized as follows:
There has been an improvement in the amount of structure not covered by the best available template that is successfully modeled. By this criterion, the best prediction methods improved by approximately 10% in the last decade (an increase from an average of 23% in CASP5) (figure 1). This progress likely arises from the large amount of effort devoted to the development of multiple template methods in recent years(17).
The nature of CASP targets has changed in the last decade, such that at a given level of sequence identity and structural similarity to available experimental structures, it is significantly harder to select a template close to the best available. As a result, identifiable templates provide up to 10% less coverage of the target than in CASP5, at the same apparent level of target difficulty.
The effects of increased sub-optimality of template choice are largely offset by the improvement in modeling non-primary template regions, so that overall backbone accuracy is little changed (figure 3) by the criteria used here.
The accuracy of alignment of the target sequence to template had saturated by CASP5, when mature profile-profile methods were already in general use. Remaining errors are typically fairly small, probably reflecting the limits of linear sequence/secondary structure methods.
Consistency in modeling small, regular, single domain template free structures has advanced since CASP5, with more methods being successful. These improvements have been offset by the increasing rarity of such ideal targets. FM targets are now typically part of larger proteins and complexes, and more irregular.
How will the field advance in the next ten years? There have been two encouraging developments. In CASP10, as described in a companion paper(18), for the first time a refinement method succeeded in consistently improving the accuracy of every target, albeit by a small average amount. In the larger community, there has been much excitement about improved methods of predicting three dimensional contacts, providing restraints for producing more accurate models(19). So far, these methods have not had an impact in CASP, but we look forward to the next experiment…
METHODS
Domain definitions
As different domains within the same protein may present different modeling difficulty, CASP assessment is performed at the domain level(18, 20, 21). We adopt the same practice here, but use a somewhat different domain separation procedure from that used by the assessors(22). We required that domains used in this analysis should be clearly identifiable at the time of prediction and therefore relied exclusively on the results of sequence-based homology searches. If templates strongly suggested that the target consisted of several domains, we divided the targets accordingly (T0651, 652, 671, 674, 677, 686, 705, 713, 717, 724, 732), except where all putative domains were sequentially related to the same template (T0663, 675, 685 690). If a target was only partially covered by the templates (or not covered at all), this was an indication that it might be a multi-domain target containing template-free domains. As domains belonging to different modeling categories require different modeling techniques, in such cases (T0658, 684, 693, 719, 726, 735, 739, 756) we divided the targets into the domains as identified by the assessors.
As some residues in the experimental structures were not well defined(22), assessors excluded them from the evaluation. We base our analysis on the untrimmed targets following the notion that predictors had no means to establish a-priori which residues in the target will be removed by the assessors. We do use official (trimmed) domain definitions for some of the single-domain NMR targets, where the spread of experimental models in the ensemble is very large (T0655, 657, 662, 668, 669, 709, 711, 714, 716, 731), and for some X-ray targets containing regions strongly affected by the crystal packing (T0691, 704).
Target Difficulty
The predictive difficulty of a target depends on many factors. Two of them - structural and sequence similarity of a target to proteins of known structure - are readily accountable, comparable across different CASPs, well correlated with the quality of the produced models, and therefore naturally suited for estimating the difficulty. Here we define the difficulty of a target through these two parameters of the single best available template. Note that other factors like difficulty of finding the best template, difficulty of aligning this template to the target or availability of other templates covering different regions of the target are also known to affect modeling difficulty, but not taken into account here as they are difficult to quantify.
In CASP10, the templates were searched for in the PDB releases accessible before each target deadline. To identify the best template, each target was compared with every structure in the appropriate release of the protein databank using the LGA structure superposition program and the most similar structure was chosen as the representative template. Templates for the previous CASP targets were those used in the earlier analyses.
Similarity between a target structure and a potential template is measured in terms of the LGA_S score, coverage and sequence identity calculated from the LGA sequence independent superpositions with a 4Å distance cutoff. Note that this cutoff differs from the 5Å cutoff used in all previous similar studies; because of that we recalculated the similarity parameters for all templates from the previous CASPs with the same distance parameter for consistency. The cutoff was lowered as in previous studies we observed that the more lax 5Å cutoff sometimes allowed for unreasonably high superposition scores between unrelated structures, particularly for small proteins.
As a rule, the template with the highest LGA_S score is chosen to be the representative template. There are several exceptions to the rule, where a structure with a slightly lower LGA_S score had substantially higher coverage or sequence identity than the originally selected template, and so was selected as the representative template. The coverage is defined as the number of target-template Cα atom pairs that are within 4Å in the optimal LGA superposition, irrespective of continuity in the sequence, or sequence similarity. Sequence identity is defined as the fraction of structurally aligned residues that are identical, maintaining sequence order. Note that basing sequence identity on structurally equivalent regions will usually yield a higher value than obtained by sequence comparison alone.
Relative difficulty of target domains in all CASPs, Rcumul, is determined based on the two difficulty parameters described earlier in this section. First, all domains are sorted according to descending structural coverage (in case of identical values, next levels of the sorting are sequence identity and LGA_S), and each target is assigned a structural alignment rank Rstr. Next, we repeat the sorting procedure with the sequence identity as the primary sorting parameter, and coverage and LGA_S as secondary sorting parameters, and assign a sequence identity rank Rseq to each domain. These two ranks are then combined into a single value Rcumul = Rstr + Rseq, and then all domains are re-ranked according to the cumulative rank Rcumul, using Rstr ranking for tie breaking if necessary.
A number of different datasets are used in the analyses. The dataset that is used in the majority of analyses consists of all targets from CASPs 1–7 and human/server targets from CASPs 8–10 (as those are closest in their relative difficulty to the CASP 1–7 targets). We also considered datasets of all targets from all CASPs; targets from CASP5, 9 and 10 only; template-based modeling targets; single-domain targets, and some others. For each dataset, the relative difficulty scale was recalculated based only on the targets included in the dataset.
GDT_TS, AL0 and SWALI scores
The GDT_TS score is calculated with the LGA program(7), run in the sequence-dependent mode with the 4Å distance cutoff (parameters: -3 -sda -d:4.0). The)GDT_ score determines overall accuracy of a model in terms of the average percentage of Cα atoms in the prediction deviating from the corresponding atoms in the target structure by no more than 1, 2, 4 and 8 Å (see our previous paper for the details).
AL0 score measures alignment accuracy of a model by counting the number of correctly aligned residues in the 4Å sequence-independent LGA superposition of the modeled and experimental structures of a target (LGA parameters: -4 -sia -d:4.0). A model residue is considered to be correctly aligned if the Cα atom falls within 3.8Å of the corresponding atom in the experimental structure, and there is no other experimental structure Cα atom nearer. Note that in the present study we lowered the distance cutoff in the sequence-independent LGA superpositions from 5Å to 4Å (see also Target Difficulty above), and for consistency we recalculated the AL0 values for the models from all previous CASPs using the same cutoff.
The maximum alignability score (SWALI) is the fraction of the best template’s residues that can be correctly aligned to the target in the 4Å LGA sequence-independent superposition using the Smith-Waterman algorithm. The dynamic programming procedure determines the longest alignment between the two structures, in a way that no atom is taken twice and all the atoms in the alignment are in the order of the sequence.
Construction of naive models
Naive "template models" are built on SWALI-type alignments (see above) of a target and the best structural template. The coordinates of the template’s backbone atoms are transcribed to the aligned target residues.
Radius of gyration
Radius of gyration R is determined by the non-globularity compactness of a structure and is defined as a root mean square distance from each heavy atom of the protein to their centroid
where Rc is the vector of coordinates of the center of geometry of all heavy atoms, ri (i=1, …, N) is the vector of coordinates of the i-th atom, N is the number of non-hydrogen atoms in the target.
Criteria for defining the extended FM set of targets
Defining domain boundaries and categorization of targets is always a subjective process. In our comparison of performance across CASPs, it is of paramount importance to have domains in different CASPs categorized using as a closely similar principles as possible. This is especially true when comparing the performance on free modeling targets, as usually there are only very limited number of such targets in each particular CASP. In CASP10, the assessors used quite strict criteria for defining free modeling targets, and, as a result, the GDT_TS scores of the best models on such targets never exceeded 40%. In CASP9, the assessors used more lenient criteria that included a subjective reasoning on whether the template for the domain was clearly findable by sequence methods at the time of the experiment(13), and, as a result, the FM set included a number of targets with quite good models (with the GDT_TS scores over 50). We solicited the help of the CASP9 free modeling assessor in defining a compatible set of CASP10 FM targets. His conclusions showed that indeed, many more (28 total) domains could have been classified to free modeling provided the more lenient categorization criteria consistent with CASP9 are used: T0651-D1, 653, 658-D1, 666, 671-D1, 678, 684-D1, 684-D2, 693-D1, 695, 705-D1, 705-D2, 717-D2, 719-D6, 724-D2, 726-D3, 732-D2, 734, 735-D1, 735-D2, 737, 739-D1, 739-D2, 739-D3, 739-D4, 740, 741, 742. These domains were used in our template-free analysis in this study.
Supplementary Material
ACKNOWLEDGEMENTS
We thank members of predictor community and the CASP advisory board for discussing some aspects of the paper. In particular, we would like to thank David Baker, David Jones, Michael Levitt, Jeffery Skolnick, Michael Sternberg and Yang Zhang for their constructive suggestions. Special thanks to Nick Grishin for re-categorization of CASP10 domains according to the CASP9 criteria.
This work was partially supported by the US National Institute of General Medical Sciences (NIGMS/NIH) – grant R01GM100482 to KF.
REFERENCES
- 1.Moult J. A decade of CASP: progress, bottlenecks and prognosis in protein structure prediction. Curr Opin Struct Biol. 2005;15:285–289. doi: 10.1016/j.sbi.2005.05.011. [DOI] [PubMed] [Google Scholar]
- 2.Kryshtafovych A, Venclovas C, Fidelis K, Moult J. Progress over the first decade of CASP experiments. Proteins. 2005;61(Suppl 7):225–236. doi: 10.1002/prot.20740. [DOI] [PubMed] [Google Scholar]
- 3.Kryshtafovych A, Fidelis K, Moult J. CASP9 results compared to those of previous CASP experiments. Proteins. 2011;79(Suppl 10):196–207. doi: 10.1002/prot.23182. [DOI] [PMC free article] [PubMed] [Google Scholar]
- 4.Kryshtafovych A, Fidelis K, Moult J. CASP8 results in context of previous experiments. Proteins. 2009;77(Suppl 9):217–228. doi: 10.1002/prot.22562. [DOI] [PMC free article] [PubMed] [Google Scholar]
- 5.Kryshtafovych A, Fidelis K, Moult J. Progress from CASP6 to CASP7. Proteins. 2007;69:194–207. doi: 10.1002/prot.21769. [DOI] [PubMed] [Google Scholar]
- 6.Kryshtafovych A, Monastyrskyy B, Fidelis K. CASP Prediction Center infrastructure and evaluation measures in CASP10 and CASP ROLL. Proteins This issue. 2013 doi: 10.1002/prot.24399. [DOI] [PMC free article] [PubMed] [Google Scholar]
- 7.Zemla A. LGA: A method for finding 3D similarities in protein structures. Nucleic Acids Res. 2003;31:3370–3374. doi: 10.1093/nar/gkg571. [DOI] [PMC free article] [PubMed] [Google Scholar]
- 8.Kryshtafovych A, et al. Challenging the state-of-the-art in protein structure prediction: Highlights of experimental target structures for the 10th Critical Assessment of Techniques for Protein Structure Prediction Experiment CASP10. ProteinsThis issue. 2013 doi: 10.1002/prot.24489. [DOI] [PMC free article] [PubMed] [Google Scholar]
- 9.Kolinski A, Godzik A, Skolnick J. A General method for the prediction of the three dimensional structure and folding pathway of globular proteins: Application to designed helical proteins. J.Chem.Phys. 1993;98:7420–7433. [Google Scholar]
- 10.Altschul SF, Madden TL, Schaffer AA, Zhang J, Zhang Z, Miller W, Lipman DJ. Gapped BLAST and PSI-BLAST: a new generation of protein database search programs. Nucleic Acids Res. 1997;25:3389–3402. doi: 10.1093/nar/25.17.3389. [DOI] [PMC free article] [PubMed] [Google Scholar]
- 11.Soding J. Protein homology detection by HMM-HMM comparison. Bioinformatics. 2005;21:951–960. doi: 10.1093/bioinformatics/bti125. [DOI] [PubMed] [Google Scholar]
- 12.Chubb D, Jefferys BR, Sternberg MJ, Kelley LA. Sequencing delivers diminishing returns for homology detection: implications for mapping the protein universe. Bioinformatics. 2010;26:2664–2671. doi: 10.1093/bioinformatics/btq527. [DOI] [PubMed] [Google Scholar]
- 13.Kinch LN, Shi S, Cheng H, Cong Q, Pei J, Mariani V, Schwede T, Grishin NV. CASP9 target classification. Proteins. 2011;79(Suppl 10):21–36. doi: 10.1002/prot.23190. [DOI] [PMC free article] [PubMed] [Google Scholar]
- 14.Ben-David M, Noivirt-Brik O, Paz A, Prilusky J, Sussman JL, Levy Y. Assessment of CASP8 structure predictions for template free targets. Proteins. 2009;77(Suppl 9):50–65. doi: 10.1002/prot.22591. [DOI] [PubMed] [Google Scholar]
- 15.Kinch L, Yong Shi S, Cong Q, Cheng H, Liao Y, Grishin NV. CASP9 assessment of free modeling target predictions. Proteins. 2011;79(Suppl 10):59–73. doi: 10.1002/prot.23181. [DOI] [PMC free article] [PubMed] [Google Scholar]
- 16.Kim DE, Blum B, Bradley P, Baker D. Sampling bottlenecks in de novo protein structure prediction. Journal of molecular biology. 2009;393:249–260. doi: 10.1016/j.jmb.2009.07.063. [DOI] [PMC free article] [PubMed] [Google Scholar]
- 17.Zhang Y. Progress and challenges in protein structure prediction. Current opinion in structural biology. 2008;18:342–348. doi: 10.1016/j.sbi.2008.02.004. [DOI] [PMC free article] [PubMed] [Google Scholar]
- 18.CASP10 refinement assessment paper, this issue [Google Scholar]
- 19.de Juan D, Pazos F, Valencia A. Emerging methods in protein co-evolution. Nature reviews. Genetics. 2013;14:249–261. doi: 10.1038/nrg3414. [DOI] [PubMed] [Google Scholar]
- 20.CASP10 Template modeling assessment paper, this issue [Google Scholar]
- 21.CASP10 free modleing assessment, this issue [Google Scholar]
- 22.Taylor, et al. Definition and classification of evaluation units in CASP10. Proteins This issue. 2013 doi: 10.1002/prot.24434. [DOI] [PMC free article] [PubMed] [Google Scholar]
Associated Data
This section collects any data citations, data availability statements, or supplementary materials included in this article.


