

Abstract
Objective
Some previous studies suggest modest to strong effects of 25-hydroxyvitamin D (25(OH)D) on multiple sclerosis (MS) activity. The objective of this study was to explore the mechanistic rationale that may explain potential clinical effects of 25(OH)D.
Methods
This study measured serum 25(OH)D levels and global gene expression profiles over a course of up to 2 years in patients starting treatment with interferon beta-1b (IFNB-1b) after a clinically isolated syndrome. MS disease activity was assessed by the number of gadolinium-enhancing lesions present on repeated magnetic resonance imaging (MRIs).
Results
The number of gadolinium-enhancing lesions was highly significantly associated with 25(OH)D levels. Conducting various systems-level analyses on the molecular level, multiple lines of evidence indicated that 25(OH)D regulates expression dynamics of a large gene–gene interaction system which primarily regulates immune modulatory processes modulating MS activity. The vitamin D response element was significantly enriched in this system, indicating a direct regulation of this gene interaction network through the vitamin D receptor. With increasing 25(OH)D levels, resulting regulation of this system was associated with a decrease in MS activity. Within the complex network of genes that are regulated by 25(OH)D, well-described targets of IFNB-1b and a regulator of sphingosine-1-phosphate bioavailability were found. The 25(OH)D effects on MS activity were additively enhanced by IFNB-1b.
Interpretation
Here, we provide mechanistic evidence that an unbalanced 25(OH)D gene expression system may affect MS activity. Our findings support a potential benefit of monitoring and managing vitamin D levels (e.g., through supplementation) in early MS patients treated with IFN-beta-1b.
Introduction
There is growing evidence that vitamin D may not only be important in the development of multiple sclerosis (MS), a complex demyelinating disease of the central nervous system, but also in MS disease activity and in its long-term progression.1 Several observational studies of patients with MS have found that increased 25-hydroxyvitamin D (25(OH)D) levels were associated with fewer relapses2–4 and decreased magnetic resonance imaging (MRI) activity.5
Additionally, a number of randomized, placebo-controlled clinical trials of vitamin D supplementation among patients with MS have reported lower numbers of gadolinium-enhancing lesions (GELs)6 and relapses7 or no effect of 25(OH)D on any MS endpoint,8,9 although it must be noted that many clinical trials did not have sufficient power to detect an effect of 25(OH)D on MS disease activity. In a longitudinal study among over 450 participants in the Betaferon/Betaseron in Newly Emerging For Initial Treatment (BENEFIT) clinical trial,10–12 low 25(OH)D levels (<50 nmol/L) predicted conversion from a clinically isolated syndrome (CIS) to clinically definite MS (CDMS) and were associated with a higher rate of new active lesions and a higher relapse rate.13 However, the biological mechanisms underlying these observations are not understood. While 25(OH)D is known to be an immunomodulator,14 how it may act on a molecular level in patients with MS to reduce disease activity is not known.
Thus, we conducted a global gene expression analysis in which expression profiles at various time points among participants in the BENEFIT clinical trial were measured in order to examine the potential relationship between genes or gene sets expressed in association with 25(OH)D and those associated with MS activity. Further analysis of the identified gene sets to characterize their enrichment with respect to known 25(OH)D gene sets and enrichment for vitamin D receptor (VDR) binding sites was performed to help elucidate potential mechanisms for the mode of action of 25(OH)D in the context of MS.
Subjects and Methods
Ethics statement
BENEFIT was a multicenter study, in which patients from 18 countries were included in 98 centers. The study was conducted in agreement with Good Clinical Practice (GCP) principles according to the International Conference on Harmonisation of Technical Requirements for Registration of Pharmaceuticals for Human Use. The Institutional Review Boards of all participating centers approved the study protocol and all patients gave written informed consent before trial entry. The secondary analyses presented in this manuscript were conducted anonymously to describe the impact of vitamin D in the context of interferon beta-1b (IFNB-1b) treatment.
Study population and study design
The BENEFIT study was originally designed to evaluate the impact of early versus delayed treatment with IFNB-1b (Betaseron®; Bayer HealthCare Pharmaceuticals; Berlin, Germany) in patients with a first event suggestive of MS (i.e., a diagnosis of a CIS). Between February 2002 and June 2003, 468 patients from 18 European countries, Israel, and Canada were enrolled at 98 centers. In the initial placebo-controlled phase, patients with a minimum of two clinically silent lesions on MRI, and thus a high probability to convert to CDMS,15 were randomized in a 5:3 ratio to receive either IFNB-1b 250 μg (n = 292) or placebo (n = 176) subcutaneously every other day for 2 years or until diagnosis of CDMS. All patients were then eligible to enter a prospectively planned follow-up phase with open-label IFNB-1b for up to a maximum of 5 years after randomization. Details of the study design and results have been published elsewhere.10–12
Measurement of 25(OH)D
25(OH)D was measured in serum samples collected at baseline (immediately before study treatment in the placebo-controlled phase of BENEFIT and up to 60 days after the onset of the CIS) and at 6, 12, and 24 months thereafter. Under ambient conditions, samples were shipped within 3 days of being drawn and then maintained at −20°C at the central laboratory until further analysis. First thaw process after the initial freeze was completed for this study. Only samples with a minimum of 2 mL of serum were included resulting in 465 patients with at least one, 417 with two or more, 396 with three or more, and 303 with all four 25(OH)D measurements (total of 1570 samples). Serum 25(OH)D was measured using an enzyme-linked immunosorbent assay (ELISA), which is sensitive down to 5.0 nmol/L (Immunodiagnostic Systems Inc., Fountain Hills, AZ). Quality control samples were included among the study samples and the average intraassay coefficient of variation (CV) derived from these samples was 4.4%. The average interassay CV was 11.7%.
Measurement of MS activity
The number of GELs on T1-weighted images from brain MRI scans performed at screening and months 3, 6, 9, 12, 18, 24 and then yearly in the follow-up study was used as a measure of MS activity. There were 1494 simultaneous 25(OH)D and MRI measurements at the CIS (baseline) and months 6, 12, and 24 (Fig. 1). MRI scans were performed as described previously.10,16
Figure 1.
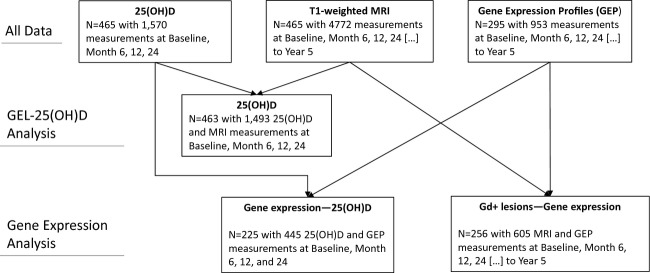
Flowchart of available data and size of data partitions used in the different analyses.
Gene expression
At baseline, month 2 or 3, month 12, and month 24 and yearly in the follow-up study, blood for analysis of mRNA expression was collected using the PAXgene system (PreAnalytiX GmbH, Hombrechtikon, Switzerland). Samples were also taken at CDMS if diagnosis occurred before month 24. Gene expression profiles of whole blood were measured using Affymetrix HGU 133 plus 2.0 (affymetrix, Santa Clara, CA, USA) arrays according to the manufacturer's protocol. Raw data were RMA robust multi-array analysis background corrected,17 quantile normalized,18 and transformed with a logarithm to base 2. Probe sets were mapped and summarized to their respective Ensembl gene ID using custom cdf “HGU133Plus2_Hs_ENSG” version 15.1.0 (downloaded from http://brainarray.mbni.med.umich.edu/Brainarray/Database/CustomCDF/15.1.0/ensg.asp, accessed 9 October 2012).19 Global gene expression profiles of ∼19,000 genes were available from 295 individuals; details on available data are shown in Figure 1 and Tables S1, S2.
Statistics
To model the number of GELs as a function of 25(OH)D levels (both as continuous and dichotomized [<50 nmol/L vs. ≥50 nmol/L] variables), IFNB-1b, and other covariates, generalized linear mixed models were applied using proc glimmix in SAS version 9.2 (Cary, NC, USA), which account for the within-person correlation of the repeated measurements. A compound symmetry structure was used to model these correlations. Estimators were exponentiated to give risk ratios (RR). To determine whether 25(OH)D or IFNB-1b was associated with gene expression, generalized linear models were used to model gene expression as a function of 25(OH)D levels, or IFNB-1b, adjusting for age, sex, treatment at the time of 25(OH)D measurement, and the interaction of 25(OH)D level and IFNB-1b. All time points were analyzed together in order to reflect and capture the time-dynamic variation of mRNA and maximize the power of the analysis. The genes that were identified as having expression significantly related to levels of 25(OH)D made up the gene set we named “MS_vitD_genes0.05.” Generalized linear models were also used to model GEL count as a function of gene expression to determine the gene set associated with GEL count. To correct for multiple testing, the Benjamini and Hochberg20 or Bonferroni21 methods were used. For both, a threshold of P ≤ 0.05 was considered statistically significant. R version 2.15.0 was used for all the analyses related to gene expression.
Gene set analysis
Gene Set Enrichment Analysis (GSEA) was done with the JAVA implementation of the GSEA preranked tool, as described previously.22 Briefly, GSEA is a weighted modification of the Kolmogorov–Smirnov test, testing whether the distribution of test scores within a specific gene set significantly differs from the null distribution. Previously published gene sets for comparison were identified from the Molecular Signatures Database version 3.1,22 by searching for genes annotated with the gene ontology (GO) terms GO:0071305 – cellular response to vitamin D; GO:0070563 – negative regulation of VDR signaling pathway; GO:0070564 – positive regulation of VDR signaling pathway; GO:0070562 – regulation of VDR signaling pathway; or GO:0070561 – VDR signaling pathway and from two recently published studies on VDR-mediated gene expression.23,24 A description of each 25(OH)D gene set identified and their respective references are in Table 1. Gene-specific beta estimators quantifying the association of a particular gene with GEL count or the association of 25(OH)D level or IFNB-1b with expression of a particular gene, estimated from the general linear models described above, were used as input vectors in the GSEA tool. For functional gene classification, the Database for Annotation, Visualization, and Integrated Discovery (DAVID)25 was used as follows: the Affymetrix HGU Plus 2.0 platform was selected as background and default DAVID gene sets were tested with the exception of “Functional_Categories” and “Protein_Domains.”
Table 1.
Association of 25(OH)D target gene sets with either 25(OH)D, IFNB-1b treatment or Gd-enhancing lesions in BENEFIT, as determined by GSEA
| Association with 25(OH)D | Association with IFNB-1b | Association with GELs | |||||
|---|---|---|---|---|---|---|---|
| Gene set name | Description | NES | p/FDR-q value1 | NES | p/FDR-q value1 | NES | p/FDR-q value1 |
| KnightUp [2010] | Genes that are bound and upregulated by the 25(OH)D receptor2 | 2.09 | 0.000/0.000 | 2.46 | 0.000/0.000 | −1.96 | 0.000/0.004 |
| MS_vitD_genes0.05 Munger et al. | BENEFIT gene expression profiles3 | 2.08 | 0.000/0.000 | 2.21 | 0.000/0.000 | −2.83 | 0.000/0.000 |
| STAMBOLSKY_RESPONSE_TO_VITAMIN_D3_UP [2010] | Genes induced in SKBR3 cells by 25-hydroxyvitamin D34 | 1.58 | 0.006/0.038 | 1.47 | 0.039/0.102 | 1.15 | 0.236/0.417 |
| CarlbergUp [2011] | Genes that are bound and upregulated by the 25(OH)D receptor5 | 1.54 | 0.004/0.040 | −1.06 | 0.357/0.710 | 0.64 | 0.974/0.961 |
| BIOCARTA_VDR_PATHWAY [2005] | Control of Gene Expression by Vitamin D Receptor6 | 1.44 | 0.088/0.087 | −0.93 | 0.557/0.804 | −0.84 | 0.654/0.983 |
| 25(OH)D_GO_associated_genes [2009] | Genes annotated for GO terms related to Vitamin D | 1.36 | 0.121/0.118 | 1.42 | 0.102/0.104 | 0.92 | 0.581/0.742 |
| V$DR3_Q4 [2005] | Genes with promoter regions containing the motif RRTGNMCYTNNTGAMCCNYNT7 | 1.01 | 0.435/0.720 | −0.77 | 0.947/0.844 | 1.16 | 0.207/0.527 |
| V$VDR_Q3 [2005] | Genes with promoter regions containing the motif GGGKNARNRRGGWSA8 | 0.99 | 0.500/0.672 | −1.07 | 0.267/1.000 | 1.44 | 0.002/0.205 |
| V$VDR_Q6 [2005] | Genes with promoter regions containing the motif CNSNNTGAACCN9 | 0.85 | 0.828/0.897 | 0.71 | 0.978/0.897 | 1.25 | 0.067/0.469 |
| STAMBOLSKY_RESPONSE_TO_VITAMIN_D3_DN [2010] | Genes repressed in SKBR3 cells (breast cancer) by 25-hydroxyvitamin D310 | 0.77 | 0.814/0.953 | 1.03 | 0.418/0.578 | 1.15 | 0.301/0.345 |
25(OH)D, 25-hydroxyvitamin D; IFNB-1b, interferon beta-1b; BENEFIT, Betaferon/Betaseron in Newly Emerging For Initial Treatment; GSEA, Gene Set Enrichment Analysis; FDR, false discovery rate; GELs, gadolinium-enhancing lesions; NES, normalized enrichment score.
FDR < 0.1 designated as statistically significant in GSEA analyses.36
Set derived from Ramagopalan et al.: 25(OH)D receptor ChIP-Seq and GEP in lymphoblastoid cell line after stimulation with calcitriol for 36 h → identification of genes that are bound and upregulated by the 25(OH)D receptor.
Set derived from BENEFIT gene expression profiles and 25(OH)D data from the model GeneExpression∼25(OH)D*IFNß+covariates. To enter the set, the particular gene had to have a nominal P-value of ≤0.05.
Genes induced in SKBR3 cells by 25-hydroxyvitamin D3. From Broad Institute MSigDB v3.1.
Set derived from Heikkinen et al. 25(OH)D receptor ChIP-Seq after 40-min stimulation with calcitriol and gene expression profiling after 4-h stimulation with calcitriol in THP-1 monocytic leukemia cells followed by the identification of genes that are bound and upregulated by the 25(OH)D receptor.
Control of Gene Expression by Vitamin D Receptor. From Broad Institute MSigDB v3.1, derived from Biocarta.
Genes with promoter regions [−2 kb, 2 kb] around transcription start site containing the motif RRTGNMCYTNNTGAMCCNYNT which matches annotation for VDR: vitamin D (1,25- dihydroxyvitamin D3) receptor. From Broad Institute MSigDB v3.1.
Genes with promoter regions [−2 kb, 2 kb] around transcription start site containing the motif GGGKNARNRRGGWSA which matches annotation for VDR: vitamin D (1,25- dihydroxyvitamin D3) receptor. From Broad Institute MSigDB v3.1.
Genes with promoter regions [−2 kb, 2 kb] around transcription start site containing the motif CNSNNTGAACCN which matches annotation for VDR: vitamin D (1,25- dihydroxyvitamin D3) receptor. From Broad Institute MSigDB v3.1.
Genes repressed in SKBR3 cells (breast cancer) by 25-hydroxyvitamin D3. From Broad Institute MSigDB v3.1.
Promoter analysis
Using the Multiple Em for Motif Elicitation (MEME) Suite of motif-based sequence analysis tools,26 two vitamin D-responsive elements (VDRE) positional weighted matrices (PWMs) were inferred from VDR-ChIP sequencing data recently published by Heikkinen et al.23 and Ramagopalan et al.24 (see Fig. S1). Subsequently, we used the Find Individual Motif Occurrences (FIMO) tool with the inferred VDRE PWMs, the VDRE PWM available from the JASPAR database (ID MA0074.1),27 and the consensus Interferon Stimulated Response Element (ISRE) PWM published by Levy et al.,28 to screen for either of these motifs with a P-value detection threshold of 10−4 in the upstream sequences database provided by FIMO. Of note, all three VDRE PWMs are highly similar. However, we screened for all three of them, since this will somewhat account for natural and context-dependent variability of the PWM which is not reflected using point estimates of base frequencies. Using the hypergeometric distribution, we then computed the probability of finding a particular count of VDRE and/or ISRE binding sites in the upstream sequences of the derived 25(OH)D, IFNB-1b and GEL-associated genes given the sites genome-wide background distribution.
Results
Basic characteristics of patients with at least one 25(OH)D measurement are shown in Table 2. 25(OH)D levels by visit are shown in Table 3. The comparison of 25(OH)D levels in patients on IFNB-1b versus placebo at months 6, 12, and 24 did not reveal significant differences between treatment arms. As to be expected, the number of GELs was higher at baseline as compared to the postbaseline visits, with more GELs in the placebo group compared with the IFNB-1b-treated group (Table S3). This difference gradually decreased from months 6 to 24, likely due, in part, to the design of the BENEFIT study which allowed for switching of patients with CDMS in the placebo group to IFNB-1b treatment.
Table 2.
Basic characteristics of the cohort of patients from BENEFIT with at least one 25(OH)D measurement
| Characteristic | Value |
|---|---|
| N | 465 |
| Age, years ± SD | 31.3 ± 7.5 |
| Female sex, n (%) | 329 (71) |
| Number of patients with at least 1 GEL at the CIS, n (%) | 196 (42) |
| Number of patients with at least 1 GEL during the first 24 months, n (%) | 262 (56) |
| IFNB-1b treatment at day 1, n (%) | 0 (0) |
| IFNB-1b treatment at month 24, n (%) | 303 (78) |
BENEFIT, Betaferon/Betaseron in Newly Emerging For Initial Treatment; 25(OH)D, 25-hydroxyvitamin D; SD, standard deviation; GEL, gadolinium-enhancing lesion; CIS, clinically isolated syndrome; IFNB-1b, interferon beta-1b.
Table 3.
Risk for GELs by 25(OH)D level
| N | Mean | Median (IQR) | |
|---|---|---|---|
| 25(OH)D levels | |||
| All | 15721 | 49.53 (22.97) | 45.34 (33.43–62.04) |
| Baseline | 457 | 45.87 (17.93) | 43.70 (31.55–56.46) |
| Month 6 | 359 | 48.83 (20.14) | 46.65 (34.50–60.64) |
| Month 12 | 349 | 43.38 (20.26) | 38.25 (29.17–55.08) |
| Month 24 | 386 | 60.30 (28.71) | 54.04 (39.02–76.20) |
| GEL count2 | |||
| All | 1493 | 0.89 (2.48) | 0.00 (0.00–1.00) |
| Baseline | 453 | 1.48 (3.38) | 0.00 (0.00–1.00) |
| Month 6 | 323 | 0.73 (2.17) | 0.00 (0.00–0.00) |
| Month 12 | 346 | 0.66 (1.88) | 0.00 (0.00–1.00) |
| Month 24 | 371 | 0.51 (1.68) | 0.00 (0.00–0.00) |
| 50 nmol/L increase in 25(OH)D | ≥50 nmol/L vs. <50 nmol/L | ||
|---|---|---|---|
| Unadjusted | Adjusted3 | Adjusted3 | |
| Relative risk of GEL by 25(OH)D level, RR [95% CI], P value | |||
| All | 0.45 [0.32–0.65], P < 0.0001 | 0.43 [0.28–0.66], P = 0.0001 | 0.61 [0.44–0.83], P = 0.002 |
| Baseline | 0.39 [0.30–0.49], P < 0.0001 | 0.38 [0.30–0.49], P < 0.0001 | – |
| Month 6 | 0.66 [0.47–0.93], P = 0.02 | 0.29 [0.17–0.50], P < 0.0001 | – |
| Month 12 | 0.65 [0.45–0.92], P = 0.02 | 0.99 [0.51–1.92], P = 0.99 | – |
| Month 24 | 0.70 [0.53–0.93], P = 0.01 | 1.03 [0.57–1.87], P = 0.91 | – |
GEL, gadolinium-enhancing lesion; 25(OH)D, 25-hydroxyvitamin D; IQR, interquartile range; RR, risk ratios.
Note that some 25(OH)D measurements were taken from samples from visits other than baseline, Months 6, 12, or 24. These were excluded from further analysis.
Note that only T1 scans are stated for which a 25(OH)D measurement was available.
Models were adjusted for age at time of measurement, gender, treatment, and the interaction of treatment and 25(OH)D level.
Number of GELs shows inverse association with 25(OH)D levels
An increase of 25(OH)D levels by 50 nmol/L was associated with a statistically significantly lower GEL count (Table 3). Adjusting for gender, age, treatment, and treatment-25(OH)D interaction, the results were unchanged. Similar results were seen when using dichotomized 25(OH)D levels (i.e., groups with 25(OH)D < 50 nmol/L and ≥50 nmol/L, respectively) in the respective model. Significant associations between GEL counts and 25(OH)D levels were also observed when visits were analyzed separately, with the lowest RR for the baseline visit, which had the highest number of GELs and occurred prior to start of IFNB-1b treatment (Table 3). GEL count as a function of 25(OH)D level is shown in Figure S2.
25(OH)D and IFNB-1b systemically regulate 25(OH)D target gene sets
Among BENEFIT participants, the expression of 63 genes was found to be regulated by 25(OH)D based on a nominal P-value threshold of 0.05 (Table S4). However, none of these genes remained statistically significant after false discovery rate (FDR) correction for multiple testing with a P-value threshold of 0.05. These 63 genes made up the 25(OH)D BENEFIT gene set (gene set “MS_vitD_genes0.05” in Table 1). Of note, one of these genes is sphingosine-1-phosphate phosphatase 1 (SGPP1), an enzyme that catalyzes the degradation of sphingosine-1-phosphate (S1P), the substrate for S1P receptors which are a prominent therapeutic target in MS.29,30
The pairwise overlap of the BENEFIT gene set with other 25(OH)D gene sets (see Subjects and Methods and Table 1) was negligibly small (in most cases less than 10%), which supports recent findings that 25(OH)D may regulate a large number of genes and diverse processes in a highly context-dependent manner.24,31–34 By GSEA testing of these 25(OH)D target gene sets, it was determined that the experimentally derived 25(OH)D gene sets (Ramagopalan et al.24 and Stambolsky et al.34) were highly enriched (FDR < 0.05). As all normalized enrichment scores (NES measures the magnitude and direction of a gene set association with the response) were in the positive range, this is indicative of a broad and systemic gene expression upregulation mediated by 25(OH)D (Table 1).
Considering that the rather weak impact of 25(OH)D on single genes (none remained statistically significant after FDR correction) may have been influenced by IFNB-1b-induced gene expression in the BENEFIT cohort, the magnitude of association between all genes and IFNB-1b treatment was examined. This analysis detected 770 genes that were significantly associated with IFNB-1b treatment (Table S5). Sixty-two (98%) of the 63 25(OH)D-associated genes were also significantly associated with IFNB-1b treatment. GSEA analysis of the systemic association of IFNB-1b-induced gene expression with gene sets known to be regulated by 25(OH)D showed that the experimentally derived 25(OH)D target genes sets (MS_vitD_genes0.05, KnightUp,24 and Stambolsky_response_to_vitamin_D3_up34) were highly associated with IFNB-1b gene induction (FDR ≤ 0.1), (Table 1) supporting the hypothesis that a subset of 25(OH)D target genes are coregulated by IFNB-1b in an additive manner.
Genes and gene sets regulated by 25(OH)D are associated with reduction of GELs
Given the association between high 25(OH)D levels with low GEL count, genes regulated by 25(OH)D were examined with respect to their impact on regulating GELs. This could provide a systemic rationale for building a mechanistic model of how 25(OH)D influences MS activity. Modeling GELs as function of gene expression, we found that more than 5000 genes were associated with GEL count (see Table S6 for the top 347 significant genes remaining after Bonferroni adjustment of P-values), and there was overlap with more than 50% of the 25(OH)D-associated genes, as well as 65% of IFNB-1b-associated genes (Fig. 2A). The vast majority of 25(OH)D-associated genes were regulated in such a way by 25(OH)D that would, in turn, reduce GEL count (Fig. 2B–E).
Figure 2.
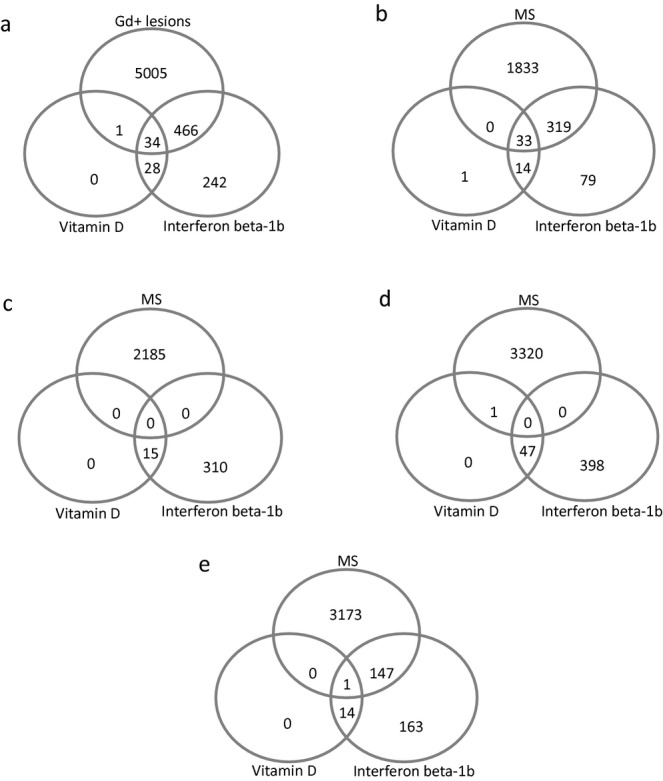
IFNB-1b and 25(OH)D-regulated genes are additionally associated with regulating the count of Gd-enhancing lesions. (A) Venn diagram depicting the overlap between genes that are associated with Gd-enhancing lesions, 25(OH)D or IFNB-1b. (B) Genes whose induction is associated with a reduction of Gd lesion count and which are upregulated through 25(OH)D and IFNB-1b. (C) Genes whose induction is associated with a reduction of Gd lesion count and which are downregulated through 25(OH)D and IFNB-1b. (D) Genes whose induction is associated with an increase of Gd lesion count and which are upregulated through 25(OH)D and IFNB-1b. (E) Genes whose induction is associated with an increase in Gd lesion count and which are downregulated through 25(OH)D and IFNB-1b. IFNB-1b, interferon beta-1b; 25(OH)D, 25-hydroxyvitamin D.
GSEA was performed and revealed that the BENEFIT 25(OH)D gene set (MS_vitD_genes0.05) as well as the KnightUp gene set24 were highly associated with GEL count in such a manner that the upregulation of these gene sets would result in a reduction of GEL count (Table 1).
VDRE and ISRE motifs are enriched in genes associated with 25(OH)D and GELs
Modeling GEL count-related gene expression as a function of 25(OH)D does not provide causal evidence for a relationship and the overlap between 25(OH)D- and IFNB-1b-associated genes may be purely correlative. If there is a causal relationship of these compounds to the genes they putatively regulate, appropriate regulatory elements (namely, VDR response element VDRE and ISRE sites) should be enriched in the promoter regions of the respective genes. Hence, a genome-wide screen with different VDRE and ISRE PWMs using the FIMO tool provided by the MEME suit was conducted.
With respect to the VDRE, these analyses revealed that 8679 of 43267 (Ensembl GRCh37.p10, February 2009 assembly, April 2013 Genebuild) coding and non-coding genes have either of the VDR binding sites present in the sequences upstream of their transcription start site (TSS). This goes well along with the fact that 25(OH)D-mediated VDR activation has been shown to result in a plethora of target genes being regulated.35 Based on this analysis, it was determined that 36 of the 63 genes associated with 25(OH)D in BENEFIT contained at least one VDRE and hence there was a significant enrichment of this regulatory element in the MS_vitD_genes0.05 gene set (P = 0.0012). This indicates that a substantial part of the 25(OH)D-associated genes may directly be regulated by this secosteroid and implies indirect 25(OH)D-mediated regulation of the remaining 27 genes or the presence of regulatory elements in regions that were not included in the analysis (e.g., within exons or introns, the 5′ or 3′ UTR).31 Importantly, 25(OH)D-associated genes in the MS_vitD_genes0.05 gene set also showed significant enrichment for the ISRE motif (P = 0.0009) and additionally the combination of both sites was overrepresented in 25(OH)D-associated genes (P = 0.002). This was in line with the finding that there was a substantial overlap of genes associated with 25(OH)D and genes that were associated with IFNB-1b treatment. For these analyses, FDR values were within the 0.1 cutoff designated as statistically significant in GSEA documentation.36
Next, enrichment for VDRE and ISRE motifs in genes that were significantly associated with GELs was determined. FIMO-based analyses of the upstream sequences of the top genes associated with MS activity revealed that 155 of 347 screened genes contained at least one VDRE motif (P = 0.014) in the sequence upstream of their TSS, 204 contained an ISRE motif (P = 3.8 × 10⁻¹⁷), and 101 contained both a VDRE and ISRE motif (P = 2.5 × 10⁻⁶), suggesting a significant enrichment of these sites by themselves and in combination of MS activity-associated genes.
25(OH)D-regulated and GEL-associated genes are functionally enriched for regulation of immune system processes
To complement the single-gene analysis, the biological processes that were regulated by genes that were associated with 25(OH)D in the context of MS activity were inferred. The 63 genes associated with 25(OH)D were analyzed for enrichment of predefined biological terms using DAVID.25 The most prominent enrichment cluster represented gene sets connected to immune responses to pathogens (Table 4). The terms “defense response to bacterium” and “defense response” were detected with nominal P-values of 3.9 × 10⁻⁵ and 8.2 × 10⁻⁵, respectively. As expected, the top enrichment cluster for IFNB-1b-associated genes also included the term “defense response” (P = 1.1 × 10⁻¹⁰) among other immune system related terms.
Table 4.
DAVID enrichment analysis
| Term | P-value | Adjusted1 P-value |
|---|---|---|
| 25(OH)D-associated genes | ||
| Defense response to bacterium | <0.001 | 0.024 |
| Defense response | <0.001 | 0.026 |
| Response to bacterium | <0.001 | 0.130 |
| Serine-type endopeptidase activity | <0.001 | 0.022 |
| Serine-type peptidase activity | <0.001 | 0.022 |
| IFNB-1b-associated genes | ||
| Defense response | <0.001 | <0.001 |
| Response to wounding | <0.001 | <0.001 |
| Inflammatory response | <0.001 | <0.001 |
| Regulation of apoptosis | <0.001 | 0.004 |
| Regulation of programmed cell death | <0.001 | 0.005 |
| GEL-associated genes | ||
| Defense response | <0.001 | 0.001 |
| Inflammatory response | <0.001 | 0.095 |
| MHC class I protein complex | <0.001 | 0.100 |
| Antigen processing and presentation | <0.001 | 0.140 |
| Regulation of I-kappaB kinase/NF-kappaB cascade | <0.001 | 0.140 |
DAVID, Database for Annotation, Visualization and Integrated Discovery; 25(OH)D, 25-hydroxyvitamin D; IFNB-1b, interferon beta-1b; GEL, gadolinium-enhancing lesions; MHC, major histocompatibility complex.
FDR corrected using the Benjamini and Hochberg (BH) adjustment.20
For GEL count-associated genes, the three most prominent enrichment clusters were all attributable to processes and pathways of the immune system (inflammatory responses, antigen presentation, and NF-kB signaling). The term “defense response” which was also associated with 25(OH)D-associated genes was detected with a P-value of 2 × 10⁻⁶. These findings indicate that 25(OH)D regulates processes that are important for the regulation of MS activity.
The 25(OH)D gene interaction network is a component of the MS activity gene interaction network
In order to gain deeper insight into regulatory interactions and associations between the genes found to be associated with GELs and/or 25(OH)D, these two gene sets were analyzed using the Search Tool for the Retrieval of Interacting Genes/Proteins (STRING).37 In case of the 25(OH)D-associated genes (Fig. 3A), there is one major connected component centered around lactotransferrin (LTF), an iron-binding protein that plays a major role in immune processes.38 Various genes in this component connected the 25(OH)D system to the IFNB-1b system (e.g., LTF and ELANE). There was a second connected component centered around “interferon-induced protein with tetratricopeptide repeats 1” (IFIT1) which was placed in the central hub-part of the network of genes associated with GELs. This MS network was characterized by a large and densely connected hub component that was particularly enriched for genes connected to interferon response (Fig. 3B).
Figure 3.

25(OH)D and MS activity gene interaction networks. The Search Tool for the Retrieval of Interacting Genes/Proteins (STRING) was used to visualize knowledge-based connectivity of genes being associated with 25(OH)D levels (A) or Gd-enhancing lesion count (B). Thickness of lines is proportional to the probability of a true interaction of any pair of genes. 25(OH)D, 25-hydroxyvitamin D; MS, multiple sclerosis.
Discussion
In this large, cross-sectional study of participants in the BENEFIT trial, GEL count was inversely associated with 25(OH)D levels, with every 50 nmol/L increase in 25(OH)D being associated with a 55% decreased GEL rate, although we cannot rule out confounding by other factors that vary with season such as infections. Of note, seasonal variation of GELs and inverse associations with 25(OH)D levels have been previously reported.5,6,39–41
An important gap in the current knowledge is how 25(OH)D may act on a molecular level to influence GEL development. While previous studies have examined the expression of specific 25(OH)D-related genes in patients with MS42,43 and numerous studies on gene expression in MS have been conducted,44–47 this is the first study to scrutinize the relationship between 25(OH)D-driven gene expression and MS activity (as assessed by the number of GELs) over a period of up to 2 years. The results show that even in a cohort such as BENEFIT, with rather low 25(OH)D levels, 25(OH)D exerts systemic gene expression regulation on bona fide 25(OH)D target gene sets derived from lymphocyte and monocyte backgrounds.23 Although on the single gene level, 25(OH)D effects are relatively minor, the results show that this secosteroid is an important systemic factor in that its levels regulate many genes in a subtle fashion which in their sum are important modulators of gene regulatory networks crucial in influencing MS activity.
The analysis of 25(OH)D gene set association with 25(OH)D levels showed strong gene set upregulation, this being suggestive of a context-dependent systemic role of 25(OH)D in reducing GEL count by regulating whole gene sets to jointly influence and tune a variety of biological processes. Of note, this effect appears to be in addition to that of the IFNB-1b treatment-induced gene expression changes, which are known to reduce GEL count10,48 and whose effects have been well described in other studies.44,49,50
Interestingly, some of the 25(OH)D target gene sets are highly significantly associated with reducing GEL count, an effect that is independent of IFNB-1b treatment. This effect is also found when looking at the single genes that are associated with 25(OH)D levels, supporting an additive effect of both 25(OH)D and IFNB-1b in that they reduce GEL count more effectively in combination. Additionally, overrepresentation of VDRE and ISRE motifs in these genes and generally in genes associated with GEL count provides evidence of a mechanistic link. In line with this, the genes associated with 25(OH)D were predominantly associated with immune regulatory processes (in agreement with a recent publication by Satoh and Tabunoki),51 which are also prominently associated with MS and IFNB-1b treatment.44,45,47 One potential mechanism leading to a suppression of MS activity by 25(OH)D could be the S1P receptor-dependent migration of lymphocytes from secondary lymphoid tissues because higher 25(OH)D levels were associated with the expression of SGPP1, a gene that encodes for an enzyme that catalyzes the degradation of S1P. Depriving the S1P receptor of its' normal substrate has been shown to be an effective therapeutic strategy in MS.29,30
25(OH)D involvement in gene expression is known to be context dependent and there are numerous levels at which the mode of action and the magnitude of its effects are fine tuned. Not only does the VDR interact with retinoid X receptor and other cotranscription factors,34 but its expression and the levels of 25(OH)D metabolizing enzymes such as CYP24A1 are also regulated by tightly tuned feedback loops that may be modified by different allelic variants of the molecules involved.52–54 This is also reflected by the quantity of potential 25(OH)D target genes identified in different studies which show only minimal overlap.51 Accordingly, effects of 25(OH)D can be very contrary, reaching from being a proapoptotic agent to being cytoprotective.34 Whereas this study provides evidence that the latter is the case for MS, this ambiguous role of 25(OH)D warrants mechanistic studies of VDR target genes tuning in patients with MS.
As a consequence, these may be used as therapeutic targets that are tunable by 25(OH)D supplementation and that could be a booster of IFNB-1b treatment efficacy.
It is a particular strength of this study that rigorously controlled MRI findings from a clinical trial which was set up to obtain regulatory approval for the use of IFNB-1b in patients with a CIS were used. These data are the first to link disease activity with 25(OH)D-related molecular mechanisms in patients with MS. Because MRI examinations, 25(OH)D measurements, and gene expression profiling were frequently performed simultaneously within the first 2 years of our study, actual inflammatory activity of the disease could be related to 25(OH)D levels and gene expression profiles at the same time point in a cross-sectional manner.
Limitations of this study shall also be addressed. First, expression profiling was performed in whole blood, as the selection of peripheral blood monocytes (or even more specific lymphocyte populations) was not feasible in a multicenter study. This certainly added noise to the findings and it might well be that stronger and more distinct gene expression profiles could have been obtained if more specific cell populations were analyzed. Second, this study focused on gene expression analyses in the cohort treated with IFNB-1b right after CIS; only a limited number of samples obtained under placebo treatment could be included. Therefore, the impact of IFNB-1b on gene expression profiles was largely based on the difference between baseline and postbaseline samples in the early IFNB-1b cohort and, as the baseline sample was obtained right after the CIS, the impact of the first event could be present in those analyses. Nevertheless, the effect of IFNB-1b treatment on the observed gene expression profiles was well in line with published evidence.44,45,47 Third, vitamin D level was only measured at fixed time points (baseline, months 6, 12, and 24), and not at the time of relapses. Relapses at the fixed time points were only observed occasionally. Therefore, the power to compare vitamin-D-related gene expression during relapses and relapse-free periods was too low to perform meaningful analyses. Fourth, although the present analysis suggests a direct effect of 25(OH)D on genes associated with GELs, the possibility of non-VDR-mediated effects that would be associated with increased 25(OH)D and 25(OH)D-associated gene expression, such as ultraviolet light exposure, cannot be excluded and could have independently affected GEL development via non-25(OH)D-related pathways. Finally, almost all patients in this study were whites of European ancestry and the majority of participants were eventually treated with IFNB-1b (although uniform treatment is an important advantage), thus limiting generalizations to individuals of other races or ethnicities or to patients treated with different drugs.
In summary, by analyzing the gene expression, this study identified the first molecular evidence that immunological effects of 25(OH)D impact disease activity in patients with very early MS. These findings should be deepened by the investigation of more specific lymphocyte subsets and extended to populations in the later stages of the disease. Furthermore, biological validation of these results is warranted.
Acknowledgments
We are grateful to the patients and the BENEFIT investigators for their continuing contributions to the study. Additionally, Robert C. Ristuccia, Ph.D. (Precept Medical Communications) provided medical writing assistance that was funded by Bayer HealthCare Pharmaceuticals in preparing the manuscript and Leslie Unger at the Harvard School of Public Health provided technical assistance.
Conflict of Interest
Dr. Ascherio reports grants from the National Institutes of Health and grants from the National Multiple Sclerosis Society during the conduct of the study. Dr. Munger reports grants from National Institutes of Health during the conduct of the study. Dr. EDAN reports grants and personal fees from Merck Serono, Teva Pharma, personal fees from Biogenidec, grants and personal fees from Novartis, personal fees from Sanofi, outside the submitted work.Dr. Freedman reports grants from Bayer Healthcare, during the conduct of the study; personal fees from BiogenIdec, Novartis, Sanofi, Genzyme, Opexa, Teva,outside the submitted work. Dr. Köchert reports personal fees from Bayer HealthCare, during the conduct of the study.Dr. Miller reports grants from MS Society of Great Britain & Northern Ireland, grants from UCL/UCLH Biomedical Research Centre, during the conduct of the study; grants and other from Biogen Idec, grants and other from Novartis, grants and other from GlaxoSmithKline, grants from NIHR, grants from US National Multiple Sclerosis Society & MS Society of GB & NI, other from Bayer Schering, other from Mitsubishi Pharma Ltd, other from Merck, other from Chugai, personal fees from McAlpines Multiple Sclerosis, 4th edition,outside the submitted work. Dr. MONTALBAN reports personal fees from XAVIER MONTALBAN, during the conduct of the study; personal fees from ALMIRALL,BAYER,BIOGEN IDEC,MERCK,GENENTECH,GENEURO,GENZYME,NEUROTEC,NOVARTIS,SANOFI,TEVA,GSK, and ROCHE outside the submitted work. D Pleimes was a salaried employee of Bayer Pharma AG/Bayer HealthCare Pharmaceuticals. DP owns stock in Bayer AG, the owner of Bayer Pharma AG/Bayer HealthCare Pharmaceuticals. Dr. Pohl is employee of Bayer Pharma AG. Dr. Polman reports grants and personal fees from Bayer Schering, during the conduct of the study; grants and personal fees from Biogen Idec, personal fees from Glaxo Smith Kline, grants and personal fees from Merck Serono, personal fees from MorphoSys, Receptos, grants and personal fees from Novartis, grants from TEVA, grants and personal fees from UCB, outside the submitted work. Dr. Sandbrink reports personal fees from Bayer Pharma AG/Bayer HealthCare, during the conduct of the study; personal fees from Bayer Pharma AG/Bayer HealthCare, outside the submitted work.
Supporting Information
Additional Supporting Information may be found in the online version of this article:
Figure S1. VDR positional weight matrices (PWMs) inferred from different cell line ChIP Seq experiments and the Jasper database.
Figure S2. GEL count as a function of 25(OH)D levels.
Table S1. Number of individuals for which gene expression data concomitantly measured with 25(OH)D or GELs, by treatment status and time.
Table S2. Number of genes significantly associated with the stated effects.
Table S3. Characteristics of patients by IFNB-1b treatment assignment.
Table S4. Genes whose regulation was significantly associated with 25(OH)D levels (nominal P ≤ 0.05).
Table S5. Genes whose regulation was significantly associated with regulation by IFNB-1b (Bonferroni corrected P ≤ 0.05).
Table S6. Genes that were associated with the number of GELs (Bonferroni-corrected P ≤ 0.05).
References
- 1.Ascherio A, Munger KL, Lunemann JD. The initiation and prevention of multiple sclerosis. Nat Rev Neurol. 2012;8:602–612. doi: 10.1038/nrneurol.2012.198. [DOI] [PMC free article] [PubMed] [Google Scholar]
- 2.Mowry EM, Krupp LB, Milazzo M, et al. Vitamin D status is associated with relapse rate in pediatric-onset multiple sclerosis. Ann Neurol. 2010;67:618–624. doi: 10.1002/ana.21972. [DOI] [PubMed] [Google Scholar]
- 3.Runia TF, Hop WC, de Rijke YB, et al. Lower serum vitamin D levels are associated with a higher relapse risk in multiple sclerosis. Neurology. 2012;79:261–266. doi: 10.1212/WNL.0b013e31825fdec7. [DOI] [PubMed] [Google Scholar]
- 4.Simpson S, Jr, Taylor B, Blizzard L, et al. Higher 25-hydroxyvitamin D is associated with lower relapse risk in multiple sclerosis. Ann Neurol. 2010;68:193–203. doi: 10.1002/ana.22043. [DOI] [PubMed] [Google Scholar]
- 5.Mowry EM, Waubant E, McCulloch CE, et al. Vitamin D status predicts new brain magnetic resonance imaging activity in multiple sclerosis. Ann Neurol. 2012;72:234–240. doi: 10.1002/ana.23591. [DOI] [PMC free article] [PubMed] [Google Scholar]
- 6.Soilu-Hanninen M, Aivo J, Lindstrom BM, et al. A randomised, double blind, placebo controlled trial with vitamin D3 as an add on treatment to interferon beta-1b in patients with multiple sclerosis. J Neurol Neurosurg Psychiatry. 2012;83:565–571. doi: 10.1136/jnnp-2011-301876. [DOI] [PubMed] [Google Scholar]
- 7.Burton JM, Kimball S, Vieth R, et al. A phase I/II dose-escalation trial of vitamin D3 and calcium in multiple sclerosis. Neurology. 2010;74:1852–1859. doi: 10.1212/WNL.0b013e3181e1cec2. [DOI] [PMC free article] [PubMed] [Google Scholar]
- 8.Holmoy T, Lossius A, Gundersen TE, et al. Intrathecal levels of vitamin D and IgG in multiple sclerosis. Acta Neurol Scand. 2012;125:e28–e31. doi: 10.1111/j.1600-0404.2011.01577.x. [DOI] [PubMed] [Google Scholar]
- 9.Pozuelo-Moyano B, Benito-Leon J, Mitchell AJ, et al. A systematic review of randomized, double-blind, placebo-controlled trials examining the clinical efficacy of vitamin D in multiple sclerosis. Neuroepidemiology. 2013;40:147–153. doi: 10.1159/000345122. [DOI] [PMC free article] [PubMed] [Google Scholar]
- 10.Kappos L, Polman CH, Freedman MS, et al. Treatment with interferon beta-1b delays conversion to clinically definite and McDonald MS in patients with clinically isolated syndromes. Neurology. 2006;67:1242–1249. doi: 10.1212/01.wnl.0000237641.33768.8d. [DOI] [PubMed] [Google Scholar]
- 11.Kappos L, Freedman MS, Polman CH, et al. Effect of early versus delayed interferon beta-1b treatment on disability after a first clinical event suggestive of multiple sclerosis: a 3-year follow-up analysis of the BENEFIT study. Lancet. 2007;370:389–397. doi: 10.1016/S0140-6736(07)61194-5. [DOI] [PubMed] [Google Scholar]
- 12.Kappos L, Freedman MS, Polman CH, et al. Long-term effect of early treatment with interferon beta-1b after a first clinical event suggestive of multiple sclerosis: 5-year active treatment extension of the phase 3 BENEFIT trial. Lancet Neurol. 2009;8:987–997. doi: 10.1016/S1474-4422(09)70237-6. [DOI] [PubMed] [Google Scholar]
- 13.Ascherio A, Munger KL, White R, et al. Vitamin D as an early predictor of multiple sclerosis activity and progression. JAMA Neurol. 2014;71:306–314. doi: 10.1001/jamaneurol.2013.5993. [DOI] [PMC free article] [PubMed] [Google Scholar]
- 14.Hewison M. Vitamin D and the immune system: new perspectives on an old theme. Endocrinol Metab Clin North Am. 2010;39:365–379. doi: 10.1016/j.ecl.2010.02.010. [DOI] [PMC free article] [PubMed] [Google Scholar]
- 15.Brex PA, Ciccarelli O, O'Riordan JI, et al. A longitudinal study of abnormalities on MRI and disability from multiple sclerosis. N Engl J Med. 2002;346:158–164. doi: 10.1056/NEJMoa011341. [DOI] [PubMed] [Google Scholar]
- 16.Nagtegaal GJ, Pohl C, Wattjes MP, et al. Interferon beta-1b reduces black holes in a randomised trial of clinically isolated syndrome. Mult Scler. 2014;20:234–242. doi: 10.1177/1352458513494491. [DOI] [PubMed] [Google Scholar]
- 17.Irizarry RA, Bolstad BM, Collin F, et al. Summaries of Affymetrix GeneChip probe level data. Nucleic Acids Res. 2003;31:e15. doi: 10.1093/nar/gng015. [DOI] [PMC free article] [PubMed] [Google Scholar]
- 18.Bolstad BM, Irizarry RA, Astrand M, et al. A comparison of normalization methods for high density oligonucleotide array data based on variance and bias. Bioinformatics. 2003;19:185–193. doi: 10.1093/bioinformatics/19.2.185. [DOI] [PubMed] [Google Scholar]
- 19.Dai M, Wang P, Boyd AD, et al. Evolving gene/transcript definitions significantly alter the interpretation of GeneChip data. Nucleic Acids Res. 2005;33:e175. doi: 10.1093/nar/gni179. [DOI] [PMC free article] [PubMed] [Google Scholar]
- 20.Benjamini Y, Hochberg Y. Controlling the false discovery rate: a practical and powerful approach to multiple testing. J R Stat Soc. 1995;51:289–300. [Google Scholar]
- 21.Bonferroni C. Il calcolo delle assicurazioni su gruppi di teste. Rome, Italy: 1935. pp. 13–60. Studi in Onore del Professore Salvator Ortu Carboni. [Google Scholar]
- 22.Subramanian A, Tamayo P, Mootha VK, et al. Gene set enrichment analysis: a knowledge-based approach for interpreting genome-wide expression profiles. Proc Natl Acad Sci USA. 2005;102:15545–15550. doi: 10.1073/pnas.0506580102. [DOI] [PMC free article] [PubMed] [Google Scholar]
- 23.Heikkinen S, Vaisanen S, Pehkonen P, et al. Nuclear hormone 1alpha,25-dihydroxyvitamin D3 elicits a genome-wide shift in the locations of VDR chromatin occupancy. Nucleic Acids Res. 2011;39:9181–9193. doi: 10.1093/nar/gkr654. [DOI] [PMC free article] [PubMed] [Google Scholar]
- 24.Ramagopalan SV, Heger A, Berlanga AJ, et al. A ChIP-seq defined genome-wide map of vitamin D receptor binding: associations with disease and evolution. Genome Res. 2010;20:1352–1360. doi: 10.1101/gr.107920.110. [DOI] [PMC free article] [PubMed] [Google Scholar]
- 25.Dennis G, Jr, Sherman BT, Hosack DA, et al. DAVID: Database for Annotation, Visualization, and Integrated Discovery. Genome Biol. 2003;4:3. [PubMed] [Google Scholar]
- 26.Bailey TL, Boden M, Buske FA, et al. MEME SUITE: tools for motif discovery and searching. Nucleic Acids Res. 2009;37:W202–W208. doi: 10.1093/nar/gkp335. [DOI] [PMC free article] [PubMed] [Google Scholar]
- 27.Bryne JC, Valen E, Tang MH, et al. JASPAR, the open access database of transcription factor-binding profiles: new content and tools in the 2008 update. Nucleic Acids Res. 2008;36:D102–D106. doi: 10.1093/nar/gkm955. [DOI] [PMC free article] [PubMed] [Google Scholar]
- 28.Levy DE, Kessler DS, Pine R, et al. Interferon-induced nuclear factors that bind a shared promoter element correlate with positive and negative transcriptional control. Genes Dev. 1988;2:383–393. doi: 10.1101/gad.2.4.383. [DOI] [PubMed] [Google Scholar]
- 29.Aktas O, Kury P, Kieseier B, et al. Fingolimod is a potential novel therapy for multiple sclerosis. Nat Rev Neurol. 2010;6:373–382. doi: 10.1038/nrneurol.2010.76. [DOI] [PubMed] [Google Scholar]
- 30.Mehling M, Johnson TA, Antel J, et al. Clinical immunology of the sphingosine 1-phosphate receptor modulator fingolimod (FTY720) in multiple sclerosis. Neurology. 2011;76:S20–S27. doi: 10.1212/WNL.0b013e31820db341. [DOI] [PubMed] [Google Scholar]
- 31.Handel AE, Sandve GK, Disanto G, et al. Vitamin D receptor ChIP-seq in primary CD4+ cells: relationship to serum 25-hydroxyvitamin D levels and autoimmune disease. BMC Med. 2013;11:163. doi: 10.1186/1741-7015-11-163. [DOI] [PMC free article] [PubMed] [Google Scholar]
- 32.Norman AW. Minireview: vitamin D receptor: new assignments for an already busy receptor. Endocrinology. 2006;147:5542–5548. doi: 10.1210/en.2006-0946. [DOI] [PubMed] [Google Scholar]
- 33.Norman AW. A vitamin D nutritional cornucopia: new insights concerning the serum 25-hydroxyvitamin D status of the US population. Am J Clin Nutr. 2008;88:1455–1456. doi: 10.3945/ajcn.2008.27049. [DOI] [PubMed] [Google Scholar]
- 34.Stambolsky P, Tabach Y, Fontemaggi G, et al. Modulation of the vitamin D3 response by cancer-associated mutant p53. Cancer Cell. 2010;17:273–285. doi: 10.1016/j.ccr.2009.11.025. [DOI] [PMC free article] [PubMed] [Google Scholar]
- 35.Holick MF. Vitamin D deficiency. N Engl J Med. 2007;357:266–281. doi: 10.1056/NEJMra070553. [DOI] [PubMed] [Google Scholar]
- 36.Broad Institute. Gene set enrichment analysis: GSEA user guide. Available at http://www.broadinstitute.org/gsea/GSEAUserGuide.pdf. Accessed 1 June 2014.
- 37.Franceschini A, Szklarczyk D, Frankild S, et al. STRING v9.1: protein-protein interaction networks, with increased coverage and integration. Nucleic Acids Res. 2013;41:D808–D815. doi: 10.1093/nar/gks1094. [DOI] [PMC free article] [PubMed] [Google Scholar]
- 38.Legrand D. Lactoferrin, a key molecule in immune and inflammatory processes. Biochem Cell Biol. 2012;90:252–268. doi: 10.1139/o11-056. [DOI] [PubMed] [Google Scholar]
- 39.Auer DP, Schumann EM, Kumpfel T, et al. Seasonal fluctuations of gadolinium-enhancing magnetic resonance imaging lesions in multiple sclerosis. Ann Neurol. 2000;47:276–277. [PubMed] [Google Scholar]
- 40.Killestein J, Rep MH, Meilof JF, et al. Seasonal variation in immune measurements and MRI markers of disease activity in MS. Neurology. 2002;58:1077–1080. doi: 10.1212/wnl.58.7.1077. [DOI] [PubMed] [Google Scholar]
- 41.Rovaris M, Comi G, Sormani MP, et al. Effects of seasons on magnetic resonance imaging-measured disease activity in patients with multiple sclerosis. Ann Neurol. 2001;49:415–416. [PubMed] [Google Scholar]
- 42.Smolders J, Thewissen M, Theunissen R, et al. Vitamin D-related gene expression profiles in immune cells of patients with relapsing remitting multiple sclerosis. J Neuroimmunol. 2011;235:91–97. doi: 10.1016/j.jneuroim.2011.03.012. [DOI] [PubMed] [Google Scholar]
- 43.Smolders J, Schuurman KG, van Strien ME, et al. Expression of vitamin D receptor and metabolizing enzymes in multiple sclerosis-affected brain tissue. J Neuropathol Exp Neurol. 2013;72:91–105. doi: 10.1097/NEN.0b013e31827f4fcc. [DOI] [PubMed] [Google Scholar]
- 44.Comabella M, Lunemann JD, Rio J, et al. A type I interferon signature in monocytes is associated with poor response to interferon-beta in multiple sclerosis. Brain. 2009;132:3353–3365. doi: 10.1093/brain/awp228. [DOI] [PubMed] [Google Scholar]
- 45.Gandhi KS, McKay FC, Cox M, et al. The multiple sclerosis whole blood mRNA transcriptome and genetic associations indicate dysregulation of specific T cell pathways in pathogenesis. Hum Mol Genet. 2010;19:2134–2143. doi: 10.1093/hmg/ddq090. [DOI] [PubMed] [Google Scholar]
- 46.Nickles D, Chen HP, Li MM, et al. Blood RNA profiling in a large cohort of multiple sclerosis patients and healthy controls. Hum Mol Genet. 2013;22:4194–4205. doi: 10.1093/hmg/ddt267. [DOI] [PMC free article] [PubMed] [Google Scholar]
- 47.van Baarsen LG, van der Pouw Kraan TC, Kragt JJ, et al. A subtype of multiple sclerosis defined by an activated immune defense program. Genes Immun. 2006;7:522–531. doi: 10.1038/sj.gene.6364324. [DOI] [PubMed] [Google Scholar]
- 48.Comi G, Filippi M, Barkhof F, et al. Effect of early interferon treatment on conversion to definite multiple sclerosis: a randomised study. Lancet. 2001;357:1576–1582. doi: 10.1016/s0140-6736(00)04725-5. [DOI] [PubMed] [Google Scholar]
- 49.Croze E, Yamaguchi KD, Knappertz V, et al. Interferon-beta-1b-induced short- and long-term signatures of treatment activity in multiple sclerosis. Pharmacogenomics J. 2013;13:443–451. doi: 10.1038/tpj.2012.27. [DOI] [PMC free article] [PubMed] [Google Scholar]
- 50.van Baarsen LG, Vosslamber S, Tijssen M, et al. Pharmacogenomics of interferon-beta therapy in multiple sclerosis: baseline IFN signature determines pharmacological differences between patients. PLoS One. 2008;3:e1927. doi: 10.1371/journal.pone.0001927. [DOI] [PMC free article] [PubMed] [Google Scholar]
- 51.Satoh J, Tabunoki H. Molecular network of chromatin immunoprecipitation followed by deep sequencing-based vitamin D receptor target genes. Mult Scler. 2013;19:1035–1045. doi: 10.1177/1352458512471873. [DOI] [PubMed] [Google Scholar]
- 52.Costa EM, Hirst MA, Feldman D. Regulation of 1,25-dihydroxyvitamin D3 receptors by vitamin D analogs in cultured mammalian cells. Endocrinology. 1985;117:2203–2210. doi: 10.1210/endo-117-5-2203. [DOI] [PubMed] [Google Scholar]
- 53.Prosser DE, Jones G. Enzymes involved in the activation and inactivation of vitamin D. Trends Biochem Sci. 2004;29:664–673. doi: 10.1016/j.tibs.2004.10.005. [DOI] [PubMed] [Google Scholar]
- 54.Zierold C, Darwish HM, DeLuca HF. Two vitamin D response elements function in the rat 1,25-dihydroxyvitamin D 24-hydroxylase promoter. J Biol Chem. 1995;270:1675–1678. doi: 10.1074/jbc.270.4.1675. [DOI] [PubMed] [Google Scholar]
Associated Data
This section collects any data citations, data availability statements, or supplementary materials included in this article.
Supplementary Materials
Figure S1. VDR positional weight matrices (PWMs) inferred from different cell line ChIP Seq experiments and the Jasper database.
Figure S2. GEL count as a function of 25(OH)D levels.
Table S1. Number of individuals for which gene expression data concomitantly measured with 25(OH)D or GELs, by treatment status and time.
Table S2. Number of genes significantly associated with the stated effects.
Table S3. Characteristics of patients by IFNB-1b treatment assignment.
Table S4. Genes whose regulation was significantly associated with 25(OH)D levels (nominal P ≤ 0.05).
Table S5. Genes whose regulation was significantly associated with regulation by IFNB-1b (Bonferroni corrected P ≤ 0.05).
Table S6. Genes that were associated with the number of GELs (Bonferroni-corrected P ≤ 0.05).