

Abstract
How general anesthetics cause loss of consciousness is unknown. Some evidence points toward effects on the neocortex causing “top-down” inhibition, whereas other findings suggest that these drugs act via subcortical mechanisms, possibly selectively stimulating networks promoting natural sleep. To determine whether some neuronal circuits are affected before others, we used Morlet wavelet analysis to obtain high temporal resolution in the time-varying power spectra of local field potentials recorded simultaneously in discrete brain regions at natural sleep onset and during anesthetic-induced loss of righting reflex in rats. Although we observed changes in the local field potentials that were anesthetic-specific, there were some common changes in high-frequency (20–40 Hz) oscillations (reductions in frequency and increases in power) that could be detected at, or before, sleep onset and anesthetic-induced loss of righting reflex. For propofol and natural sleep, these changes occur first in the thalamus before changes could be detected in the neocortex. With dexmedetomidine, the changes occurred simultaneously in the thalamus and neocortex. In addition, the phase relationships between the low-frequency (1–4 Hz) oscillations in thalamic nuclei and neocortical areas are essentially the same for natural sleep and following dexmedetomidine administration, but a sudden change in phase, attributable to an effect in the central medial thalamus, occurs at the point of dexmedetomidine loss of righting reflex. Our data are consistent with the central medial thalamus acting as a key hub through which general anesthesia and natural sleep are initiated.
Keywords: general anesthesia, midline thalamic nuclei, sleep
Introduction
Although significant progress has been made toward our understanding of how general anesthetics act at the molecular level (Rudolph and Antkowiak, 2004; Franks, 2008), much less is known about how anesthetics cause loss of consciousness at the level of neuronal networks (Alkire et al., 2008; Franks, 2008). Are some anatomical structures preferentially affected? Also, to what extent does anesthetic-induced loss of consciousness resemble natural sleep?
Almost all studies that have attempted to answer these questions have used imaging techniques and/or EEG measurements (mostly on humans). Key EEG signatures have been identified (Ku et al., 2011; Ní Mhuircheartaigh et al., 2013; Purdon et al., 2013) that are associated with loss of consciousness, and there is widespread agreement that functional connectivity between various parts of the brain is disrupted. However, there is no clarity as to which circuits are preferentially affected and which changes actually cause loss of consciousness (Velly et al., 2007; Boveroux et al., 2010; Mhuircheartaigh et al., 2010; Ku et al., 2011; Långsjö et al., 2012; Lewis et al., 2012; Schröter et al., 2012; Gómez et al., 2013; Jordan et al., 2013; Liu et al., 2013a, b).
A common feature of most, but not all, previous work is the use of a single anesthetic (propofol), which means that changes critical to loss of consciousness per se may be confounded by agent-specific changes. Similarly, rarely are the states of anesthetic-induced loss of consciousness and natural sleep directly compared during the same experiments. Finally, and perhaps most importantly, most previous studies have been limited, for technical reasons, in their temporal resolution, so that although the states before and after loss of consciousness can be well characterized, what happens at the critical transition is harder to discern.
In this paper, we recorded local field potentials (LFPs) from four brain regions simultaneously in freely moving rodents during transitions into natural sleep and anesthetic-induced loss of righting reflex. Our use of Morlet wavelets to analyze these signals provided a far higher time resolution than is usually obtained by using Fourier Power spectra calculated from segments of data (typically ≥10 s).
We measured from the barrel (BARR) cortex and the ventrobasal (VB) thalamus as representative of a first-order thalamocortical loop. We also recorded from the anterior cingulate cortex (CING) and the central medial thalamus (CMT), a higher-order (Sherman and Guillery, 2006; Jones, 2009) midline nucleus of the intralaminar complex, which projects widely to different cortical areas (Vertes et al., 2012), including the anterior cingulate.
Our data show strong similarities in the changes in the LFPs at high frequencies in the central medial thalamus at the point of anesthetic-induced loss of righting reflex, and following the transition into natural sleep. Moreover, for both natural sleep and propofol anesthesia, these changes occur significantly earlier than changes in the neocortex, suggesting that transition to loss of righting reflex is initiated by subcortical mechanisms.
Materials and Methods
Animals.
We used adult male Sprague Dawley rats (Charles River) weighing 320–360 g. All experiments were performed in accordance with the United Kingdom Home Office Animal Procedures Act (1986) with local ethical approval. We used a total of 22 animals. In many cases (13 of 22), the animals were used more than once (for sleep or anesthetic experiments), but for any given animal at least 7 d was allowed between experiments.
Surgery and recording electrodes.
Surgical procedures were performed under either isoflurane or ketamine/xylazine anesthesia, and animals were allowed at least 7 d to recover. Depending upon the experiment, we used either extradural stainless steel electrodes (J.I. Morris) to record cortical ECoG, or bipolar tungsten electrodes (1 mΩ impedance; MicroProbes) to record LFPs, or a combination of both. The coordinates of these electrodes are given in Table 1, and the nuclei chosen for LFP measurements are shown schematically in Figure 1A. In most experiments, an EMG electrode was imbedded in the trapezius muscles of the neck. Electrical signals were recorded on a wireless electronic recording device (Neurologger 2) at a sampling rate of 200 Hz as described previously (Pang et al., 2009; Vyssotski et al., 2009; Zecharia et al., 2012). The data recorded by the Neurologger were downloaded to a PC at the end of the experiment, and waveforms were visualized using Spike2 software (Cambridge Electronic Design) or MATLAB (MathWorks). When more than four signals were recorded, two Neurologgers were used.
Table 1.
Coordinates of recording sitesa
| Bipolar electrodes | Coordinates relative to bregma (mm) |
||
|---|---|---|---|
| AP | ML | DV | |
| CMT | −3.2 | 0.0 | −6.5 |
| CING | +3.0 | −0.8 | −2.3 |
| VB | −3.4 | −3.0 | −6.0 |
| BARR | −2.5 | −5.0 | −3.0 |
| Extradural electrodes | AP | ML | — |
|---|---|---|---|
| Frontal | +2.0 | +2.0 | — |
| Parietal | −6.3 | +2.0 | — |
aCoordinates of the recording electrodes relative to bregma: AP, anteroposterior; ML, mediolateral; DV, dorsoventral.
Figure 1.

Recording of LFPs. A, The four brain sites from which we recorded LFPs (for the coordinates, see Table 1). Red dots indicate the electrode positions determined postmortem. B, Four representative brain sections verifying electrode placements (red arrows) for the CMT, CING, VB, and BARR deduced from the tracts. C, An example of LFPs recorded from the CING, CMT, BARR, and VB. These data were recorded from an animal under dexmedetomidine anesthesia. D, In experiments with anesthetics, a rat was placed in a rotating Plexiglas tube, and the electrical signals from the implanted electrodes were recorded on a small device that was plugged into a socket fixed to the animal's skull. Anesthetics were introduced, when required, via an implanted jugular vein catheter. E, Examples of Morlet wavelet power spectra from two of the LFP traces (for the central medial thalamus and the cingulate cortex) shown in C. Black lines contour the power that has 95% significance above a red-noise background. F, An example of the cross-wavelet transform between the CMT and the cingulate cortex. This function has high power where there is large covariant power in the individual spectra and also provides a phase angle at every time and frequency. G, Examples of phase plots for the cross-wavelet transform in F, for the two frequency domains with significant covariant power. In this example, the phase plots show that there is no significant phase relationship between the two LFP signals in the frequency range 20–32 Hz, but a high degree of phase coherence in the δ range of frequencies of 1–4 Hz, with the LFP in the central medial thalamus leading the LFP in the cingulate by ∼40°.
Coordinates of recording electrodes.
The coordinates are given in Table 1. We chose to record from the VB thalamus and BARR as representative of a first-order thalamocortical loop, and the CMT and CING as representative of a higher-order thalamocortical circuit (Hofle et al., 1997; Schiff, 2008; Vertes et al., 2012).
Verification of electrode placement.
Following completion of all recordings, animals were deeply anesthetized with xylazine and ketamine (i.p.). The rat was perfused through the heart with ice-cold saline followed by 4% PFA. The brain was then removed, fixed in 4% PFA, and equilibrated in 30% sucrose. Brains were frozen in dry ice, and 50 μm slices, cut on a cryostat, were then mounted on glass slides. Electrode placement was verified by following the tract of the electrode in the histological slices (Fig. 1B).
Polarity of bipolar electrodes.
In all animals, the electrodes were placed in the same orientation (medial-lateral) with the same nominal polarity. To standardize our recordings, we recorded LFPs during periods of NREM sleep and established the phase relationships of the δ oscillations between the electrodes. In most cases (∼75%), the neocortical signals (CING and BARR) were in phase, as has been shown previously (Destexhe et al., 1999); in those recordings where they were in anti-phase, the polarity of one electrode was reversed. Also, in most cases, during NREM, the thalamic electrodes CMT and VB led the neocortical signals by ∼90°; but in cases where either one lagged by 90°, the polarity of that signal was reversed. The phase relationships in the NREM state served as a reference, and the anesthetic experiments were all done having first established consistent polarities.
Anesthetics and loss of righting reflex.
When anesthetics were administered, this was done using a syringe pump (Harvard 22, Harvard Apparatus) through a silicon septum via an indwelling venous catheter that had been inserted into the right jugular vein. Propofol (10 mg/ml) was infused at 10 mg kg−1 min−1 and dexmedetomidine (20 μg/ml) was infused at 20 μg kg−1 min−1. Recordings were made for 5 min before drug infusion, which in most experiments was terminated at the point of loss of righting reflex. Throughout the experiment, the animal was placed inside a continuously rotating (at 3 rpm) chamber (Fig. 1D), and loss of righting reflex defined as the point when the animal rolled onto its side and all four paws left the surface of the rotating tube and did not attempt to right itself.
Recordings during natural sleep.
ECoG, LFP, and EMG recordings were made during the “lights on” period in a 12:12 h light:dark cycle when the animals were housed in their home cages. Sleep states were scored using the EMG together with the ECoG or LFP using a previously defined algorithm (Costa-Miserachs et al., 2003). In essence, a high EMG together with a intermediate θ (6–10 Hz) to δ (1–4 Hz) ratio was scored as waking state (WAKE), a low EMG together with a high θ to δ ratio was scored as REM sleep, and a low EMG together with high δ and a low θ to δ ratio was scored as non-REM sleep. Any 5 s epoch that did not fulfill these criteria was scored as a “doubt.” Fewer than 2% of the epochs were scored as doubts, and these were not included in the analysis.
Data analysis using Morlet wavelet transforms.
A representative set of LFP recordings is shown in Figure 1C. LFP recordings were analyzed using Wavelet transforms (Torrence and Compo, 1998), which are appropriate when the signal is nonstationary; the Wavelet power spectrum is the square of the Wavelet transform (Fig. 1E). This method involves convoluting the LFP or ECoG signal with a series of “Daughter” wavelets, which are time-scaled variants of a “Mother” wavelet. In general, the wavelet transform is defined as follows:
 |
where s and t represent the scale and local center of the wavelet ψ(s, τ), and x(t) is the LFP signal as a function of time τ. We used the most commonly used Mother wavelet, the Morlet function, which is a complex sinusoid, windowed by a Gaussian:
 |
where η is a dimensionless “time” parameter and ω0 is the dimensionless wavelet central “frequency,” which was set to 6 to satisfy the admissibility criterion (Farge, 1992). The Wavelet power spectra, which are given by the square of the wavelet transform, were calculated using MATLAB (MathWorks) with a script based on that of Torrence and Compo (1998). We investigated the relationship between LFPs from different electrodes by evaluating the cross-wavelet transform (Grinsted et al., 2004), Wxy(s, τ), which is calculated by multiplying the cross-wavelet transform of one signal, x, by the complex conjugate of the wavelet transform of a second signal, y. Thus:
 |
This cross-wavelet transform is large where both signals have high covariant power in both the time and frequency domains (Fig. 1F). The phase relationship between the two LFP signals can be calculated using the following:
 |
where φ is the phase angle at scale s and time τ, and ℑ and ℜ are the imaginary and real parts of the cross-wavelet transform Wxy, respectively (Fig. 1G). For both the wavelet power spectra and the cross-wavelet transforms, a 95% confidence level was calculated assuming a red noise background (Torrence and Compo, 1998; Bédard and Destexhe, 2009). Only data that exceeded the 95% confidence level were included in the analysis.
In most cases, analyses of changes in power or phase angle during LORR involved following a fixed band of frequencies (e.g., δ oscillations between 1 and 4 Hz or θ oscillations between 5 and 9 Hz), for high-frequency oscillations; however, where there were large and continuous changes in frequency and power, the peak power and frequency at peak power were calculated at each time using a script in MATLAB that identified a peak within a broad band of frequencies (e.g., between 10 and 64 Hz) and followed peak power and frequency with time.
Results
Transitions into natural NREM sleep
To compare anesthetic-induced loss of consciousness with natural sleep, we first investigated the transitions from the waking state into NREM sleep. These experiments used rats (n = 9) housed in their home cages. In addition to recording LFPs from the individual thalamic nuclei and neocortical regions (CMT, CING, VB, and BARR; Fig. 1), we also measured ECoG signals using frontoparietal dural electrodes. These more global measurements of cortical activity are traditionally used, together with the EMG, to score an animal as being in WAKE, or sleeping in REM or NREM (Costa-Miserachs et al., 2003). Transitions into NREM are characterized by an increase in the ratio of δ to θ power, accompanied by a reduction in EMG power. During daytime, when NREM is at a maximum, rats typically had ∼8 periods of consolidated sleep, and we scored multiple WAKE-NREM transitions. Interestingly, following the abrupt WAKE-NREM transition identified using the EMG and ECoG, we could identify a transitional period of 10–20 s, immediately following the loss in muscle tone, before power in the δ band was fully established in the LFPs (Fig. 2). Immediately at the start of the “NREM onset” period, there was a change in the oscillations at higher frequencies (20–40 Hz). In the ECoG and the LFPs, these oscillations all dropped in frequency and increased in power (Fig. 3A), although the power increase was most marked in the CMT and the ECoG. However, among the LFPs, the changes in frequency and power occurred first in the CMT (Fig. 3B,C). After ∼10–20 s, there was a general and abrupt increase in power at δ (1–4 Hz) frequencies (Figs. 2 and 3D), accompanied by a less marked increase in frequencies between 5 and 9 Hz (Fig. 3D).
Figure 2.
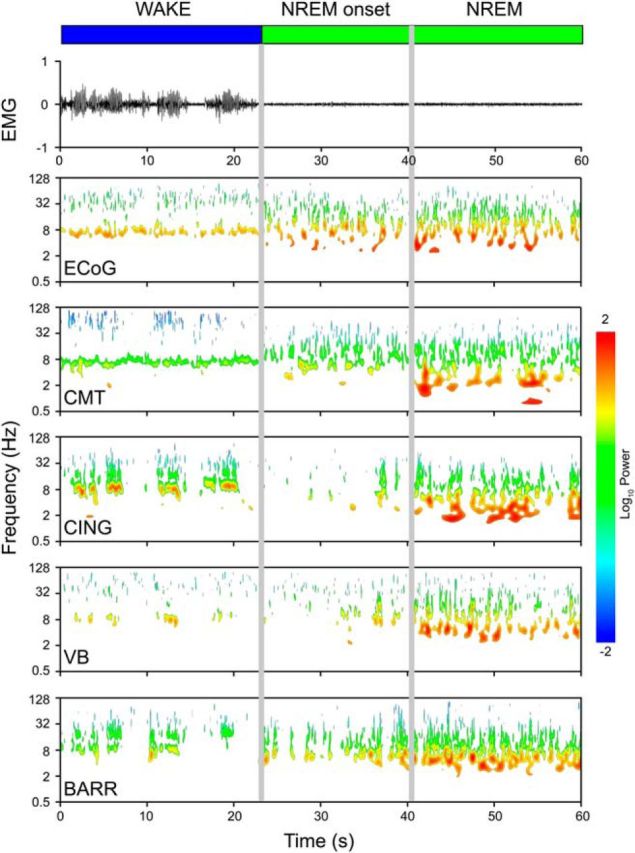
Transition into natural sleep. EMG recording and Morlet wavelet power spectra for an individual rat showing a transition between the waking state and NREM sleep. The Morlet wavelet spectra are shown for a dural electrode (ECoG) and four bipolar electrodes: the CMT, CING, VB, and BARR. Only power that had 95% significance above a red-noise background is shown. At the start of NREM, there was a period of 10–20 s (NREM onset) before NREM is fully established.
Figure 3.

Spectral analysis for transitions into natural sleep. A, Average data (n = 9 animals) showing the changes in peak power, and frequency at peak power between 20 and 40 Hz during the transitions. B, Half-times for γ frequency decrease at NREM onset. C, Half-times for γ power increase at NREM onset. B, C, p values are from paired t tests with respect to the CMT and are shown where significant differences occurred. D, Increases in power in the 1–4 Hz frequency band (open bars) and the 5–9 Hz frequency band (shaded bars) from WAKE to NREM (n = 9 animals). E, Phase relationships between the δ oscillations during NREM sleep. Red arrows indicate the average phase angle (n = 9 animals) between the indicated nuclei. Gray areas represent the phase angle distributions for an individual animal. The δ oscillations in both thalamic nuclei led those in the cortex by ∼90°, whereas there are no phase differences between the two neocortical regions or between the two thalamic nuclei. Error bars indicate SEM.
Once the δ oscillations in the LFPs were established across the four recording sites during NREM, we could determine the relative phases of the oscillations. These are shown in Figure 3E both for a representative animal (but multiple NREM periods) and as averages for all animals (red arrows). The LFPs in the δ range of frequencies (1–4 Hz) recorded from the thalamic nuclei (CMT and VB) led those recorded from the neocortical regions (CING and BARR, respectively) by ∼90°, whereas the two neocortical signals were in phase, as were the two thalamic signals. The average phase angles and their SEM values are given in Table 2.
Table 2.
Phase differences in δ oscillations between recording sitesa
| Electrode pair | Dexmedetomidine anesthesia |
NREM | |
|---|---|---|---|
| Before LORR | After LORR | ||
| CMT–CING | 136 ± 26° | 89 ± 18° | 112 ± 11° |
| VB–BARR | 100 ± 34° | 91 ± 32° | 77 ± 19° |
| CING–BARR | 348 ± 27° | 338 ± 23° | 354 ± 13° |
| CMT–VB | 15 ± 19° | 318 ± 18° | 359 ± 8° |
| CMT–BARR | 90 ± 20° | 61 ± 21° | 64 ± 15° |
| VB–CING | 126 ± 13° | 112 ± 29° | 68 ± 28° |
aPhase differences in the δ frequency band (1–4 Hz) between the recording sites calculated from the cross-wavelet transform during natural sleep (NREM) and dexmedetomidine anesthesia.
Transitions into propofol-induced loss of righting reflex
When propofol (10 mg/ml) was infused at 10 mg kg−1 min−1 into the right jugular vein, rats placed inside the rotating cylinder lost their righting reflex after 48 ± 3 s (mean ± SEM; n = 11). Before LORR, the rats were able to maintain an upright posture and showed high power in the EMG (Fig. 4). For ∼20 s after injection, the LFP power spectra showed little change, with the most dominant feature being the θ oscillations at ∼8 Hz, characteristic of moving rodents (Vanderwolf, 1969), and sporadic bursts of power at γ frequencies (∼40 Hz). However, at ∼30 s before LORR, there was a marked increase in power in the γ frequency band and a coincident, gradual reduction in frequency (Figs. 4 and 5A). The frequency of the oscillations continuously reduced from ∼40 Hz to ∼20 Hz and then remained stable (Fig. 5A). The increase in peak power occurred in all four recording sites (CMT, CING, VB, and BARR) and reached a maximum at around LORR. This increase in power was characteristically different for the CMT compared with that seen in the other three regions, starting significantly earlier and with power reaching a peak at LORR but then subsiding somewhat (Fig. 5A). Half-times that characterized the changes in power and frequency in the high-frequency oscillations were obtained from data for individual animals. The half-times between the initial and maximum powers and minimal frequencies are shown in Figure 5B, C, where it can be seen that the power increases in the CMT significantly before the other three sites and the frequency changes in the CMT occur significantly earlier than changes in the VB and BARR.
Figure 4.

Propofol-induced loss of righting reflex. EMG recording and Morlet wavelet power spectra for an individual rat showing a transition into loss of righting reflex following an intravenous injection of propofol. The Morlet wavelet spectra are shown for four bipolar electrodes: the CMT, CING, VB, and BARR. Only power that had 95% significance above a red-noise background is shown.
Figure 5.

Spectral analysis for transitions into propofol anesthesia. A, Average data (n = 11 animals) showing changes in peak power, and frequency at peak power for higher frequency oscillations (20–40 Hz) during the states just before and just after LORR. B, Half-times for γ frequency decrease at propofol LORR. C, Half-times for γ power increase at propofol LORR. B, C, p values are from paired t tests with respect to the CMT. D, Increases in power in the 1–4 Hz frequency band (open bars) and the 5–9 Hz frequency band (shaded bars) from WAKE to LORR (n = 11 animals). Error bars indicate SEM.
In addition to the gradual changes in the power and frequency of the high-frequency oscillations, a striking additional feature in the LFPs was the sudden appearance of a strong oscillation ∼8 Hz, more or less coincident with LORR (Figs. 4 and Fig. 5D). Power in this band of frequencies was not significantly above noise just before LORR but increased substantially following LORR (Fig. 5D). There was also an increase in power in the δ range (1–4 Hz) following propofol infusion (Fig. 5D), but this consisted of brief sporadic bursts of power, with no consistent phase relationships between the recording sites. We did note, however, that, following a period of propofol anesthesia, the eventual recovery and return to waking occurred from a state that resembled natural sleep with consistently high δ power, and was not simply a reversal of the changes observed during induction.
Transitions into dexmedetomidine-induced loss of righting reflex
Approximately 50 s after the α2-adrenergic receptor agonist dexmedetomidine (20 μg/ml) was infused at 20 μg kg−1 min−1 into the right jugular vein, power increased in the δ range of frequencies (Fig. 6) and remained stable at ∼3 Hz before LORR (n = 7). There were also clear changes in the high-frequency oscillations between the waking state and the period before dexmedetomidine LORR (Fig. 7A), with frequency at peak power decreasing and power increasing in all recording sites (CMT, CING, VB, and BARR). After a stable period with little change, LORR occurred suddenly, without warning, at 116 ± 14 s (mean ± SEM; n = 7) after the start of the infusion. This was accompanied by a large reduction in EMG power (Fig. 6). Also, at LORR, the higher-frequency oscillations dropped further in frequency, and this occurred simultaneously across all recording sites (Fig. 7B), just before LORR. The half-times for this transition could be accurately determined from the reductions in frequency (Fig. 7B) but not for the increases in power because these changes were too poorly defined for individual animals to allow reliable curve fits. Immediately following LORR, there was also an abrupt drop in δ frequency of ∼0.5 Hz (Figs. 6 and 7C) from a mean value of ∼3 Hz across the nuclei (although this change was not significant in VB). The changes in θ (5–9 Hz) and δ (1–4 Hz) power when moving from the waking state to dexmedetomidine LORR (Fig. 7D) mirrored those observed between waking and NREM sleep (Fig. 3D).
Figure 6.

Dexmedetomidine-induced loss of righting reflex. EMG recording and Morlet wavelet power spectra for an individual rat showing a transition into loss of righting reflex following an intravenous injection of dexmedetomidine. The Morlet wavelet spectra are shown for four bipolar electrodes: the CMT, CING, VB, and BARR. Only power that had 95% significance above a red-noise background is shown.
Figure 7.

Spectral analysis for transition into dexmedetomidine anesthesia. A, Average data (n = 7 animals) showing changes in peak power, and frequency at peak power for higher frequency oscillations (20–40 Hz) between the waking state and the states just before and just after LORR. B, Half-times for γ frequency decrease at dexmedetomidine LORR. C, Average data (n = 7 animals) showing the δ frequency before LORR and its reduction following LORR. *p < 0.05. D, Increases in power in the 1–4 Hz frequency band (open bars) and the 5–9 Hz frequency band (shaded bars) from WAKE to LORR (n = 7 animals). E, Phase relationships between the δ oscillations (1–4 Hz) before (top) and after (bottom) dexmedetomidine-induced LORR. Red arrows indicate the average phase angle (n = 7 animals) between the indicated thalamic nuclei or neocortical regions. Averages were taken over 10 s periods just before and just after LORR using only phases where the cross-wavelet transform was contoured above noise with 95% confidence. Gray areas represent the phase angle distributions for an individual animal. Error bars indicate SEM. p values are from paired t tests between the phase before and after LORR, and are shown where significant differences occurred.
Strong phase coherence was observed in the δ oscillations between the different recording sites that resembled those seen during NREM sleep (Fig. 3E). Once the δ oscillations had become established, the thalamic LFPs led the cortical LFPs by ∼90° (CMT-CING and VB-BARR), whereas the LFPs recorded between the cortical electrodes (CING-BARR) and between the thalamic electrodes (CMT-VB) were in phase (Fig. 7E). Immediately at LORR, however, there was a sudden phase change with the phase lead of the CMT decreasing by ∼45° with respect to the other three recording sites (Fig. 7E).
Discussion
We used multisite recording of LFPs in the brain and fast temporal analysis (Morlet wavelets) to investigate the controversy as to whether the neocortex or a subcortical region is the first to show changed activity at the boundary between the waking state and anesthetic-induced unconsciousness. Our principal finding is that, although there are changes in the LFPs that are anesthetic specific, altered activity in a band of high-frequency oscillations can be detected in a higher-order thalamic nucleus (CMT) significantly earlier than changes can be detected in the neocortex during transitions into natural sleep and propofol-induced loss of righting reflex. Our data with natural sleep identify a novel stage that precedes fully established NREM during which changes in the CMT are apparent with little change in a first-order thalamic nucleus, VB. Our most striking discovery with dexmedetomidine is that, in addition to it inducing a state similar to NREM, there is an abrupt phase change in the LFPs at δ frequencies in the CMT at the point of loss of righting reflex. We shall discuss each of these transitions in turn.
In rodents, NREM sleep is characterized by an increase in the ratio of δ to θ power in the EEG, and this was seen in the LFPs when NREM was fully established. However, before this point, there is a short transitional period where there is a large increase in power, and reduction in frequency, in the higher frequency oscillations recorded in the CMT, with smaller, or insignificant, changes in the other nuclei.
The changes that we observe in the CMT add weight to the proposal that such midline and intralaminar thalamic nuclei are hubs regulating cortical arousal and natural sleep (Glenn and Steriade, 1982; Van der Werf et al., 2002; Picchioni et al., 2014). At sleep onset, these nuclei receive a diminished input from the ascending reticular activating system (Siegel, 2004; Saper et al., 2010). Our observation that LFPs change in the CMT at the onset of NREM supports current thinking about the subcortical control of sleep states (Saper et al., 2010) and the observation that thalamic deactivation precedes a reduction in cortical arousal at sleep onset (Magnin et al., 2010). It seems clear that cortical changes, such as the breakdown in connectivity, observed during natural NREM sleep (Massimini et al., 2005), are initiated by subcortical neuronal mechanisms.
The α2 adrenergic receptor agonist dexmedetomidine initially causes a “sleep-like” sedative state (Kamibayashi and Maze, 2000; Venn and Grounds, 2001), but at higher concentrations it causes LORR (Gelegen et al., 2014). During the initial period, the LFPs from the two thalamic nuclei and the two neocortical regions showed high power in the δ band of frequencies, similar to that observed during NREM. Also, the phase coherence at these frequencies observed with dexmedetomidine and sleep were similar, with the cortical signals being locked in phase and the thalamic signals differing from those in the cortex by ∼90°.
Also, as with NREM sleep, dexmedetomidine caused a sudden drop in frequency from ∼40 Hz to ∼20 Hz in all brain regions. This drop in frequency was accompanied by increases in power that were also similar to those that occurred during the transition into NREM. What was quite unexpected were the sudden changes in the LFPs observed in the δ band at the instant of LORR. Exactly coincident with the drop in the EMG, there was a discrete drop in frequency in all regions, accompanied by a change in the phase advancement in the CMT of ∼45° compared with the other three recording sites. (Such changes cannot be measured for natural sleep or propofol anesthesia because δ oscillations exist only after the transition and not during the waking state before NREM sleep or LORR.) Assuming that this is the cause, not a consequence, of LORR, what might be responsible for these changes in the CMT δ oscillations? Delta oscillations are due to a thalamocortical reverberation involving hyperpolarization of thalamocortical neurons, which occurs, for example, when ascending drive from arousal pathways are reduced. Experimental measurements (Yue and Huguenard, 2001) and theoretical models (Lytton et al., 1996) indicate that the oscillation frequency reduces as the hyperpolarization increases. Furthermore, as the frequency slows, the preferred phase of thalamocortical neuron firing with respect to cortical LFPs is retarded (Slézia et al., 2011). These observations would broadly explain the changes we see. We speculate that a coordinated reduction in ascending arousal causes a drop in δ frequency, which in turn leads to a phase retardation in the CMT with respect to the neocortex. Because information can be encoded by the phase in the LFP at which a neuron fires (Fries et al., 2007), a sudden phase change is likely to disrupt thalamocortical communication and could, therefore, be the cause rather than the consequence of LORR.
Propofol is the most widely used intravenous anesthetic with molecular targets, GABAA receptors, quite distinct from dexmedetomidine's. Nonetheless, for both anesthetics, we observed changes in the power and frequency of γ oscillations at, or before, LORR. With propofol, these oscillations grow in strength and drop in frequency ∼30 s before LORR. The increase in power is most pronounced, and starts earlier, in the CMT, several seconds before any changes can be detected at the other sites. Similar changes in frequency and power can be seen in the human cortical EEG (Purdon et al., 2013) before loss of consciousness. Our observation of strengthening γ oscillations in the CMT before any other changes occur in the neocortex suggests a subcortical origin. Indeed, inactivation of thalamic inputs causes selective long-term elimination of fast (>10 Hz) oscillations in cortical LFPs (Lemieux et al., 2014). The thalamus receives dense innervation from brainstem nuclei, and some of these nuclei can generate γ oscillations (Simon et al., 2010; Kezunovic et al., 2011; Garcia-Rill et al., 2013) with the frequency reducing as the neurons become hyperpolarized. Most network models also predict that the frequency will drop as afferent synaptic input reduces (Whittington et al., 2000; Buzsáki and Wang, 2012; Economo and White, 2012). Although this latter consideration may account for the drop in frequency seen during the transitions into natural sleep and dexmedetomidine-induced LORR, an additional factor must come into play with propofol. All anesthetics acting on GABAA receptors slow γ oscillations (Whittington et al., 2000; Dickinson et al., 2003), and this might cause a resonance with other networks, perhaps in subcortical structures, where the frequency has reduced due to a reduction in afferent input. This might account for the large increase in power as the γ band tunes down to the strong 20 Hz “beta” oscillations that we see just before propofol-induced LORR. Similarly, a resonance between cortical and thalamocortical oscillations has been proposed to account for the large increase in power at ∼8 Hz occurring immediately following LORR (Ching et al., 2010). Another EEG signature observed in humans during propofol anesthesia (Ní Mhuircheartaigh et al., 2013; Purdon et al., 2013) is the steady buildup in power at low (<1 Hz) frequencies, but we did not observe this in the LFPs.
Our results highlight the pivotal role that higher-order thalamic nuclei might play during transitions into unconsciousness (Alkire et al., 2000, 2007; Liu et al., 2013a; Giacino et al., 2014). In contrast to first-order nuclei that are driven mainly by sensory input, the higher-order nuclei receive their main driving input from large areas of neocortex. Indeed, such nuclei may serve as the main relay of information from one neocortical area to another (Sherman and Guillery, 2006) so that disruption to this key hub would inevitably lead to a breakdown in cortical connectivity that seems to be a common feature of the unconscious state. Interestingly, the intralaminar nuclei (in contrast to specific sensory nuclei) receive extensive innervation from a pontine nucleus (Sukhotinsky et al., 2007) that has been proposed as a critical target for GABAergic anesthetics (Devor and Zalkind, 2001). Another important feature of higher-order nuclei is the extrareticular GABAergic input they receive, such as from the zona incerta and globus pallidus. Indeed, this difference might be important in determining the preferred phase of firing of thalamocortical neurons, which not only differs between first-order and higher-order nuclei but can change differentially in response to differing inputs (Slézia et al., 2011). This might account for the preferential change in phase in the CMT that we observed at dexmedetomidine-induced LORR.
In conclusion, our data support the view (Alkire et al., 2000; Devor and Zalkind, 2001; Nelson et al., 2002) that, at least for the general anesthetics propofol and dexmedetomidine, effects are initiated via subcortical mechanisms, rather than in the neocortex, and that there are preferential effects mediated by thalamic nuclei that form part of the intralaminar complex (Alkire et al., 2000, 2007).
Footnotes
This work was supported by the Medical Research Council (G0901892 to N.P.F., S.G.B., and W.W.; G0800399 to W.W.), the Biotechnology and Biological Sciences Research Council (G021691 to N.P.F., S.G.B., and W.W.), the Wellcome Trust (WT094211MA to S.G.B., N.P.F., and W.W.), a Biological Sciences Research Council studentship (T.C.G.), a National Institute of Academic Anaesthesia studentship (R.B.), and the Chinese Society of Anesthesiology (Q.Y.). We thank Neal Powell for the artwork.
The authors declare no competing financial interests.
This is an Open Access article distributed under the terms of the Creative Commons Attribution License (http://creativecommons.org/licenses/by/3.0), which permits unrestricted use, distribution and reproduction in any medium provided that the original work is properly attributed.
References
- Alkire MT, Haier RJ, Fallon JH. Toward a unified theory of narcosis: brain imaging evidence for a thalamocortical switch as the neurophysiologic basis of anesthetic-induced unconsciousness. Conscious Cogn. 2000;9:370–386. doi: 10.1006/ccog.1999.0423. [DOI] [PubMed] [Google Scholar]
- Alkire MT, McReynolds JR, Hahn EL, Trivedi AN. Thalamic microinjection of nicotine reverses sevoflurane-induced loss of righting reflex in the rat. Anesthesiology. 2007;107:264–272. doi: 10.1097/01.anes.0000270741.33766.24. [DOI] [PubMed] [Google Scholar]
- Alkire MT, Hudetz AG, Tononi G. Consciousness and anesthesia. Science. 2008;322:876–880. doi: 10.1126/science.1149213. [DOI] [PMC free article] [PubMed] [Google Scholar]
- Bédard C, Destexhe A. Macroscopic models of local field potentials and the apparent 1/f noise in brain activity. Biophys J. 2009;96:2589–2603. doi: 10.1016/j.bpj.2008.12.3951. [DOI] [PMC free article] [PubMed] [Google Scholar]
- Boveroux P, Vanhaudenhuyse A, Bruno MA, Noirhomme Q, Lauwick S, Luxen A, Degueldre C, Plenevaux A, Schnakers C, Phillips C, Brichant JF, Bonhomme V, Maquet P, Greicius MD, Laureys S, Boly M. Breakdown of within- and between-network resting state functional magnetic resonance imaging connectivity during propofol-induced loss of consciousness. Anesthesiology. 2010;113:1038–1053. doi: 10.1097/ALN.0b013e3181f697f5. [DOI] [PubMed] [Google Scholar]
- Buzsáki G, Wang XJ. Mechanisms of γ oscillations. Annu Rev Neurosci. 2012;35:203–225. doi: 10.1146/annurev-neuro-062111-150444. [DOI] [PMC free article] [PubMed] [Google Scholar]
- Ching S, Cimenser A, Purdon PL, Brown EN, Kopell NJ. Thalamocortical model for a propofol-induced α-rhythm associated with loss of consciousness. Proc Natl Acad Sci U S A. 2010;107:22665–22670. doi: 10.1073/pnas.1017069108. [DOI] [PMC free article] [PubMed] [Google Scholar]
- Costa-Miserachs D, Portell-Cortés I, Torras-Garcia M, Morgado-Bernal I. Automated sleep staging in rat with a standard spreadsheet. J Neurosci Methods. 2003;130:93–101. doi: 10.1016/S0165-0270(03)00229-2. [DOI] [PubMed] [Google Scholar]
- Destexhe A, Contreras D, Steriade M. Spatiotemporal analysis of local field potentials and unit discharges in cat cerebral cortex during natural wake and sleep states. J Neurosci. 1999;19:4595–4608. doi: 10.1523/JNEUROSCI.19-11-04595.1999. [DOI] [PMC free article] [PubMed] [Google Scholar]
- Devor M, Zalkind V. Reversible analgesia, atonia, and loss of consciousness on bilateral intracerebral microinjection of pentobarbital. Pain. 2001;94:101–112. doi: 10.1016/S0304-3959(01)00345-1. [DOI] [PubMed] [Google Scholar]
- Dickinson R, Awaiz S, Whittington MA, Lieb WR, Franks NP. The effects of general anaesthetics on carbachol-evoked γ oscillations in the rat hippocampus in vitro. Neuropharmacology. 2003;44:864–872. doi: 10.1016/S0028-3908(03)00083-2. [DOI] [PubMed] [Google Scholar]
- Economo MN, White JA. Membrane properties and the balance between excitation and inhibition control γ-frequency oscillations arising from feedback inhibition. PLoS Comput Biol. 2012;8:e1002354. doi: 10.1371/journal.pcbi.1002354. [DOI] [PMC free article] [PubMed] [Google Scholar]
- Farge M. Wavelet transforms and their applications to turbulence. Annu Rev Fluid Mechanics. 1992;24:395–457. doi: 10.1146/annurev.fl.24.010192.002143. [DOI] [Google Scholar]
- Franks NP. General anaesthesia: from molecular targets to neuronal pathways of sleep and arousal. Nat Rev Neurosci. 2008;9:370–386. doi: 10.1038/nrn2372. [DOI] [PubMed] [Google Scholar]
- Fries P, Nikolić D, Singer W. The γ cycle. Trends Neurosci. 2007;30:309–316. doi: 10.1016/j.tins.2007.05.005. [DOI] [PubMed] [Google Scholar]
- Garcia-Rill E, Kezunovic N, Hyde J, Simon C, Beck P, Urbano FJ. Coherence and frequency in the reticular activating system (RAS) Sleep Med Rev. 2013;17:227–238. doi: 10.1016/j.smrv.2012.06.002. [DOI] [PMC free article] [PubMed] [Google Scholar]
- Gelegen C, Gent TC, Ferretti V, Zhang Z, Yustos R, Lan F, Yang Q, Overington DW, Vyssotski AL, van Lith HA, Wisden W, Franks NP. Staying awake: a genetic region that hinders α adrenergic receptor agonist-induced sleep. Eur J Neurosci. 2014;40:2311–2319. doi: 10.1111/ejn.12570. [DOI] [PMC free article] [PubMed] [Google Scholar]
- Giacino JT, Fins JJ, Laureys S, Schiff ND. Disorders of consciousness after acquired brain injury: the state of the science. Nat Rev Neurol. 2014;10:99–114. doi: 10.1038/nrneurol.2013.279. [DOI] [PubMed] [Google Scholar]
- Glenn LL, Steriade M. Discharge rate and excitability of cortically projecting intralaminar thalamic neurons during waking and sleep states. J Neurosci. 1982;2:1387–1404. doi: 10.1523/JNEUROSCI.02-10-01387.1982. [DOI] [PMC free article] [PubMed] [Google Scholar]
- Gómez F, Phillips C, Soddu A, Boly M, Boveroux P, Vanhaudenhuyse A, Bruno MA, Gosseries O, Bonhomme V, Laureys S, Noirhomme Q. Changes in effective connectivity by propofol sedation. PLoS One. 2013;8:e71370. doi: 10.1371/journal.pone.0071370. [DOI] [PMC free article] [PubMed] [Google Scholar]
- Grinsted A, Moore J, Jevrajeva S. Application of the cross-wavelet transform and wavelet coherence to geophysical time series. Nonlinear Processes Geophysics. 2004;11:561–566. doi: 10.5194/npg-11-561-2004. [DOI] [Google Scholar]
- Hofle N, Paus T, Reutens D, Fiset P, Gotman J, Evans AC, Jones BE. Regional cerebral blood flow changes as a function of δ and spindle activity during slow wave sleep in humans. J Neurosci. 1997;17:4800–4808. doi: 10.1523/JNEUROSCI.17-12-04800.1997. [DOI] [PMC free article] [PubMed] [Google Scholar]
- Jones EG. Synchrony in the interconnected circuitry of the thalamus and cerebral cortex. Ann N Y Acad Sci. 2009;1157:10–23. doi: 10.1111/j.1749-6632.2009.04534.x. [DOI] [PubMed] [Google Scholar]
- Jordan D, Ilg R, Riedl V, Schorer A, Grimberg S, Neufang S, Omerovic A, Berger S, Untergehrer G, Preibisch C, Schulz E, Schuster T, Schröter M, Spoormaker V, Zimmer C, Hemmer B, Wohlschläger A, Kochs EF, Schneider G. Simultaneous electroencephalographic and functional magnetic resonance imaging indicate impaired cortical top-down processing in association with anesthetic-induced unconsciousness. Anesthesiology. 2013;119:1031–1042. doi: 10.1097/ALN.0b013e3182a7ca92. [DOI] [PubMed] [Google Scholar]
- Kamibayashi T, Maze M. Clinical uses of α2-adrenergic agonists. Anesthesiology. 2000;93:1345–1349. doi: 10.1097/00000542-200011000-00030. [DOI] [PubMed] [Google Scholar]
- Kezunovic N, Urbano FJ, Simon C, Hyde J, Smith K, Garcia-Rill E. Mechanism behind γ band activity in the pedunculopontine nucleus. Eur J Neurosci. 2011;34:404–415. doi: 10.1111/j.1460-9568.2011.07766.x. [DOI] [PMC free article] [PubMed] [Google Scholar]
- Ku SW, Lee U, Noh GJ, Jun IG, Mashour GA. Preferential inhibition of frontal-to-parietal feedback connectivity is a neurophysiologic correlate of general anesthesia in surgical patients. PLoS One. 2011;6:e25155. doi: 10.1371/journal.pone.0025155. [DOI] [PMC free article] [PubMed] [Google Scholar]
- Långsjö JW, Alkire MT, Kaskinoro K, Hayama H, Maksimow A, Kaisti KK, Aalto S, Aantaa R, Jääskeläinen SK, Revonsuo A, Scheinin H. Returning from oblivion: imaging the neural core of consciousness. J Neurosci. 2012;32:4935–4943. doi: 10.1523/JNEUROSCI.4962-11.2012. [DOI] [PMC free article] [PubMed] [Google Scholar]
- Lemieux M, Chen JY, Lonjers P, Bazhenov M, Timofeev I. The impact of cortical deafferentation on the neocortical slow oscillation. J Neurosci. 2014;34:5689–5703. doi: 10.1523/JNEUROSCI.1156-13.2014. [DOI] [PMC free article] [PubMed] [Google Scholar]
- Lewis LD, Weiner VS, Mukamel EA, Donoghue JA, Eskandar EN, Madsen JR, Anderson WS, Hochberg LR, Cash SS, Brown EN, Purdon PL. Rapid fragmentation of neuronal networks at the onset of propofol-induced unconsciousness. Proc Natl Acad Sci U S A. 2012;109:E3377–E3386. doi: 10.1073/pnas.1210907109. [DOI] [PMC free article] [PubMed] [Google Scholar]
- Liu X, Lauer KK, Ward BD, Li SJ, Hudetz AG. Differential effects of deep sedation with propofol on the specific and nonspecific thalamocortical systems: a functional magnetic resonance imaging study. Anesthesiology. 2013a;118:59–69. doi: 10.1097/ALN.0b013e318277a801. [DOI] [PMC free article] [PubMed] [Google Scholar]
- Liu X, Pillay S, Li R, Vizuete JA, Pechman KR, Schmainda KM, Hudetz AG. Multiphasic modification of intrinsic functional connectivity of the rat brain during increasing levels of propofol. Neuroimage. 2013b;83:581–592. doi: 10.1016/j.neuroimage.2013.07.003. [DOI] [PMC free article] [PubMed] [Google Scholar]
- Lytton WW, Destexhe A, Sejnowski TJ. Control of slow oscillations in the thalamocortical neuron: a computer model. Neuroscience. 1996;70:673–684. doi: 10.1016/S0306-4522(96)83006-5. [DOI] [PubMed] [Google Scholar]
- Magnin M, Rey M, Bastuji H, Guillemant P, Mauguière F, Garcia-Larrea L. Thalamic deactivation at sleep onset precedes that of the cerebral cortex in humans. Proc Natl Acad Sci U S A. 2010;107:3829–3833. doi: 10.1073/pnas.0909710107. [DOI] [PMC free article] [PubMed] [Google Scholar]
- Massimini M, Ferrarelli F, Huber R, Esser SK, Singh H, Tononi G. Breakdown of cortical effective connectivity during sleep. Science. 2005;309:2228–2232. doi: 10.1126/science.1117256. [DOI] [PubMed] [Google Scholar]
- Mhuircheartaigh RN, Rosenorn-Lanng D, Wise R, Jbabdi S, Rogers R, Tracey I. Cortical and subcortical connectivity changes during decreasing levels of consciousness in humans: a functional magnetic resonance imaging study using propofol. J Neurosci. 2010;30:9095–9102. doi: 10.1523/JNEUROSCI.5516-09.2010. [DOI] [PMC free article] [PubMed] [Google Scholar]
- Nelson LE, Guo TZ, Lu J, Saper CB, Franks NP, Maze M. The sedative component of anesthesia is mediated by GABA(A) receptors in an endogenous sleep pathway. Nat Neurosci. 2002;5:979–984. doi: 10.1038/nn913. [DOI] [PubMed] [Google Scholar]
- Ní Mhuircheartaigh R, Warnaby C, Rogers R, Jbabdi S, Tracey I. Slow-wave activity saturation and thalamocortical isolation during propofol anesthesia in humans. Sci Transl Med. 2013;5:208ra148. doi: 10.1126/scitranslmed.3006007. [DOI] [PubMed] [Google Scholar]
- Pang DS, Robledo CJ, Carr DR, Gent TC, Vyssotski AL, Caley A, Zecharia AY, Wisden W, Brickley SG, Franks NP. An unexpected role for TASK-3 potassium channels in network oscillations with implications for sleep mechanisms and anesthetic action. Proc Natl Acad Sci U S A. 2009;106:17546–17551. doi: 10.1073/pnas.0907228106. [DOI] [PMC free article] [PubMed] [Google Scholar]
- Picchioni D, Pixa ML, Fukunaga M, Carr WS, Horovitz SG, Braun AR, Duyn JH. Decreased connectivity between the thalamus and the neocortex during human nonrapid eye movement sleep. Sleep. 2014;37:387–397. doi: 10.5665/sleep.3422. [DOI] [PMC free article] [PubMed] [Google Scholar]
- Purdon PL, Pierce ET, Mukamel EA, Prerau MJ, Walsh JL, Wong KF, Salazar-Gómez AF, Harrell PG, Sampson AL, Cimenser A, Ching S, Kopell NJ, Tavares-Stoeckel C, Habeeb K, Merhar R, Brown EN. Electroencephalogram signatures of loss and recovery of consciousness from propofol. Proc Natl Acad Sci U S A. 2013;110:E1142–E1151. doi: 10.1073/pnas.1221180110. [DOI] [PMC free article] [PubMed] [Google Scholar]
- Rudolph U, Antkowiak B. Molecular and neuronal substrates for general anaesthetics. Nat Rev Neurosci. 2004;5:709–720. doi: 10.1038/nrn1496. [DOI] [PubMed] [Google Scholar]
- Saper CB, Fuller PM, Pedersen NP, Lu J, Scammell TE. Sleep state switching. Neuron. 2010;68:1023–1042. doi: 10.1016/j.neuron.2010.11.032. [DOI] [PMC free article] [PubMed] [Google Scholar]
- Schiff ND. Central thalamic contributions to arousal regulation and neurological disorders of consciousness. Ann N Y Acad Sci. 2008;1129:105–118. doi: 10.1196/annals.1417.029. [DOI] [PubMed] [Google Scholar]
- Schröter MS, Spoormaker VI, Schorer A, Wohlschläger A, Czisch M, Kochs EF, Zimmer C, Hemmer B, Schneider G, Jordan D, Ilg R. Spatiotemporal reconfiguration of large-scale brain functional networks during propofol-induced loss of consciousness. J Neurosci. 2012;32:12832–12840. doi: 10.1523/JNEUROSCI.6046-11.2012. [DOI] [PMC free article] [PubMed] [Google Scholar]
- Sherman S, Guillery R. Exploring the thalamus and its role in cortical function. Cambridge, MA: MIT; 2006. [Google Scholar]
- Siegel J. Brain mechanisms that control sleep and waking. Naturwissenschaften. 2004;91:355–365. doi: 10.1007/s00114-004-0541-9. [DOI] [PubMed] [Google Scholar]
- Simon C, Kezunovic N, Ye M, Hyde J, Hayar A, Williams DK, Garcia-Rill E. Gamma band unit activity and population responses in the pedunculopontine nucleus. J Neurophysiol. 2010;104:463–474. doi: 10.1152/jn.00242.2010. [DOI] [PMC free article] [PubMed] [Google Scholar]
- Slézia A, Hangya B, Ulbert I, Acsády L. Phase advancement and nucleus-specific timing of thalamocortical activity during slow cortical oscillation. J Neurosci. 2011;31:607–617. doi: 10.1523/JNEUROSCI.3375-10.2011. [DOI] [PMC free article] [PubMed] [Google Scholar]
- Sukhotinsky I, Zalkind V, Lu J, Hopkins DA, Saper CB, Devor M. Neural pathways associated with loss of consciousness caused by intracerebral microinjection of GABAA-active anesthetics. Eur J Neurosci. 2007;25:1417–1436. doi: 10.1111/j.1460-9568.2007.05399.x. [DOI] [PubMed] [Google Scholar]
- Torrence C, Compo G. A practical guide to wavelet analysis. Bull Am Meteor Soc. 1998;79:61–78. doi: 10.1175/1520-0477(1998)079<0061:APGTWA>2.0.CO%3B2. [DOI] [Google Scholar]
- Van der Werf YD, Witter MP, Groenewegen HJ. The intralaminar and midline nuclei of the thalamus: anatomical and functional evidence for participation in processes of arousal and awareness. Brain Res Brain Res Rev. 2002;39:107–140. doi: 10.1016/S0165-0173(02)00181-9. [DOI] [PubMed] [Google Scholar]
- Vanderwolf CH. Hippocampal electrical activity and voluntary movement in the rat. Electroencephalogr Clin Neurophysiol. 1969;26:407–418. doi: 10.1016/0013-4694(69)90092-3. [DOI] [PubMed] [Google Scholar]
- Velly LJ, Rey MF, Bruder NJ, Gouvitsos FA, Witjas T, Regis JM, Peragut JC, Gouin FM. Differential dynamic of action on cortical and subcortical structures of anesthetic agents during induction of anesthesia. Anesthesiology. 2007;107:202–212. doi: 10.1097/01.anes.0000270734.99298.b4. [DOI] [PubMed] [Google Scholar]
- Venn RM, Grounds RM. Comparison between dexmedetomidine and propofol for sedation in the intensive care unit: patient and clinician perceptions. Br J Anaesth. 2001;87:684–690. doi: 10.1093/bja/87.5.684. [DOI] [PubMed] [Google Scholar]
- Vertes RP, Hoover WB, Rodriguez JJ. Projections of the central medial nucleus of the thalamus in the rat: node in cortical, striatal and limbic forebrain circuitry. Neuroscience. 2012;219:120–136. doi: 10.1016/j.neuroscience.2012.04.067. [DOI] [PubMed] [Google Scholar]
- Vyssotski AL, Dell'Omo G, Dell'Ariccia G, Abramchuk AN, Serkov AN, Latanov AV, Loizzo A, Wolfer DP, Lipp HP. EEG responses to visual landmarks in flying pigeons. Curr Biol. 2009;19:1159–1166. doi: 10.1016/j.cub.2009.05.070. [DOI] [PubMed] [Google Scholar]
- Whittington MA, Traub RD, Kopell N, Ermentrout B, Buhl EH. Inhibition-based rhythms: experimental and mathematical observations on network dynamics. Int J Psychophysiol. 2000;38:315–336. doi: 10.1016/S0167-8760(00)00173-2. [DOI] [PubMed] [Google Scholar]
- Yue BW, Huguenard JR. The role of H-current in regulating strength and frequency of thalamic network oscillations. Thalamus Relat Syst. 2001;1:95–103. doi: 10.1017/S1472928801000097. [DOI] [PMC free article] [PubMed] [Google Scholar]
- Zecharia AY, Yu X, Götz T, Ye Z, Carr DR, Wulff P, Bettler B, Vyssotski AL, Brickley SG, Franks NP, Wisden W. GABAergic inhibition of histaminergic neurons regulates active waking but not the sleep–wake switch or propofol-induced loss of consciousness. J Neurosci. 2012;32:13062–13075. doi: 10.1523/JNEUROSCI.2931-12.2012. [DOI] [PMC free article] [PubMed] [Google Scholar]